2028
Multiparametric Metabolic Imaging of Leukoencephalopathy at 7T: A Case Study1Center for Advanced Metabolic Imaging in Precision Medicine, Department of Radiology, University of Pennsylvania, Philadelphia, PA, United States, 2Penn Statistics in Imaging and Visualization Endeavour, Department of Biostatistics, Epidemiology, & Informatics, University of Pennsylvania, Philadelphia, PA, United States, 3Department of Neurology, University of Pennsylvania, Philadelphia, PA, United States
Synopsis
Keywords: White Matter, CEST & MT
Motivation: Standard structural MR imaging techniques are not able to provide information on the metabolic state of white matter lesion. Specialized imaging techniques such as NOE and GluCEST can complement these conventional images by leveraging larger chemical shifts at 7T.
Goal(s): To observe potential NOE and GluCEST contrast differences in a leukoencephalopathy patient at 7T.
Approach: GluCEST and NOE images were acquired at 7T. NOE experimental z-spectral data was fit with multi-pool Lorentzian fitting to produce five individual pool fits.
Results: DS, MT, and rNOE differentiated white matter changes as well as GluCEST changes in the gray matter in a leukoencephalopathy patient.
Impact: This method of ultra-high field MR imaging for patients with demyelinating conditions can provide complementary metabolic information to standard structural imaging that, when tracked longitudinally, can yield improved diagnostic outcomes and understanding of disease mechanism for this patient population.
Introduction
Leukoencephalopathy represents a group of genetic conditions that affect different white matter structural components within the central nervous system (CNS)1. Conventional MRI is a standard tool for this group of conditions due to the high diagnostic characterization it can provide in distinguishing degree of myelination2. Commonly used anatomic sequences provide the size and location-based information, however, these sequences provide low specificity in terms of the metabolic underpinnings of the underlying pathology. Ultra-high field strength (≥7T) MRI leverages greater signal-to-noise ratio (SNR) and larger chemical shifts allowing for the application of specialized sequences such as glutamate-weighted chemical exchange saturation transfer (GluCEST)3 and nuclear Overhauser effect (NOE)4 that can provide more specific metabolic information. Here it is investigated whether changes in GluCEST and NOE contrast, in conjunction with Lorentzian pool fitting, can be observed that conventional structural imaging cannot show in a patient with a leukoencephalopathy at 7T.Methods
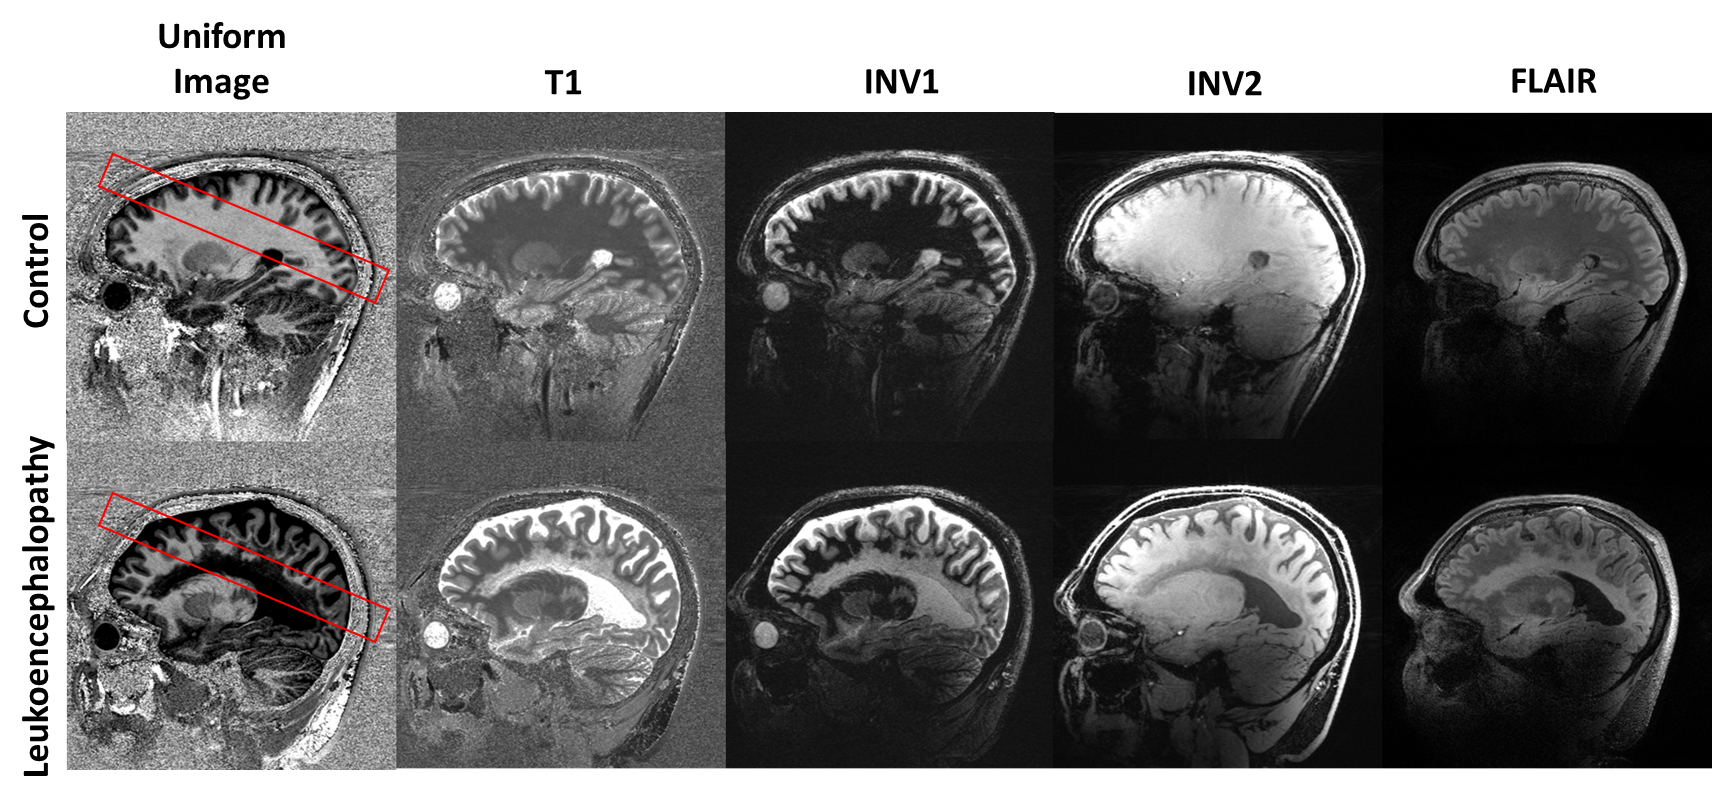
All images were acquired on a 7T system (MAGNEOTM Terra, Siemens Healthcare) using a single-channel transmit/32-channel receive phased array head coil (Nova Medical). Images were acquired on two male subjects: A 44-year old participant presenting with extensive leukoencephalopathy of unknown etiology and a 38-year old healthy subject. Subjects were imaged after obtaining informed consent under an approved Institutional Review Board protocol. Acquired image sets consisted of volumetric (24mm slab) GluCEST3,5 and NOEMTR4,6 to which z-spectra Lorentzian fitting was applied as outlined in Windschuh et al.7 along with WASSR acquisition8 to correct for B0 inhomogeneities and B1 mapping9 to account for B1+ inhomogeneities. Additionally, FLAIR and MP2RAGE image sets (T1 maps, Uniform Images (UNI), Inversion 1 (INV1), and Inversion 2 (INV2)) were acquired as reference comparison images. The 3D volume was acquired in an oblique orientation, illustrated by the red outline in Figure 1. A 4-dimensional Bloch Matching (BM4D) filter10 was used in the CEST-based images for denoising before fitting the NOE z-spectra into 5 pools: direct saturation (DS), magnetization transfer (MT), amide proton transfer (APT), creatine, and relayed NOE (rNOE).Results
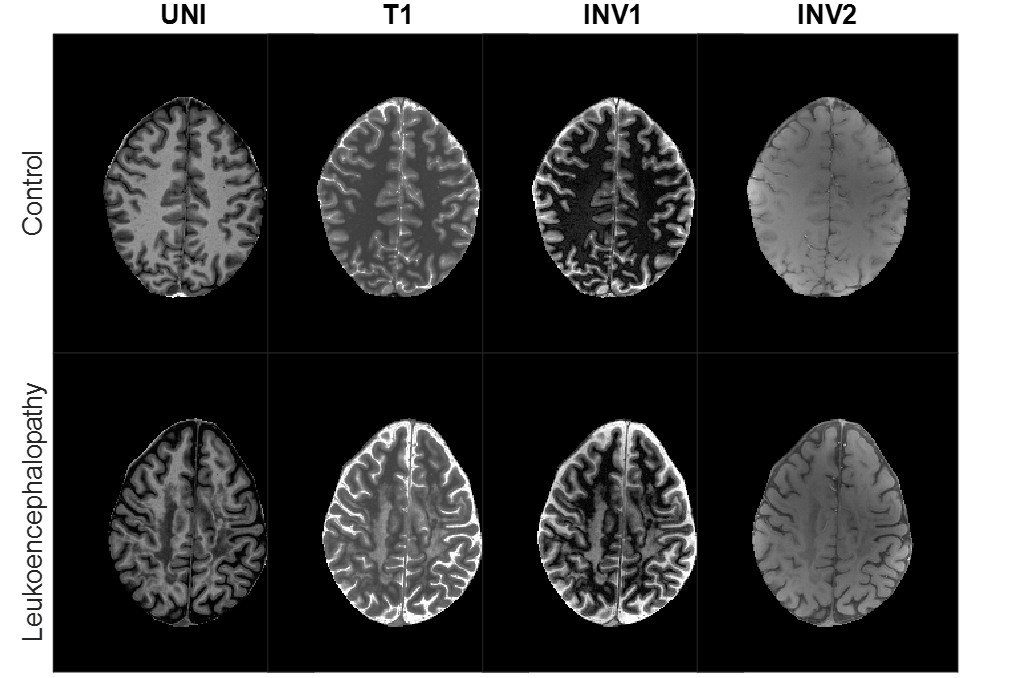
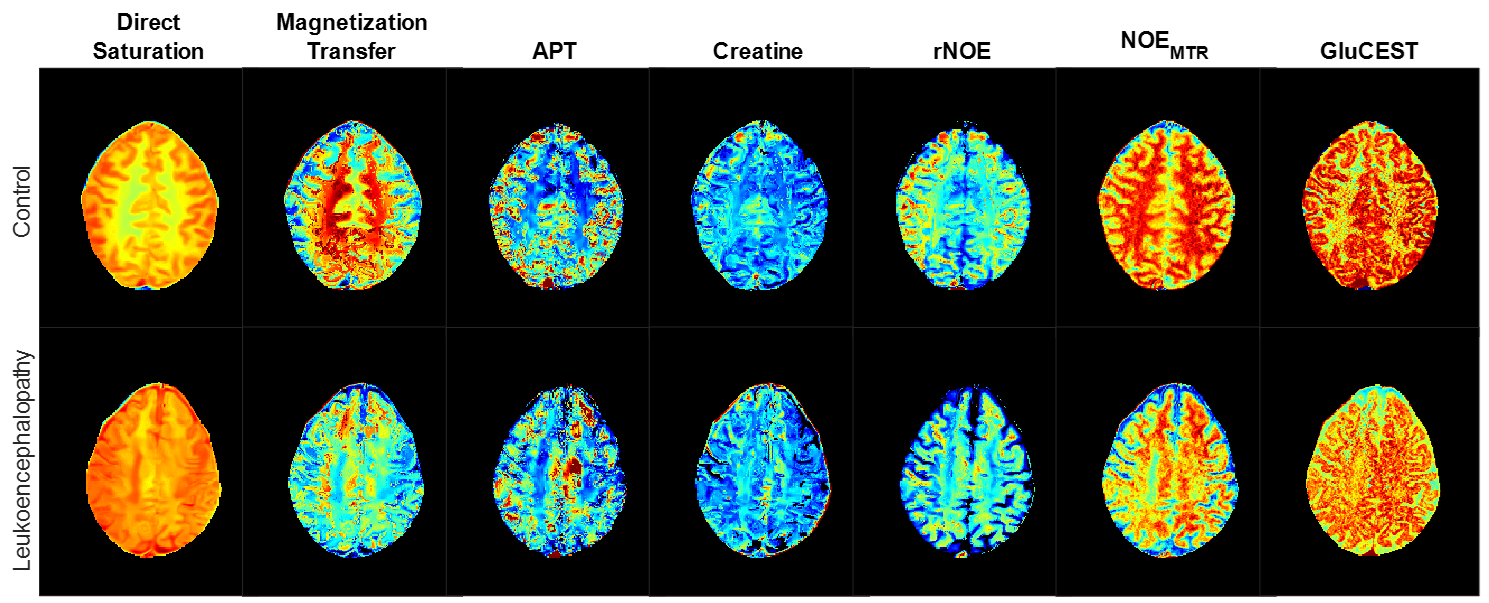
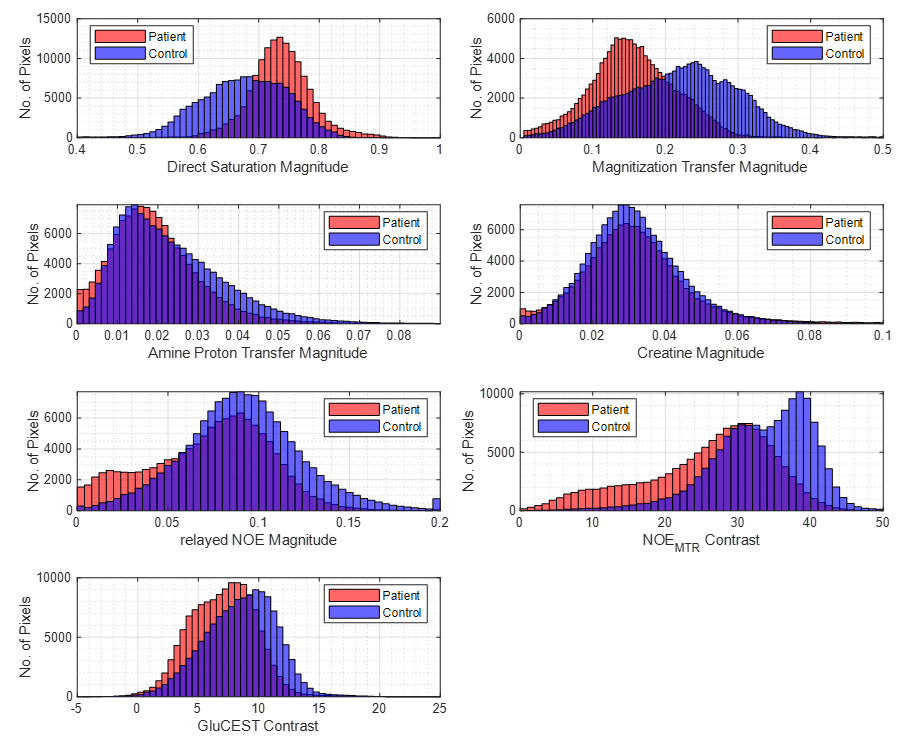
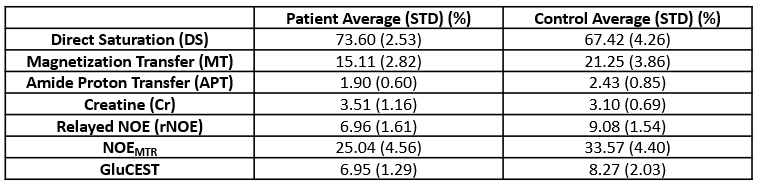
Images from the leukoencephalopathy patient, seen in Figure 1, show a substantial change in contrast in the subcortical and deep white matter regions in comparison to the control images. Primarily, hypointense white matter can be seen in the UNI and INV2 images, while the same regions appear hyperintense in the T1 map, INV2, and FLAIR images. The same contrast trends can be seen in Figure 2, which more clearly shows the most affected regions and corresponds to the 3D NOE and GluCEST acquisition volume. Pool fit data in the leukoencephalopathy subject, seen in Figure 3, shows an overall increase in DS contrast while MT, rNOE, and NOEMTR showed substantial contrast decreases in the affected white matter areas, and interestingly, in regions not seen in the structural images. APT and creatine fits showed negligible differences. GluCEST contrast also showed a decrease, not only in the affected white matter regions, but also in the cortical gray matter. This gray matter change is also reflected in the rNOE pool. Histograms can also be seen in Figure 4, comparing the contrast distributions between the two subjects, and are also quantified in table 1 across the entire imaging slab.Discussion and Conclusion
In this case study of a patient with a leukoencephalopathy there were observable diffuse contrast changes in the affected white matter regions for several of the pool fits, NOEMTR, and GluCEST images. In particular, the rNOE image showed additional white matter regions with lower contrast that were not readily visible in the structural images. Furthermore, the leukoencephalopathy subject also showed a high degree of gray matter atrophy which was reflected in the rNOE and GluCEST images as substantially reduced contrast values in the cortex. Overall, the contrast changes suggest a decrease in myelin associated lipids (MT) (indicating demyelination) and immobile lipids, such as neuronal cell bodies (rNOE) which cannot be seen in the corresponding structural images11. Changes in gray matter GluCEST contrast would also reflect neuronal cell loss in these regions. These images have the potential to provide valuable complementary information to standard structural imaging techniques especially when performed longitudinally over time to track disease progression for this and inflammatory conditions affecting the white matter (e.g. Multiple Sclerosis). Further studies using these techniques are warranted to understand the progression of and how to distinguish acquired and inherited disorders of white matter, including leukodystrophies.Acknowledgements
Research reported in this work was supported by the National Institutes of Health via the National Institute of Biomedical Imaging and Bioengineering under award number P41EB029460 and by the National Institute of Aging under award number R01AG063869.References
1. Stellingwerff MD, Pouwels PJW, Roosendaal SD, Barkhof F, van der Knaap MS. Quantitative MRI in leukodystrophies. Neuroimage Clin. 2023;38:103427. doi:10.1016/j.nicl.2023.103427
2. Wolf NI, Ffrench-Constant C, van der Knaap MS. Hypomyelinating leukodystrophies - unravelling myelin biology. Nat Rev Neurol. Feb 2021;17(2):88-103. doi:10.1038/s41582-020-00432-1
3. Cai K, Haris M, Singh A, et al. Magnetic resonance imaging of glutamate. Nat Med. Jan 22 2012;18(2):302-6. doi:10.1038/nm.2615
4. Jones CK, Huang A, Xu JD, et al. Nuclear Overhauser enhancement (NOE) imaging in the human brain at 7 T. Neuroimage. Aug 15 2013;77:114-124. doi:10.1016/j.neuroimage.2013.03.047
5. Hadar PN, Kini LG, Nanga RPR, et al. Volumetric glutamate imaging (GluCEST) using 7T MRI can lateralize nonlesional temporal lobe epilepsy: A preliminary study. Brain Behav. Aug 2021;11(8):e02134. doi:10.1002/brb3.2134
6. Benyard B, Nanga RPR, Wilson NE, et al. In vivo reproducibility of 3D relayed NOE in the healthy human brain at 7 T. Magn Reson Med. Jun 2023;89(6):2295-2304. doi:10.1002/mrm.29600
7. Windschuh J, Zaiss M, Meissner JE, et al. Correction of B1-inhomogeneities for relaxation-compensated CEST imaging at 7T. Nmr in Biomedicine. May 2015;28(5):529-537. doi:10.1002/nbm.3283
8. Kim M, Gillen J, Landman BA, Zhou J, van Zijl PC. Water saturation shift referencing (WASSR) for chemical exchange saturation transfer (CEST) experiments. Magn Reson Med. Jun 2009;61(6):1441-50. doi:10.1002/mrm.21873
9. Volz S, Noth U, Rotarska-Jagiela A, Deichmann R. A fast B1-mapping method for the correction and normalization of magnetization transfer ratio maps at 3 T. Neuroimage. Feb 15 2010;49(4):3015-26. doi:10.1016/j.neuroimage.2009.11.054
10. Maggioni M, Katkovnik V, Egiazarian K, Foi A. Nonlocal transform-domain filter for volumetric data denoising and reconstruction. IEEE Trans Image Process. Jan 2013;22(1):119-33. doi:10.1109/TIP.2012.2210725
11. Zu Z, Lin EC, Louie EA, et al. Relayed nuclear Overhauser enhancement sensitivity to membrane Cho phospholipids. Magn Reson Med. Oct 2020;84(4):1961-1976. doi:10.1002/mrm.28258
Figures