2023
Arterial deceleration time (ADT) mapping using velocity-selective arterial spin labeling1Bioengineering, University of California Riverside, Riverside, CA, United States
Synopsis
Keywords: Arterial Spin Labelling, Arterial spin labelling
Motivation: It is challenging to evaluate the health of vasculature at the arteriole/capillary level.
Goal(s): To develop an approach to measuring a physiological parameter, arterial deceleration time (ADT), which may provide useful information at the arteriole/capillary level.
Approach: Two sets of arterial transit time (ATT) measurement using VSASL with different Vcut in labeling but the same Vcut in imaging were carried out in one subject to measure ATT and ADT.
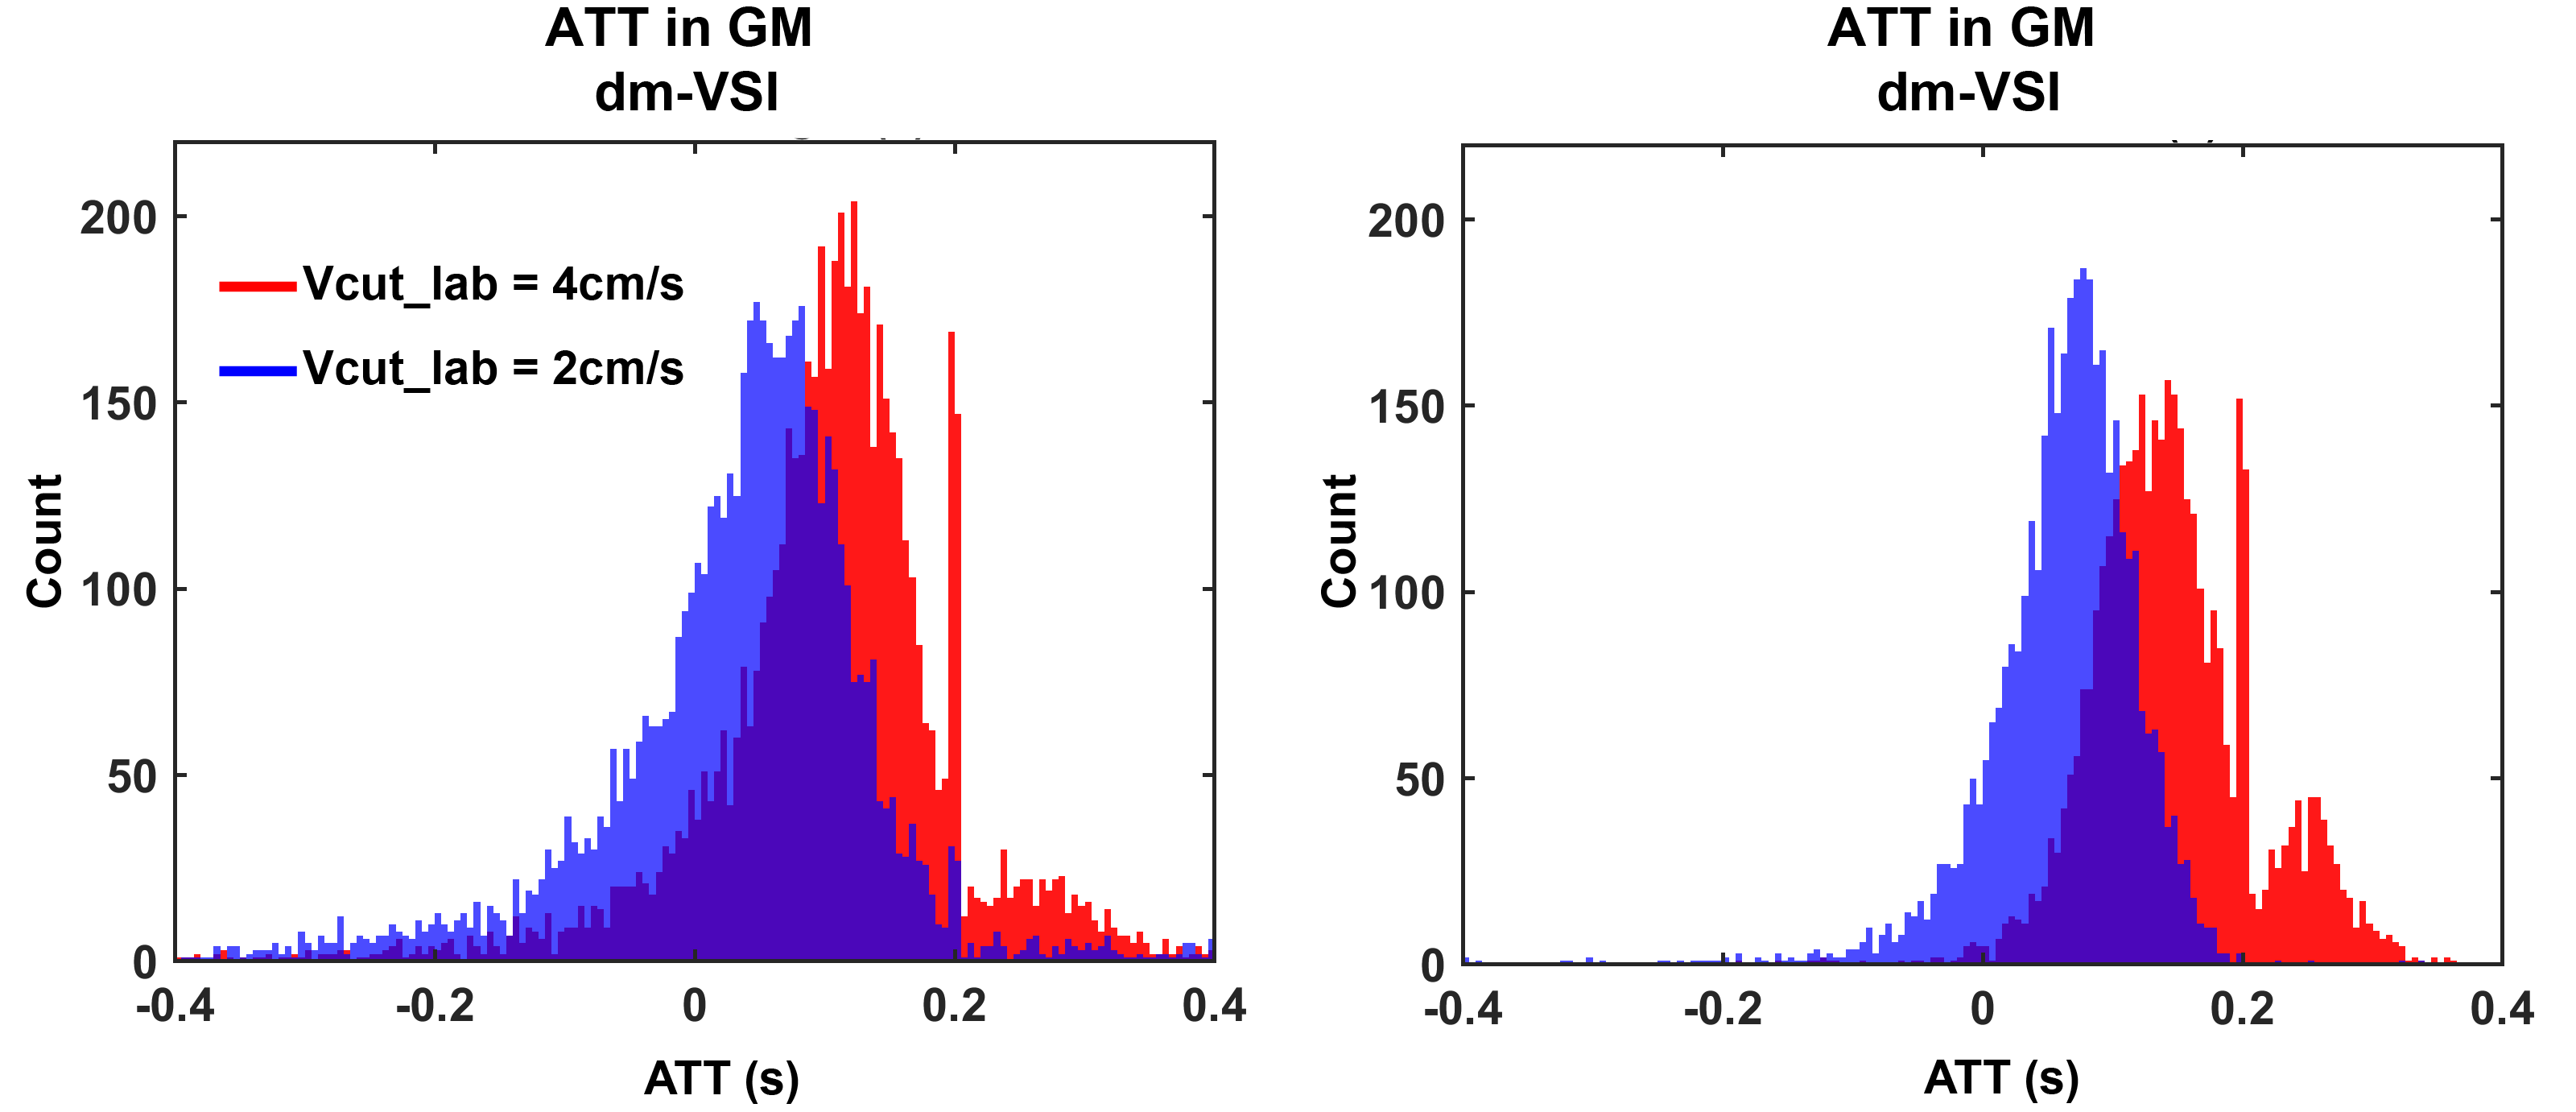
Results: The preliminary data confirmed the ATT-insensitivity of VSASL and measured an ADT from 4cm/s to 2cm/s of less than 100 ms.
Impact: This feasibility study measured a new physiological parameter: arterial deceleration time – the time for the arterial blood to decelerate from V1 to V2 (V1>V2), which may have potential value in evaluating microvascular health and clinical applications.
Introduction
Being able to evaluate vascular health at the arteriole/capillary level is very challenging, and may potentially provide valuable clinical information. In arterial spin labeling (ASL) 1, arterial transit time (ATT) is the time needed for the labeled blood to travel from the labeled site to the destination tissue. In spatially selective methods, ATT is mostly weighted by the portion the arterial blood travels in vessels in relatively large sizes.Arterial blood decelerates as it enters smaller vessels, especially capillaries, but how fast it decelerates in this process, is largely unknown, and it is very challenging to measure using MRI due to the small size. This feasibility study aims to develop a novel imaging method to directly measure such arterial deceleration time (ADT), analogous to ATT.
Methods
Velocity-selective arterial spin labeling (VSASL) 2, 3 label arterial blood as it enters arterioles and capillaries when a small cutoff velocity (Vcut,lab), such as 2cm/s, is used in the labeling process. A matched Vcut in image acquisition (Vcut,im) is required to quantify blood flow 2, 3. When Vcut,im and Vcut,lab are matched, the sensitivity to ATT artefacts can be greatly reduced 2, 4-7. However, if Vcut,lab is higher than Vcut,im, a delay, i.e. the ADT, is created as the labeled blood has to decelerate to Vcut,im to be imaged. Since this occurs in close proximity to the capillary bed, this parameter may carry useful information about the vessels of such fine sizes.In principle, ADT can be directly measured using a multi-delay strategy with different Vcut,lab and Vcut,im. However, direct measurement of ATT in VSASL itself is very challenging, due to artefacts occurring at early delays, and has only been reported in a few studies 4, 7, let alone the measurement of ADT this way. Instead, two VSASL ATT experiments can be performed: ATT1 with Vcut,lab,1 > Vcut,im and 2) ATT2 with Vcut,lab,2 = Vcut,im, and then ADT can be calculated as ADT = ATT1 - ATT2, with potentially reduced bias.
A healthy subject was studied on a 3T scanner (Siemens Prisma, Erlangen, Germany) with Vcut,lab,1=4cm/s and Vcut,lab,2=2cm/s, and Vcut,im=2cm/s in both. First, single-module velocity-selective inversion (VSI) 8 with sinc modulation 9 was used with TI=0.5, 1.0, 1.6 and 2.2s, and a post-labeling delay of 25ms. TR varied with a fixed delay of 2s before the VSASL pulse. A second session was performed using dual-module VSI 5 with similar setting, and TI1=0.2, 0.4, 0.8 and 1.4s, and TI2=50ms. 16 pairs of label/control were acquired at each delay using 3D GRASE EPI with FOV=220x220mm (64x64), 24 slices and 4mm thickness. The ASL data were extracted with pair-wise subtraction and averaged, and then fitted to the kinetic PASL signal model 10 with the ATT allowing to be negative 4. The fitting was performed per voxel and in gray (GM) and white matter (WM) ROI.
Results
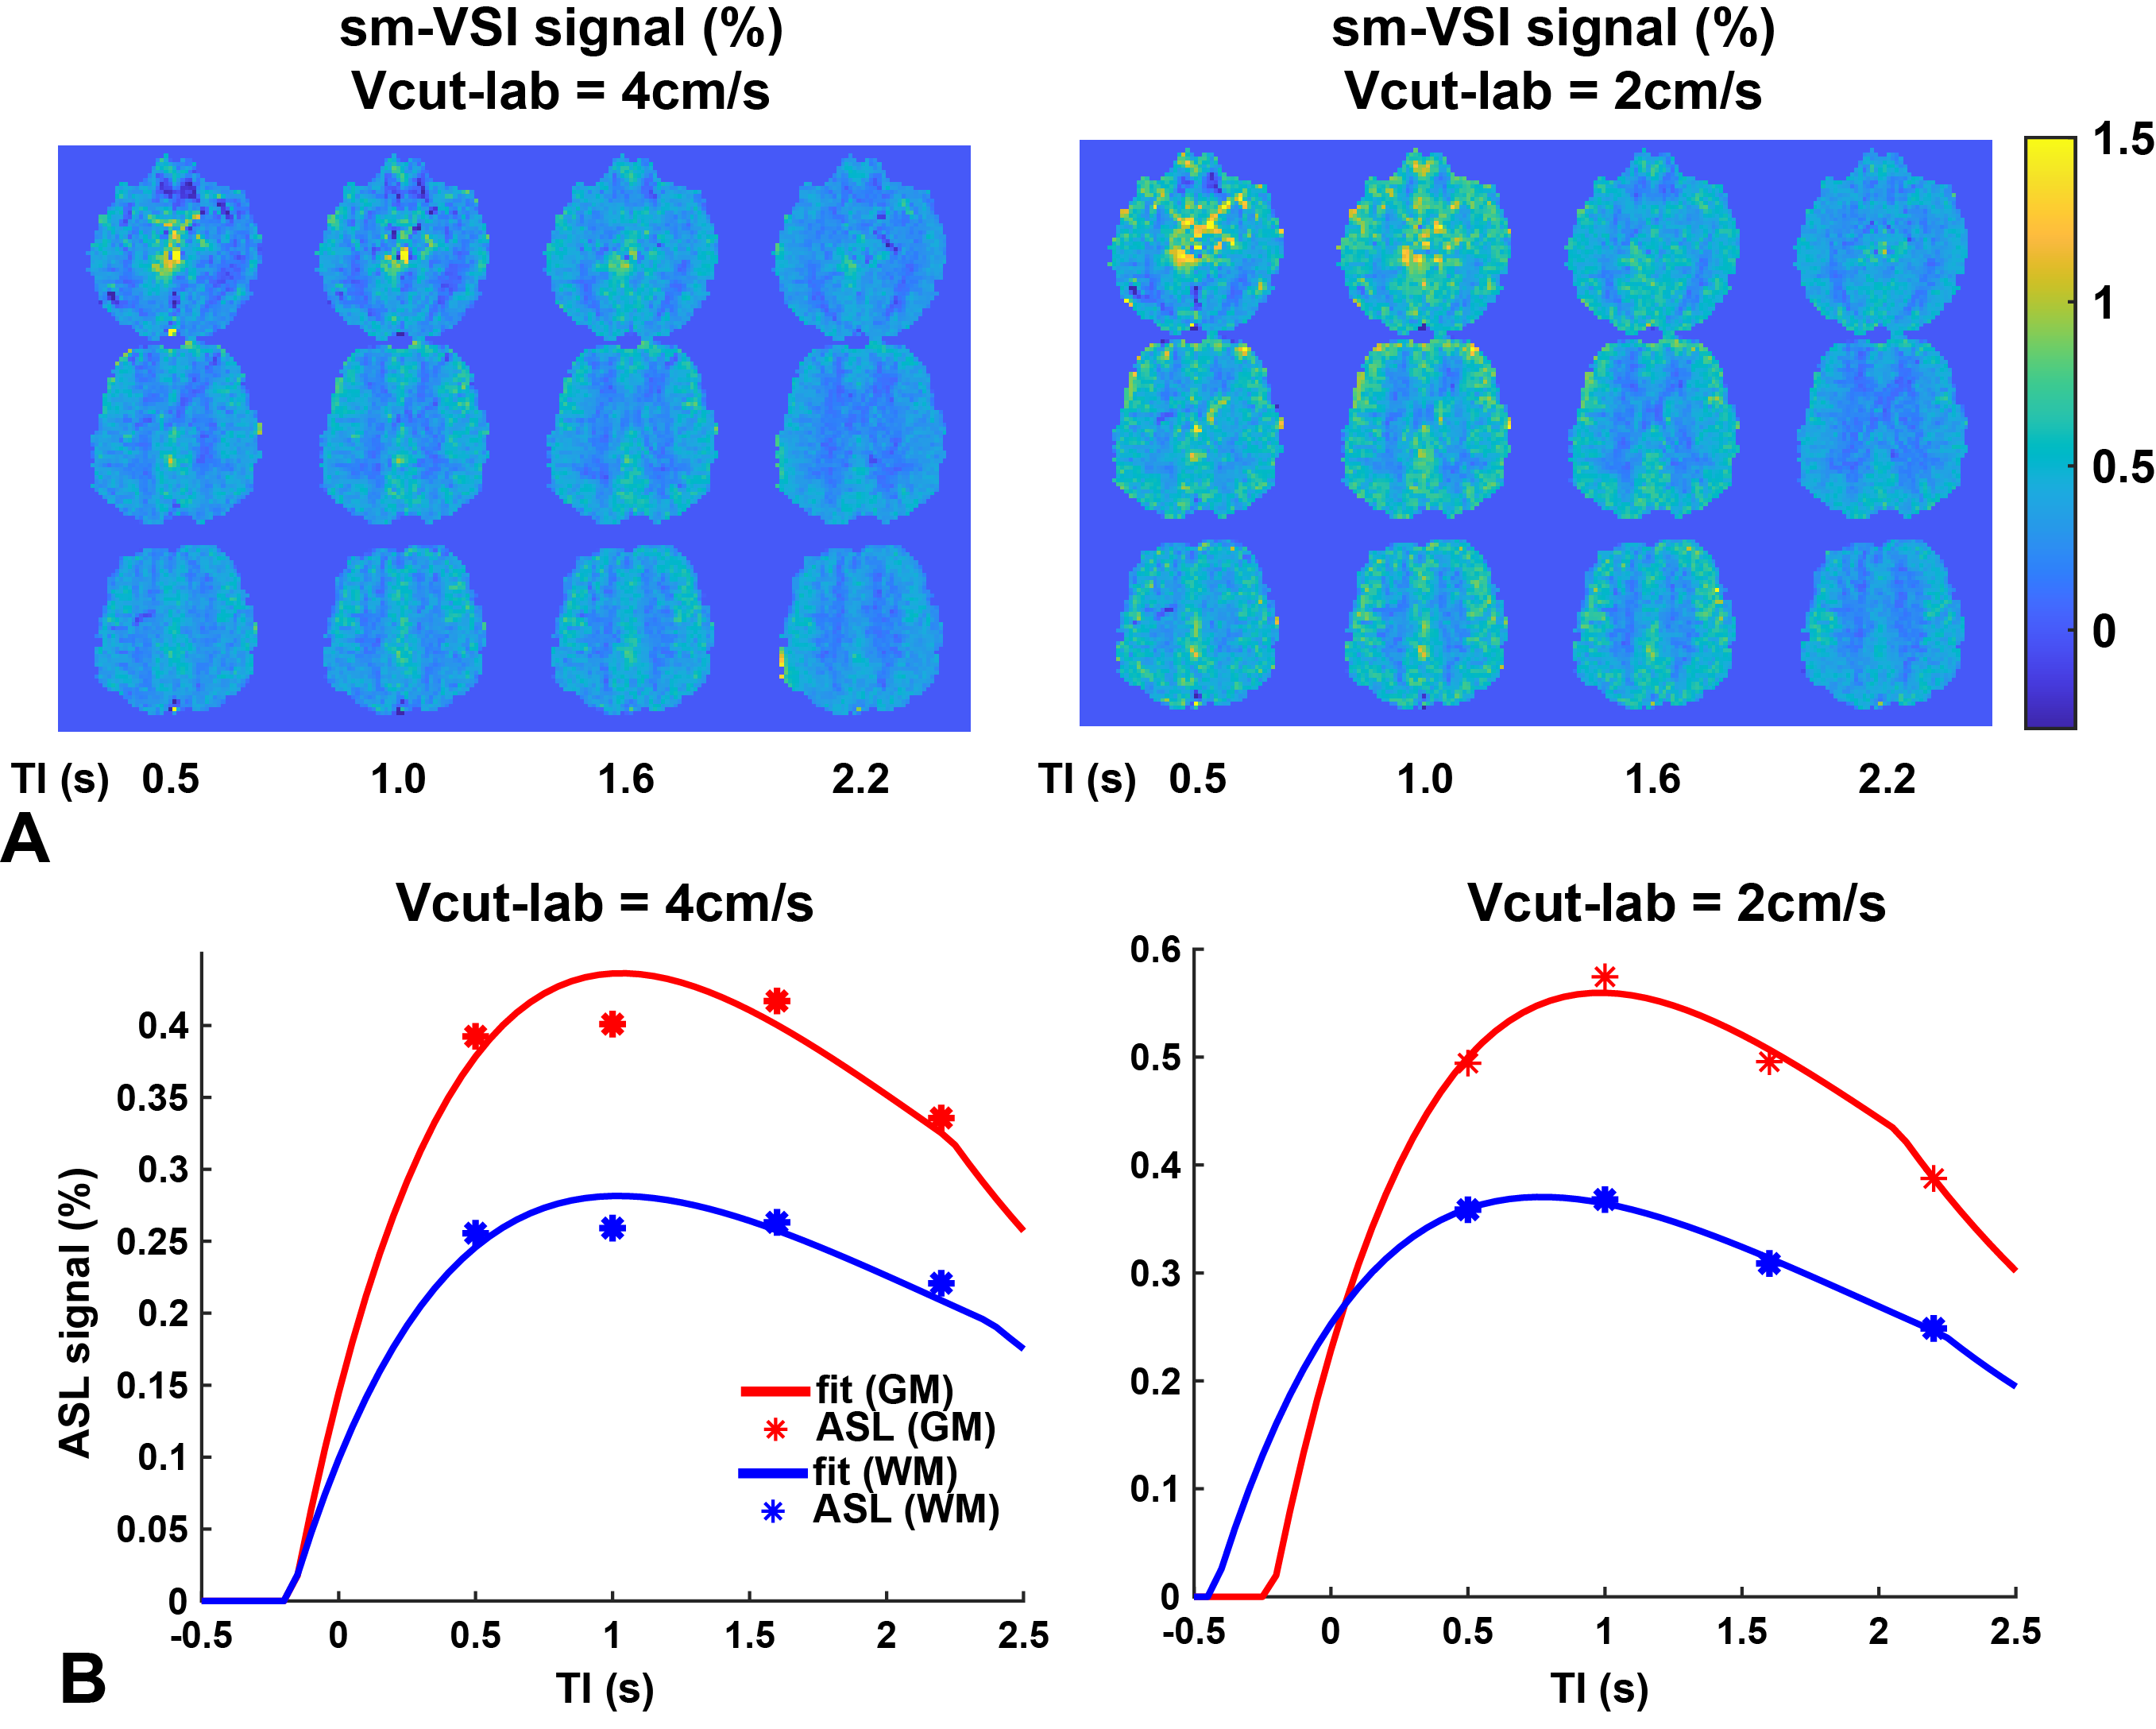
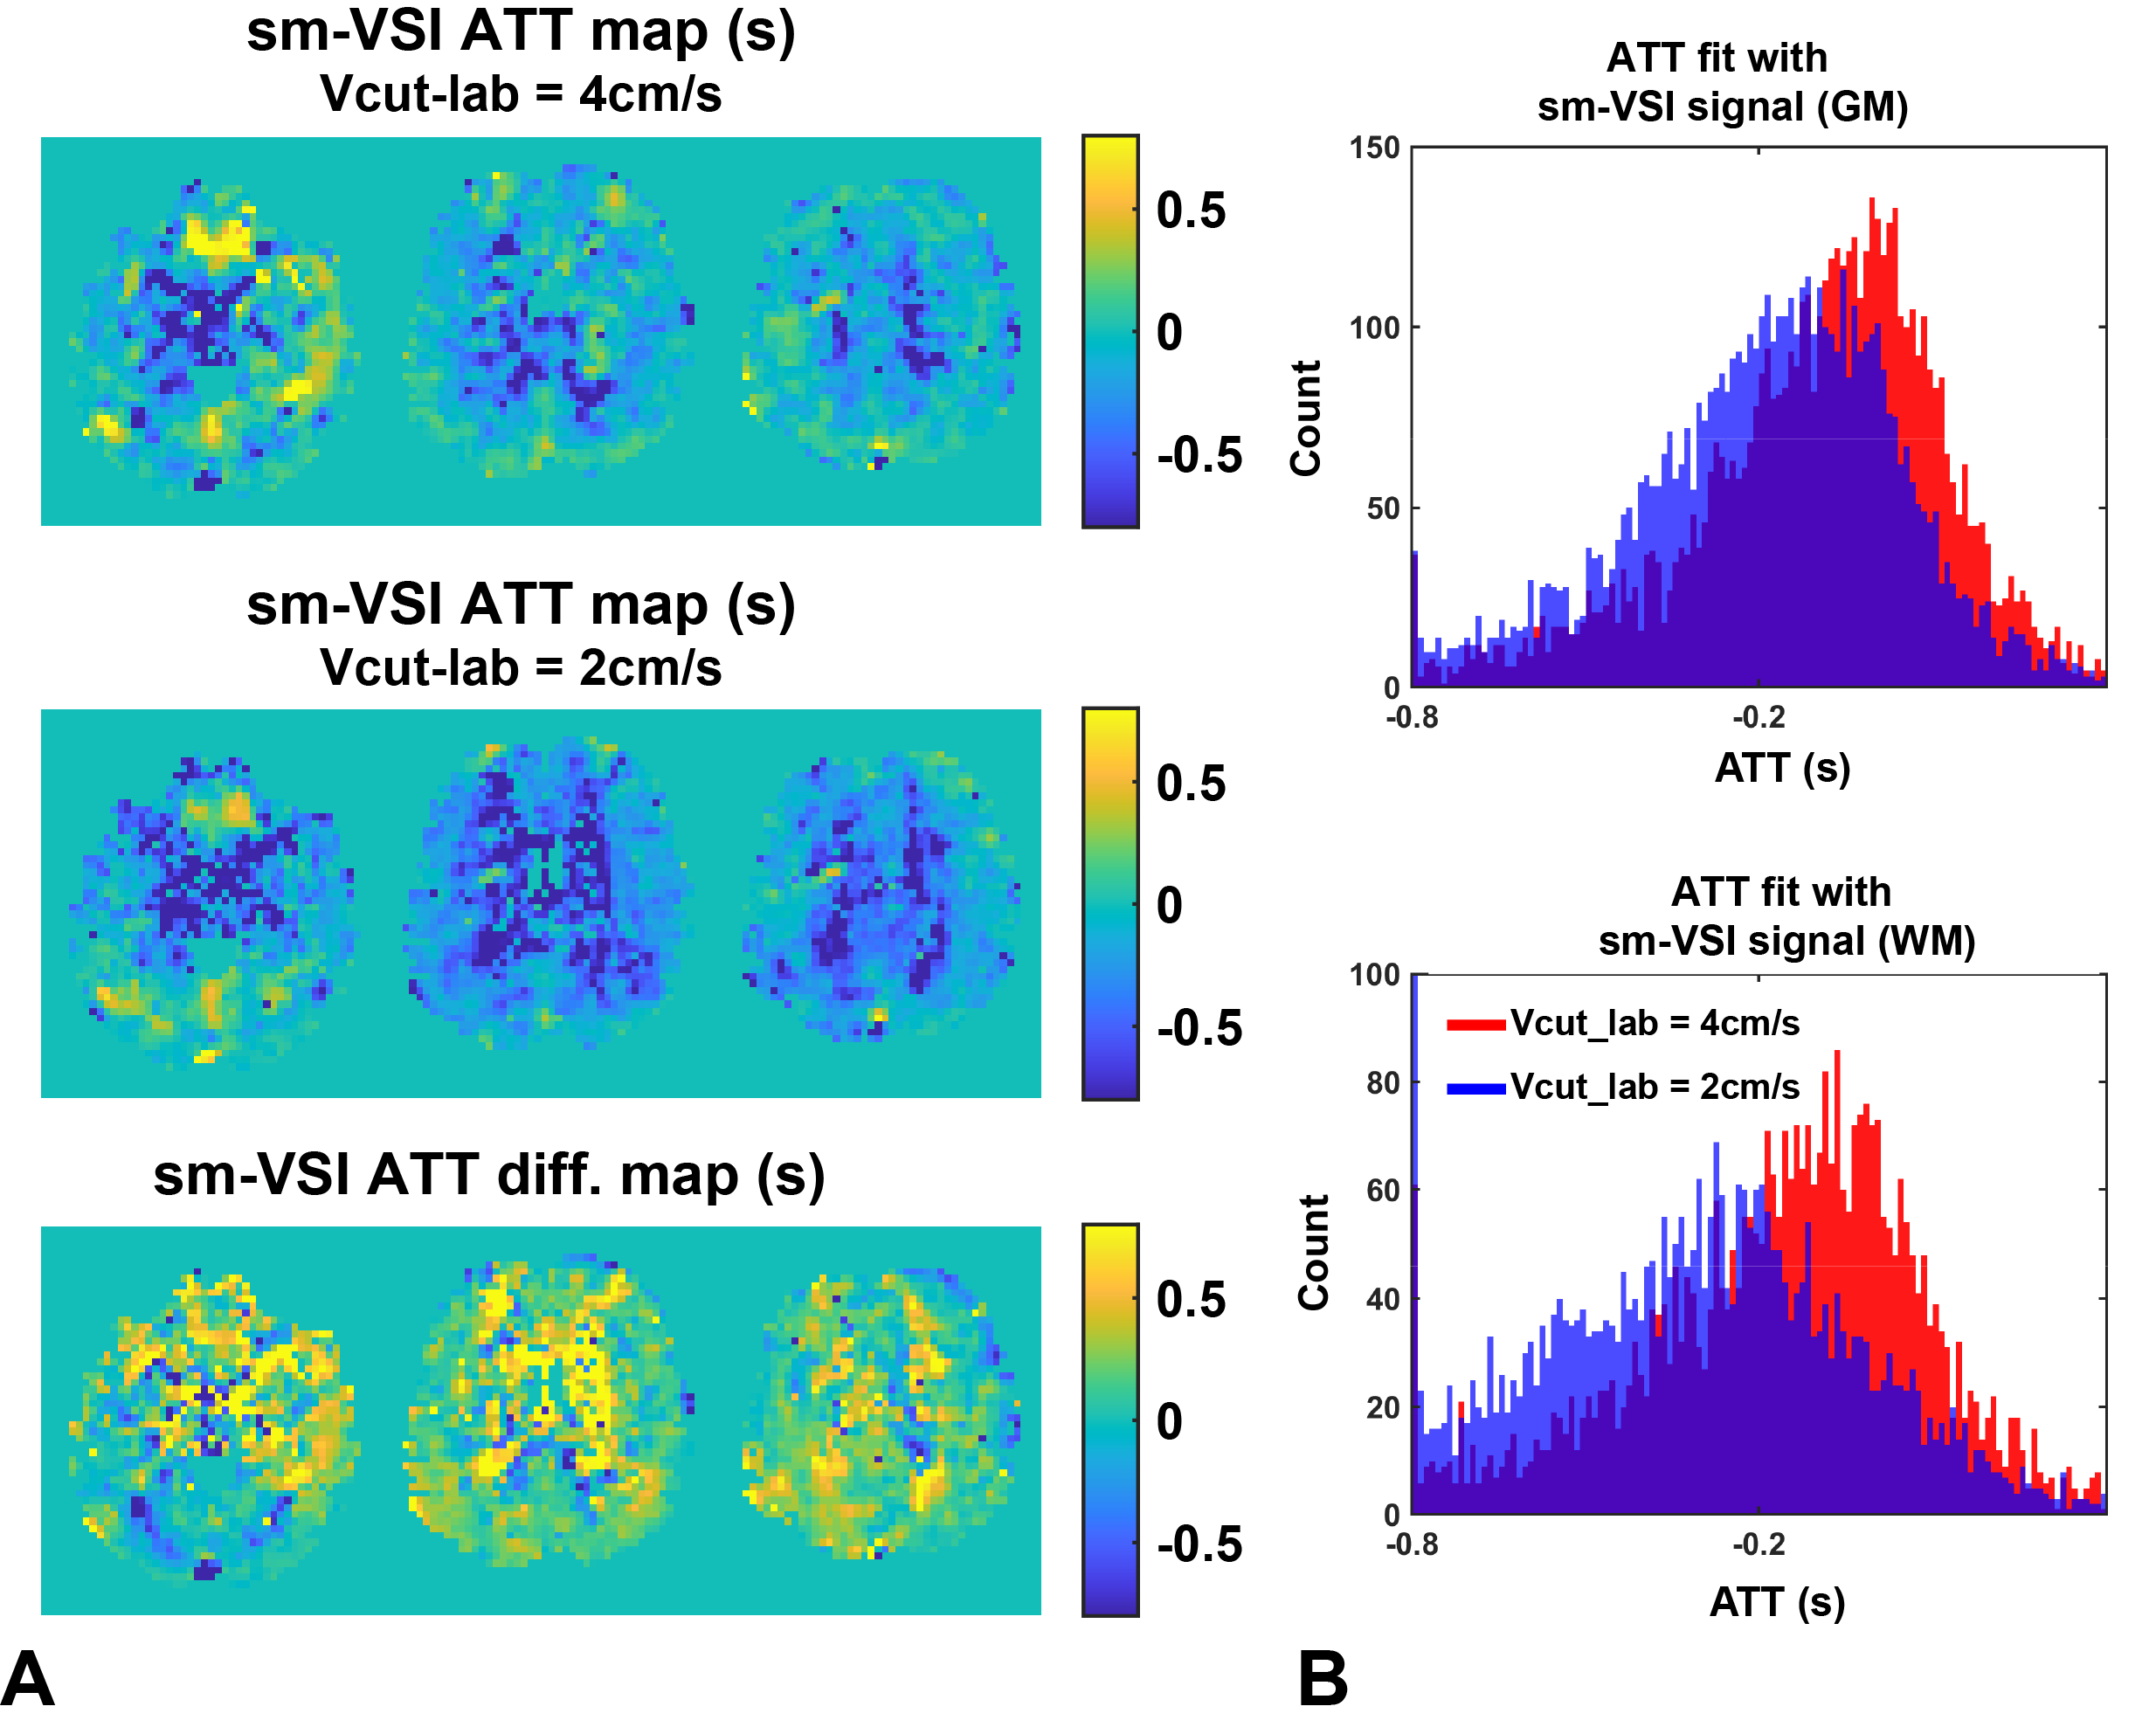
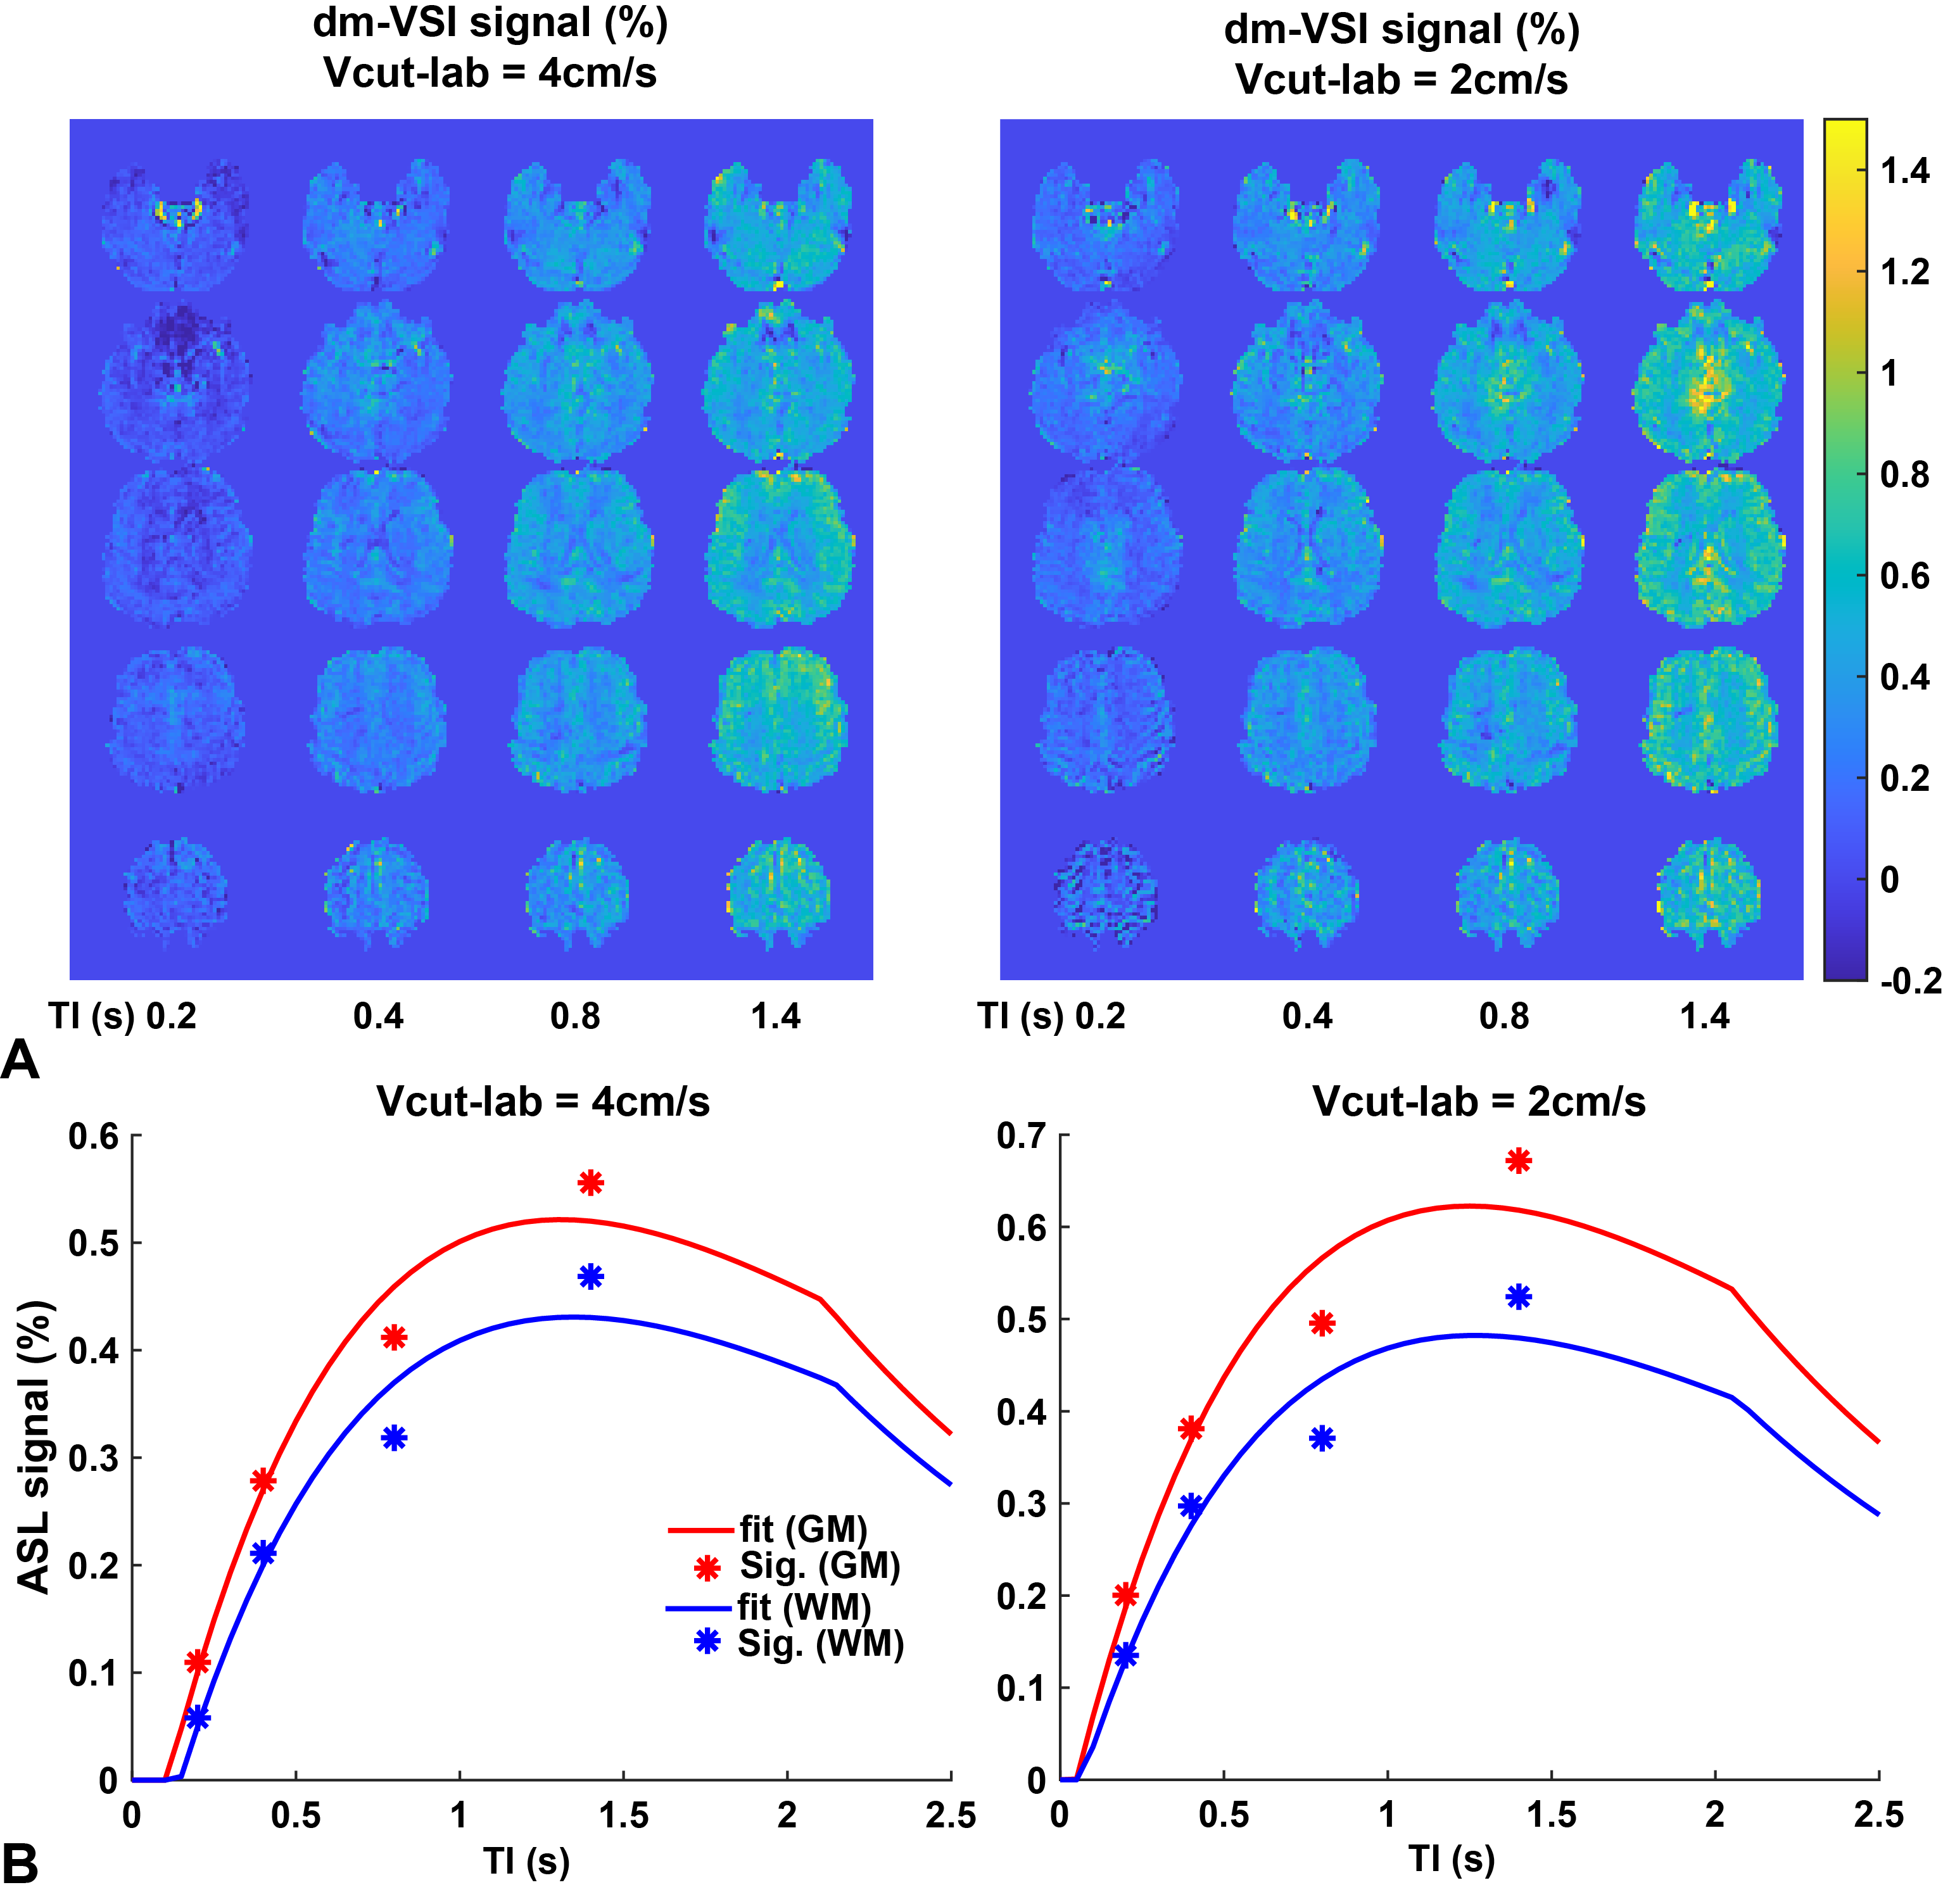
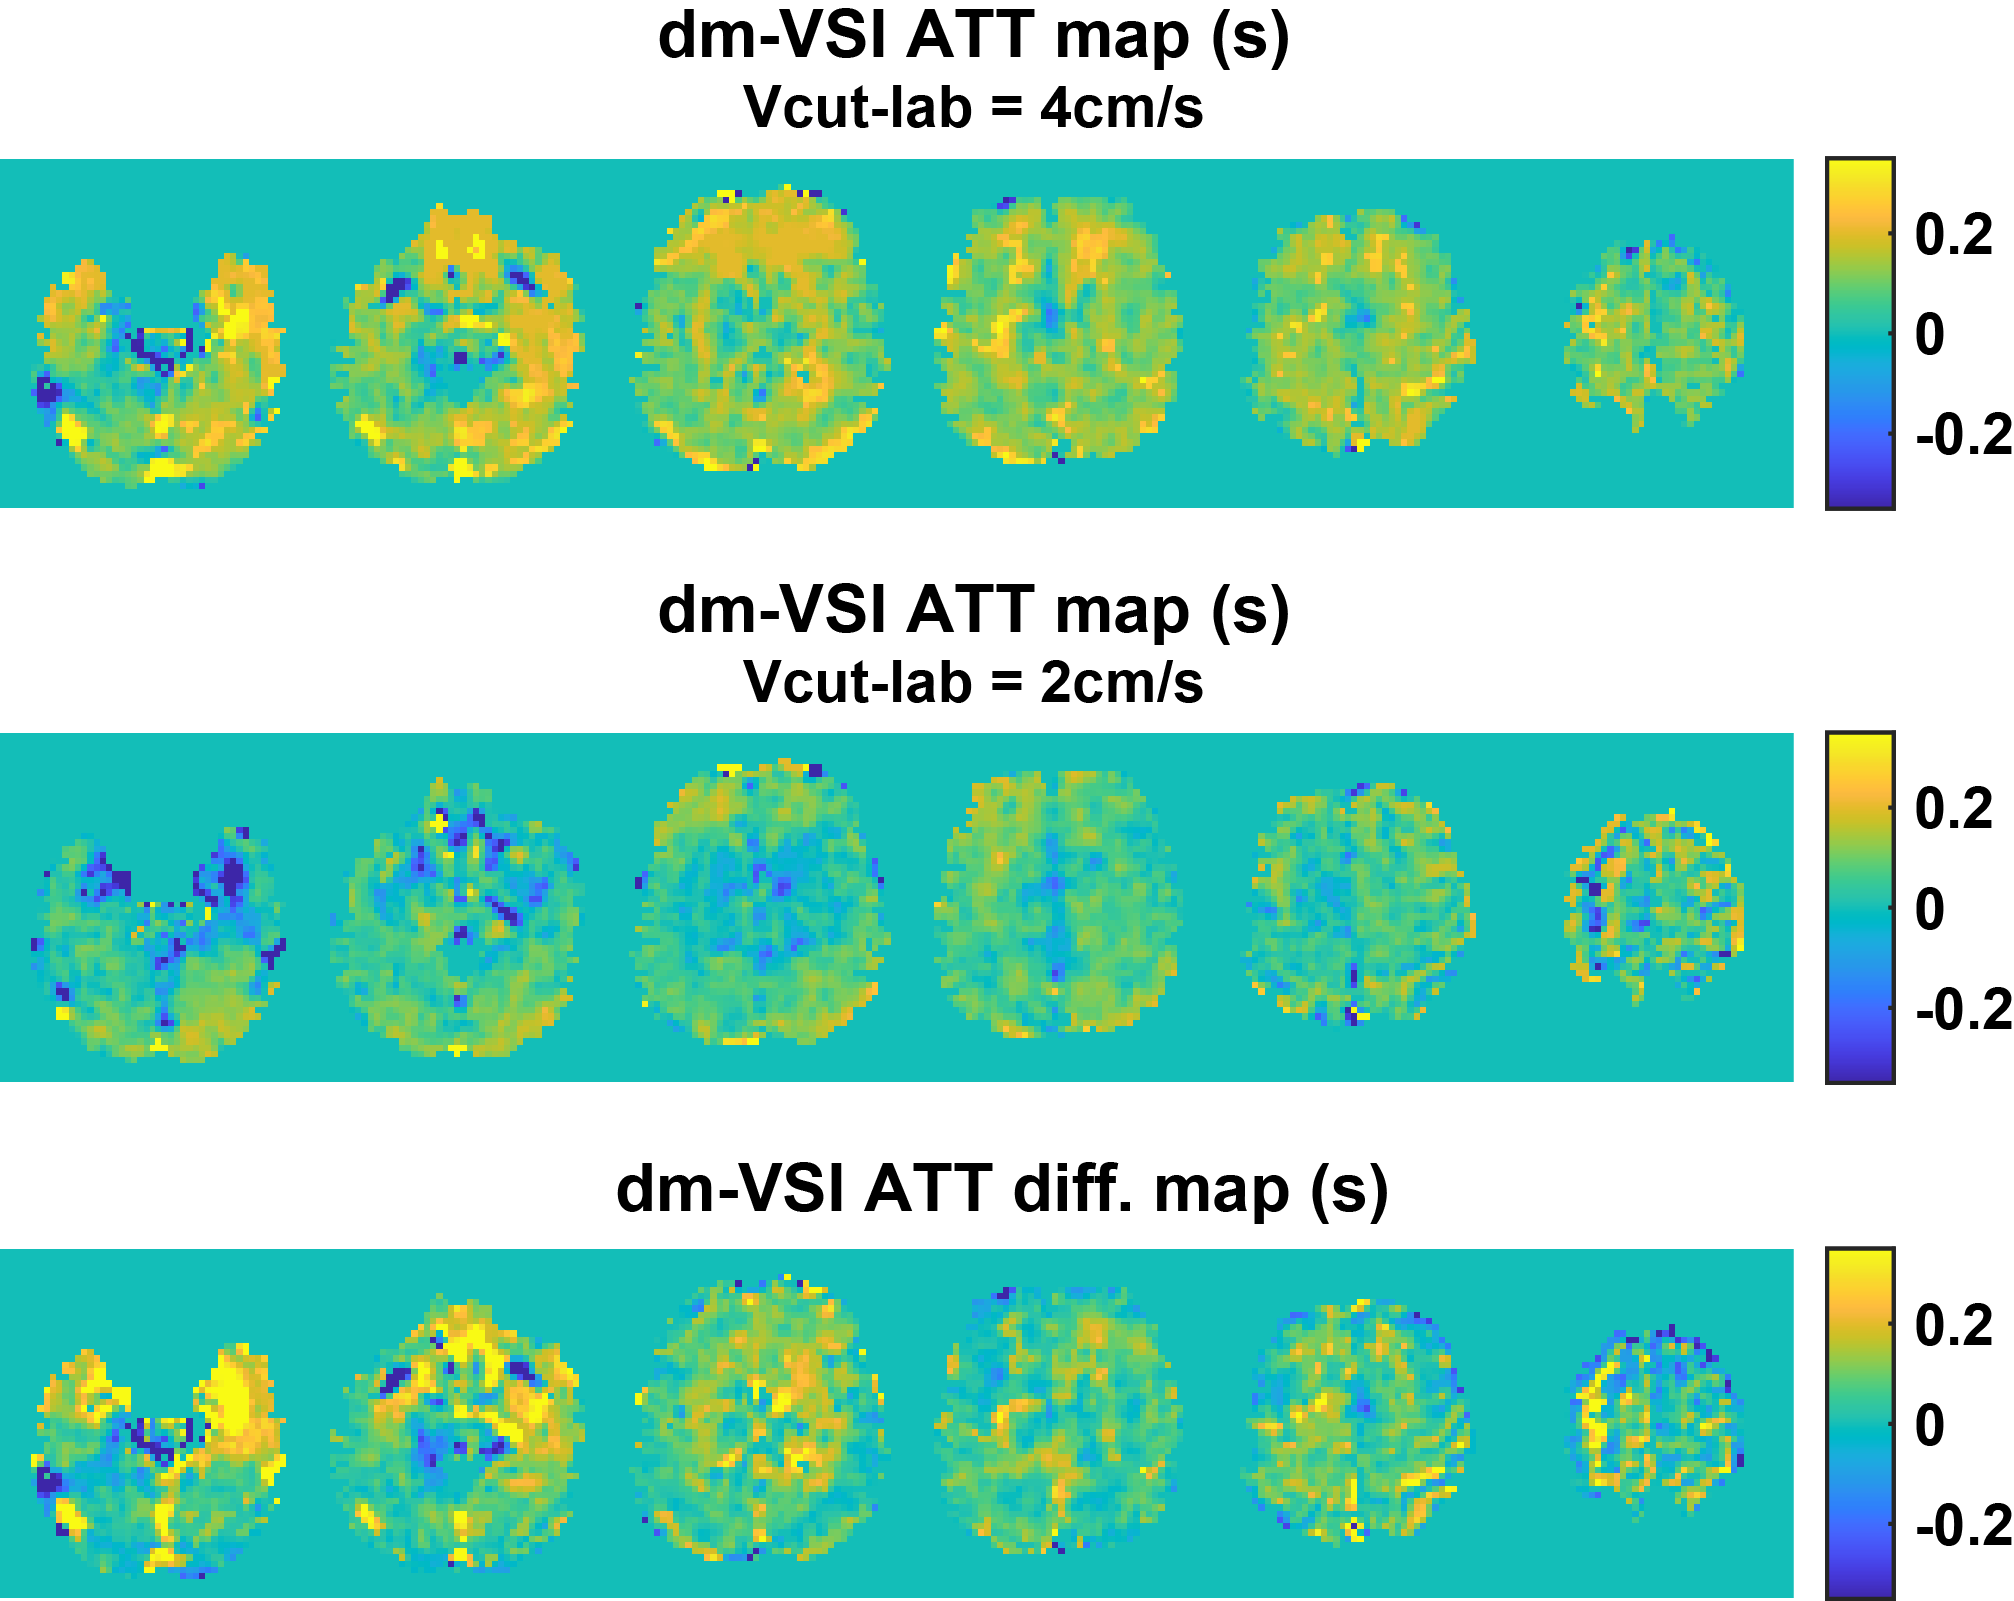
The results using sm-VSI are shown in Figures 1&2. The ASL signals with sm-VSI labeling were contaminated by artefacts at short delays, resulting in negative and less reliable ATT at both Vcut,lab. The median per-voxel ATT in GM and WM with sm-VSI was -0.18s and -0.14s at Vcut,lab,1=4cm/s, and -0.07s and -0.33s at Vcut,lab,1=2cm/s, corresponding to ADT of 0.11s and 0.19s in GM and WM, respectively.In contrast, much cleaner VSASL signals were observed at shorter delays with dm-VSI, indicating reduced artefacts and potentially more accurate ATT, as shown in Figures 3-5. The median ATT in GM and WM with dm-VSI was 0.11s and 0.14s at Vcut,lab,1=4cm/s, and 0.05s and 0.07s at Vcut,lab,2=2cm/s, corresponding to similar ADT of 0.06s and 0.07s in GM and WM, respectively.
Discussion
This is the first measurement of ADT using MRI. The plausible preliminary results, especially that using dm-VSI, showing similar ADT in GM and WM as expected. The ATT measured with matched Vcut,lab and Vcut,im also confirmed the ATT-insensitivity of VSASL.Correction for diffusion attenuation effects 4 can be used to reduce the artefactual signals at short delays, which was not applied here. The dm-VSASL approach 5 helped reduce artefacts without such correction, which is advantageous in mapping ATT and ADT in VSASL. However, there were artefacts at longer delays, which requires further investigation.
Similar experiment can be designed to measure the acceleration times on the venous side, i.e. venous acceleration time, using the principle of velocity-selective excitation 11 to isolate the venous signals.
Conclusion
ADT may have values in evaluating microvascular health as a potential biomarker.Acknowledgements
None.References
1. Detre JA, Leigh JS, Williams DS, Koretsky AP. Perfusion imaging. Magn Reson Med. 1992;23(1):37-45.
2. Wong EC, Cronin M, Wu W-C, Inglis B, Frank LR, Liu TT. Velocity-selective arterial spin labeling. Magn Reson Med. 2006;55(6):1334-41.
3. Qin Q, Alsop DC, Bolar DS, Hernandez-Garcia L, Meakin J, Liu D, et al. Velocity-selective arterial spin labeling perfusion MRI: A review of the state of the art and recommendations for clinical implementation. Magn Reson Med. 2022;88(4):1528-47.
4. Guo J, Wong EC. Increased SNR efficiency in velocity selective arterial spin labeling using multiple velocity selective saturation modules (mm-VSASL). Magn Reson Med. 2015;74(3):694-705.
5. Guo J. Robust dual-module velocity-selective arterial spin labeling (dm-VSASL) with velocity-selective saturation and inversion. Magn Reson Med. 2023;89(3):1026-40.
6. Bolar DS, Gagoski B, Orbach DB, Smith E, Adalsteinsson E, Rosen BR, et al. Comparison of CBF Measured with Combined Velocity-Selective Arterial Spin-Labeling and Pulsed Arterial Spin-Labeling to Blood Flow Patterns Assessed by Conventional Angiography in Pediatric Moyamoya. AJNR Am J Neuroradiol. 2019;40(11):1842-9.
7. Hernandez-Garcia L, Nielsen JF, Noll DC. Improved sensitivity and temporal resolution in perfusion FMRI using velocity selective inversion ASL. Magn Reson Med. 2019;81(2):1004-15.
8. Qin Q, van Zijl PC. Velocity-selective-inversion prepared arterial spin labeling. Magn Reson Med. 2016;76(4):1136-48.
9. Guo J, Das S, Hernandez-Garcia L. Comparison of velocity-selective arterial spin labeling schemes. Magn Reson Med. 2021;85(4):2027-39.
10. Buxton RB, Frank LR, Wong EC, Siewert B, Warach S, Edelman RR. A general kinetic model for quantitative perfusion imaging with arterial spin labeling. Magn Reson Med. 1998;40:383-96.
11. Guo J, Wong EC. Venous oxygenation mapping using velocity-selective excitation and arterial nulling. Magn Reson Med. 2012;68(5):1458-71.
Figures