2022
Reproducibility and sensitivity of BOLD-DSC Perfusion MRI within a single session and across multiple imaging sessions1Center for Neuroscience Imaging Research (CNIR), Institute for Basic Science (IBS), Suwon, 16419, Republic of Korea, Suwon, Korea, Republic of
Synopsis
Keywords: Perfusion, Perfusion, DSC
Motivation: Transient hypoxia-induced BOLD-DSC perfusion imaging approach can noninvasively map cerebral blood flow (CBF) and cerebral blood volume (CBV). However, the reproducibility of this technique has not been previously assessed.
Goal(s): We aimed to determine the reproducibility of BOLD-DSC measurements within a single session and across multiple sessions.
Approach: The reproducibility of trial-wise BOLD-DSC measurements within each session was assessed for each animal during week 1, while the reproducibility of weekly BOLD-DSC measurements was evaluated across all animals from week 1 to week 4.
Results: We found that reproducibility and sensitivity of hypoxia-induced BOLD changes were consistently high in both single and multiple sessions.
Impact: The hypoxic challenge induces highly sensitive and reproducible BOLD responses across trials within a single session and consistently across multiple sessions, enabling the longitudinal and repetitive mapping of cerebral perfusion with easily implementable whole-brain BOLD-DSC MRI in mice.
Introduction
Cerebral perfusion is critical for early detection of neurological diseases and for effectively monitoring disease progression and treatment responses. A BOLD dynamic susceptibility contrast (DSC) MRI with transient hypoxia was successfully adopted to noninvasively measure cerebral perfusion in mouse with high spatiotemporal resolution1. Given the importance of reliability and sensitivity in routine perfusion studies, particularly considering the challenges faced by other perfusion techniques like DSC with Gadolinium injection or ASL2,3, this study aims to assess these aspects of BOLD-DSC measurements within a single session and across multiple sessions.Methods
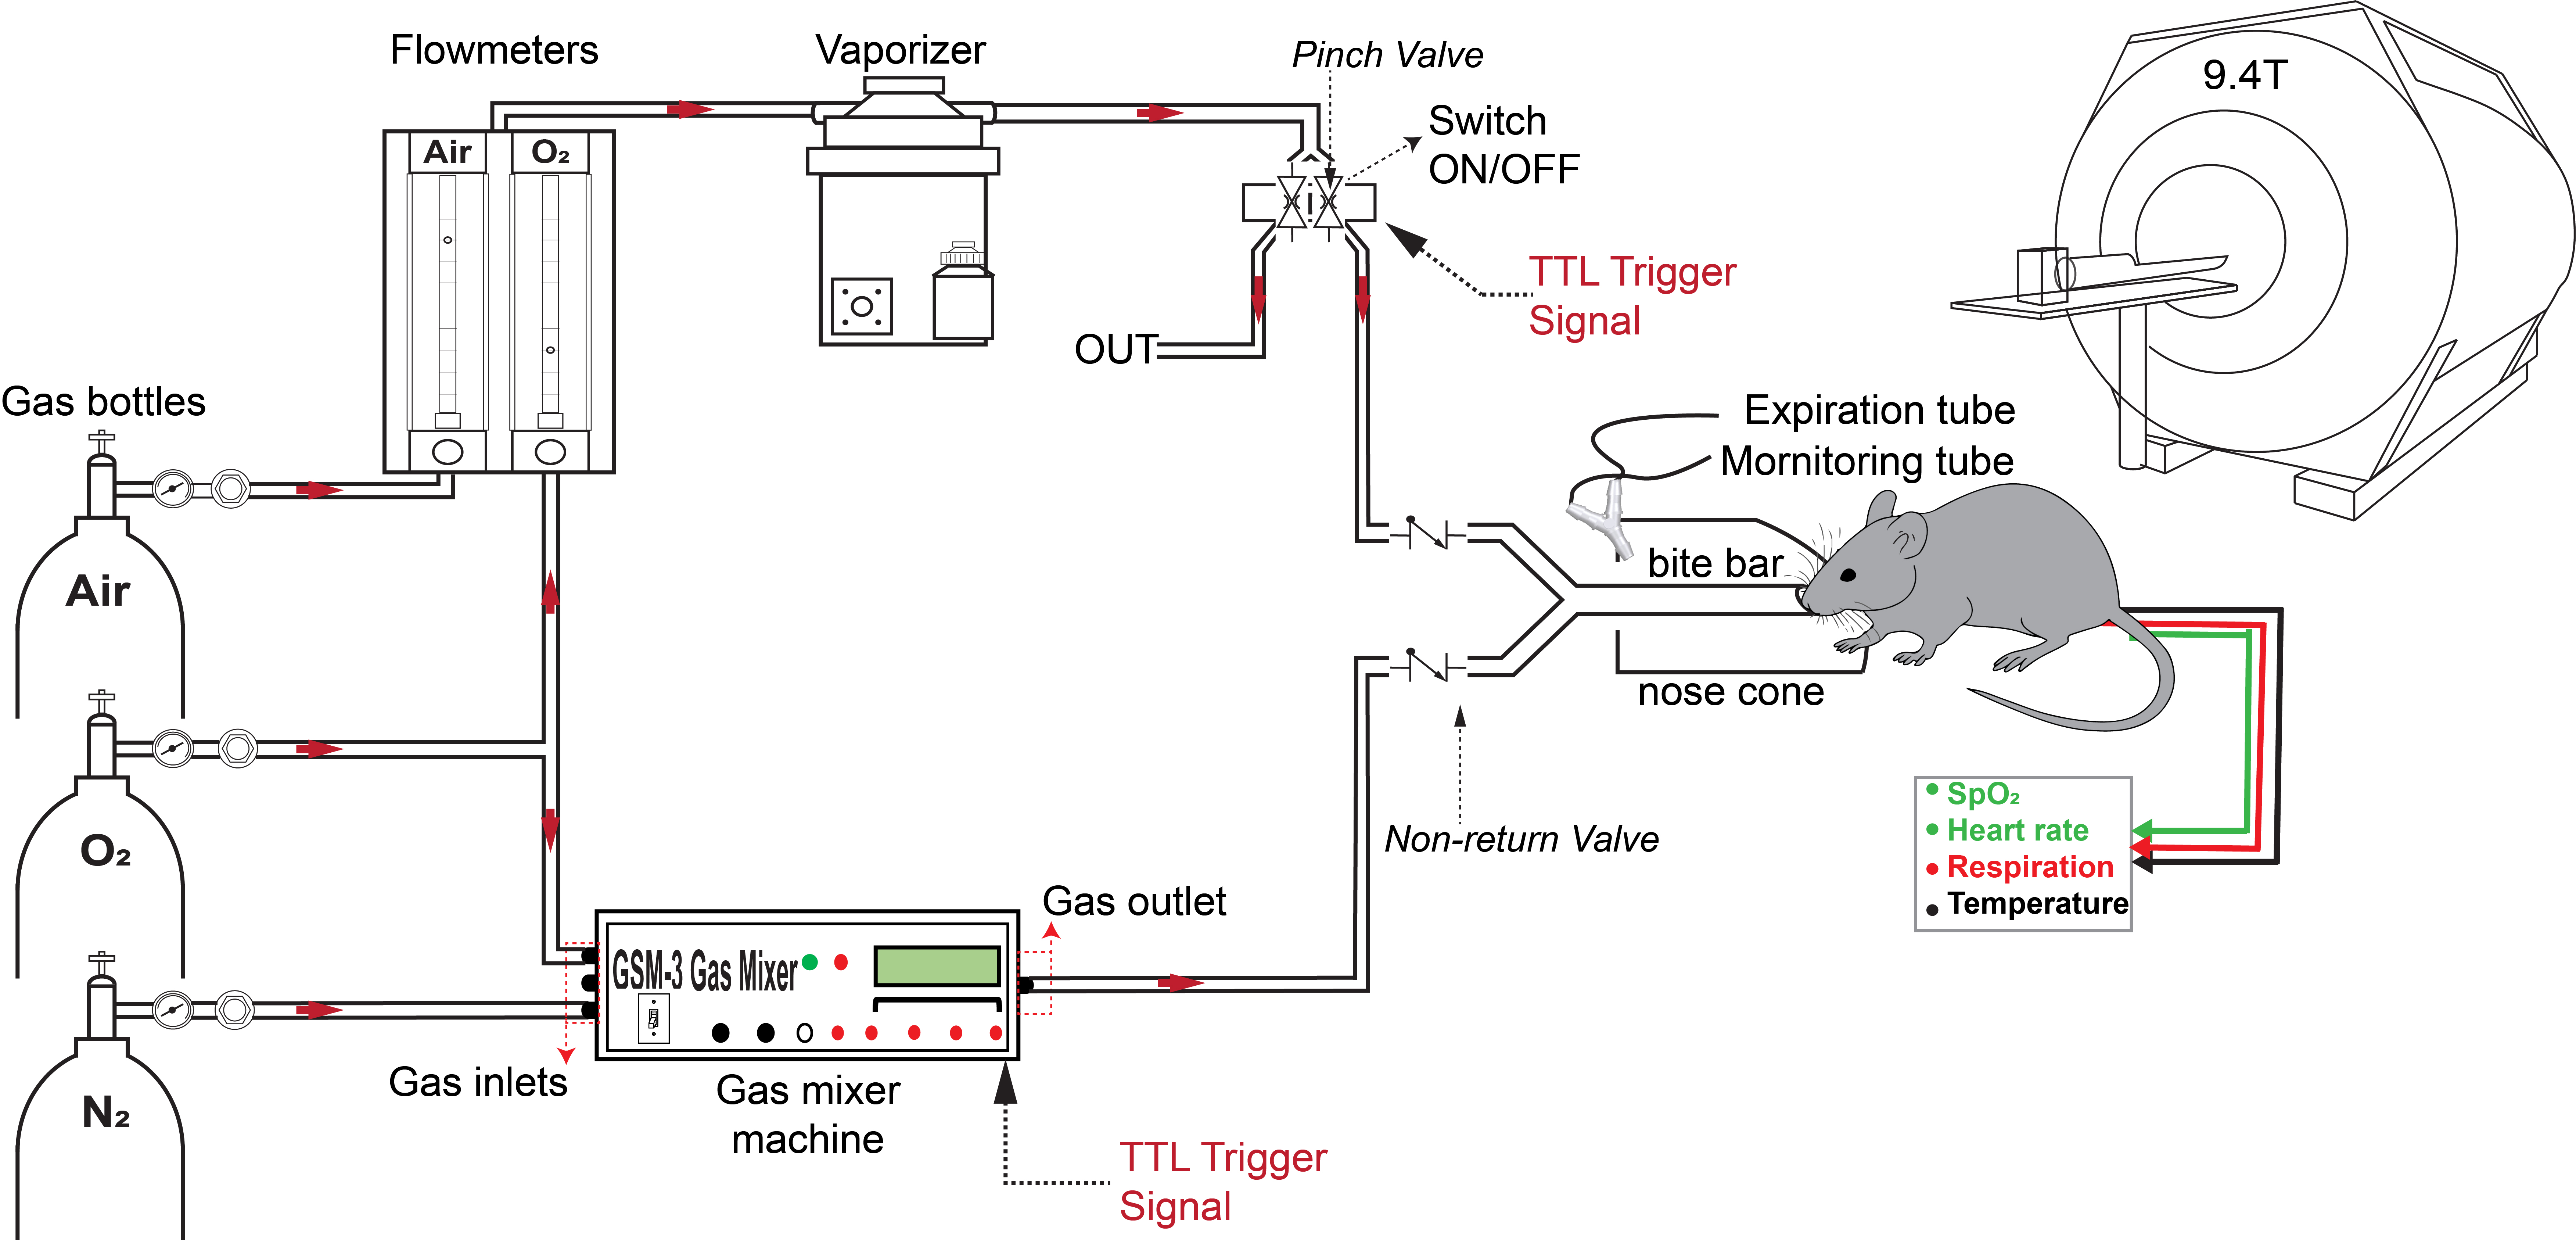
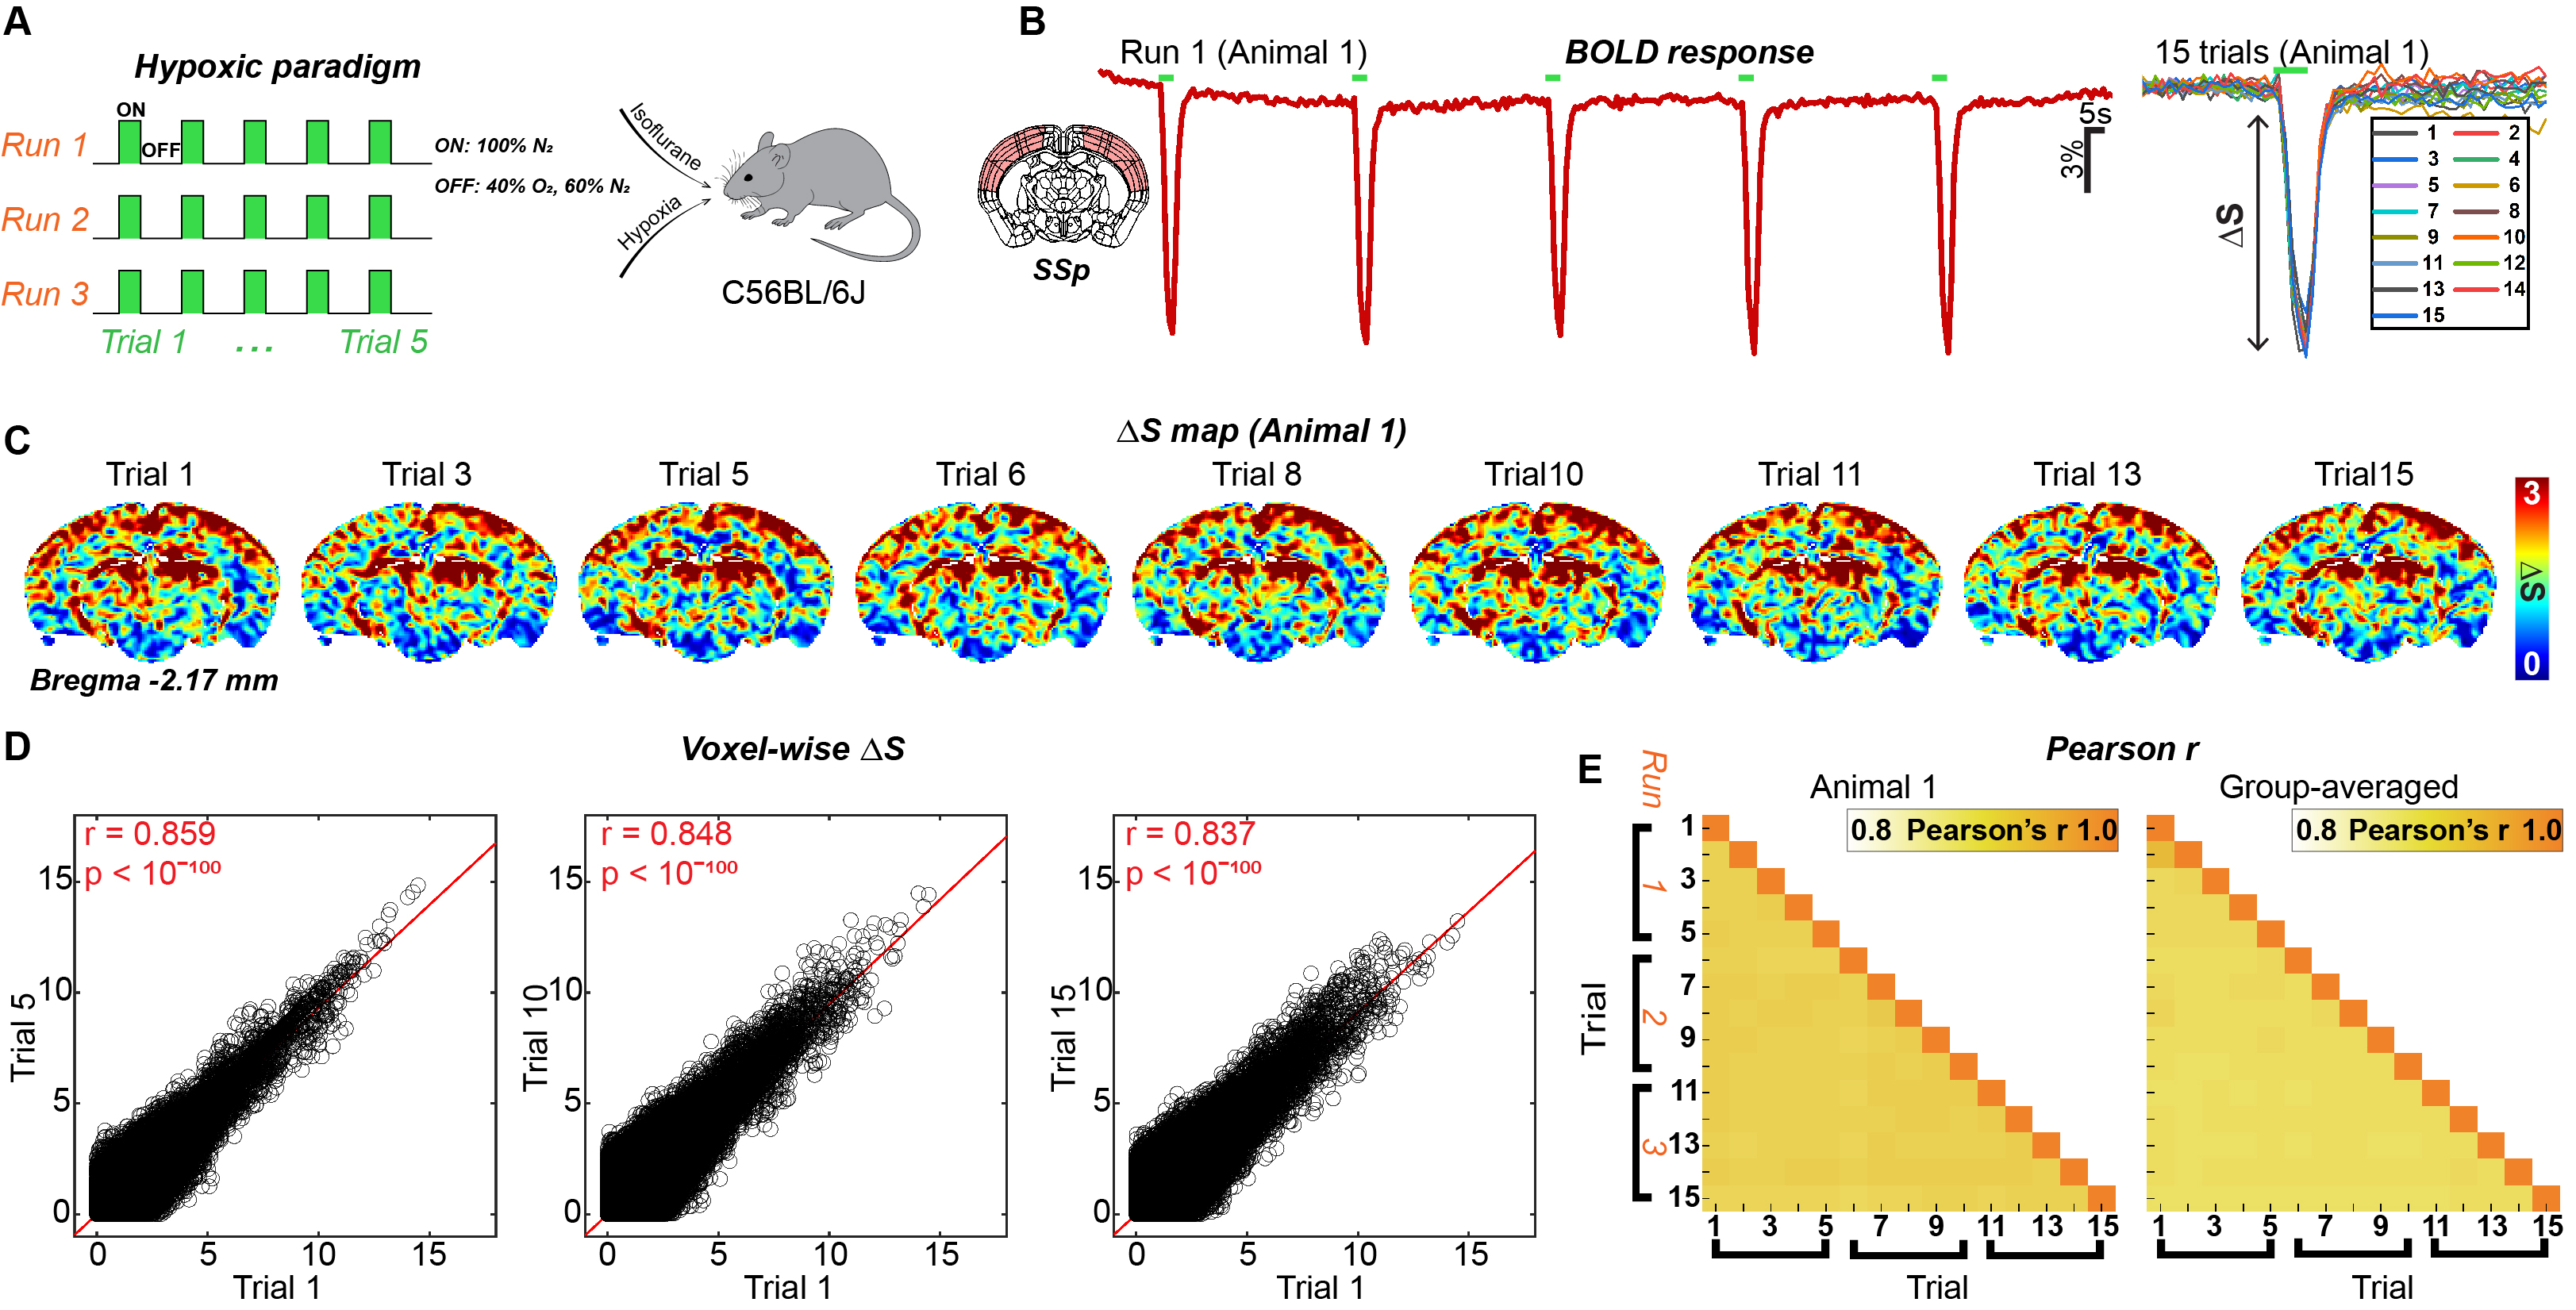
Set up and Hypoxic Gas StimulationThe experimental setup for transient anoxic stimulus under Isoflurane anesthesia was depicted in Fig. 1. Gas stimulus paradigm was delivered using a block design paradigm of 60s rest (40% O2/ 60% N2) and 5s stimulation (100% N2) alternatively repeated five times (Figure 2.A).
BOLD acquisitions
BOLD MRI studies were acquired on a 9.4T system using GE-EPI sequence with TR/TE =1000/11ms, FA=50°, 156x156x500 μm3 , 20 slices. To assess the reliability of technique, we conducted BOLD-DSC measurements with 10 C57BL/6 mice over four weekly sessions spanning a month. The identical procedure was repeated every week. Hypoxic stimulus was administered under 1.5% Isoflurane. Each subject underwent a total of 3 GE-EPI block-design runs.
Data analysis
The reproducibility of trial-wise BOLD-DSC measurements within each session was assessed for each animal during week 1, while the reproducibility of weekly BOLD-DSC measurements was evaluated across all animals from week 1 to week 4. To quantify perfusion values from dynamic hypoxia-induced BOLD responses, we adopted the DSC theory1.
Results
Reproducibility of trial-wise hypoxia-induced BOLD signal change within single sessionThe reproducibility of hypoxia-induced signal changes was examined across 15 trials in each animal. The voxel-wise absolute signal change induced by the hypoxic stimulation (∆S) was obtained from an average of 3-s data points around the peak for each trial. ∆S maps of several representative trials are shown for a single selected slice in one mouse (Fig. 2C). Next, voxel-wise ∆S values of all possible pairwise trials among 15 trials were compared (Fig. 2D). The ∆S values of the first trial were highly correlated with those of three randomly selected trials 5, 10, and 15 with Pearson’s r value of 0.859, 0.848, and 0.837, respectively (Fig. 2D). All r values of all paired trials were computed and presented as color maps (Fig. 2E, one animal (left) and group-average of 10 animals (right)). Overall, strong correlations (r values of >0.80) were consistently found, suggesting that the hypoxia-induced ∆S was highly reproducible across repeated trials.
Sensitivity of hypoxic-induced BOLD response within session
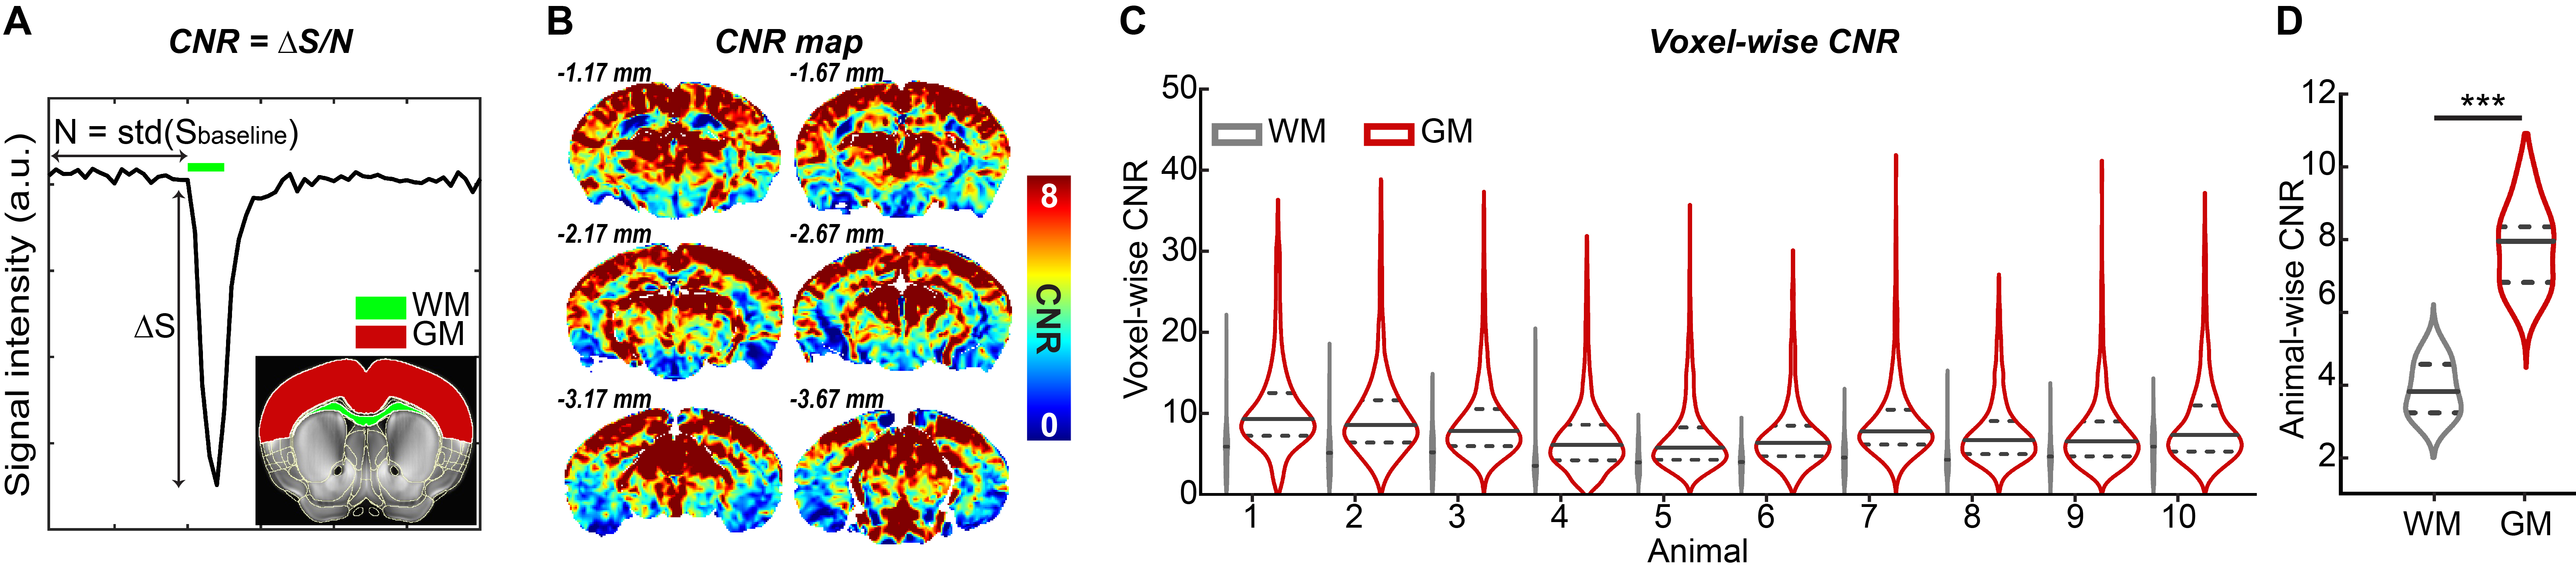
The contrast to noise ratio (CNR), an index of detectability, was examined from an average of 15 repeated trials within each animal, as proportional to ∆S/N (Fig. 3A). CNR maps of 6 exemplary slices in one representative animal (Fig. 3B) clearly differentiate the gray matter and white matter as well as the area containing large vessels. The distributions of voxel-wise CNRs in the white matter corpus callosum (1021 voxels, dark gray violins) and in the dorsal cortical ROI (16071 voxels, red violins) were plotted across 10 mice (Fig. 3C). The mean voxel-wise CNR of the dorsal cortex and CC region was 7.85± 1.15 and 2.76 ± 0.73 (Fig. 3D), respectively, and a ratio of mean CNR values between gray and white matter was 2.03 ± 0.15.
Reproducibility of hypoxic-induced BOLD-DSC measurements across four weekly sessions
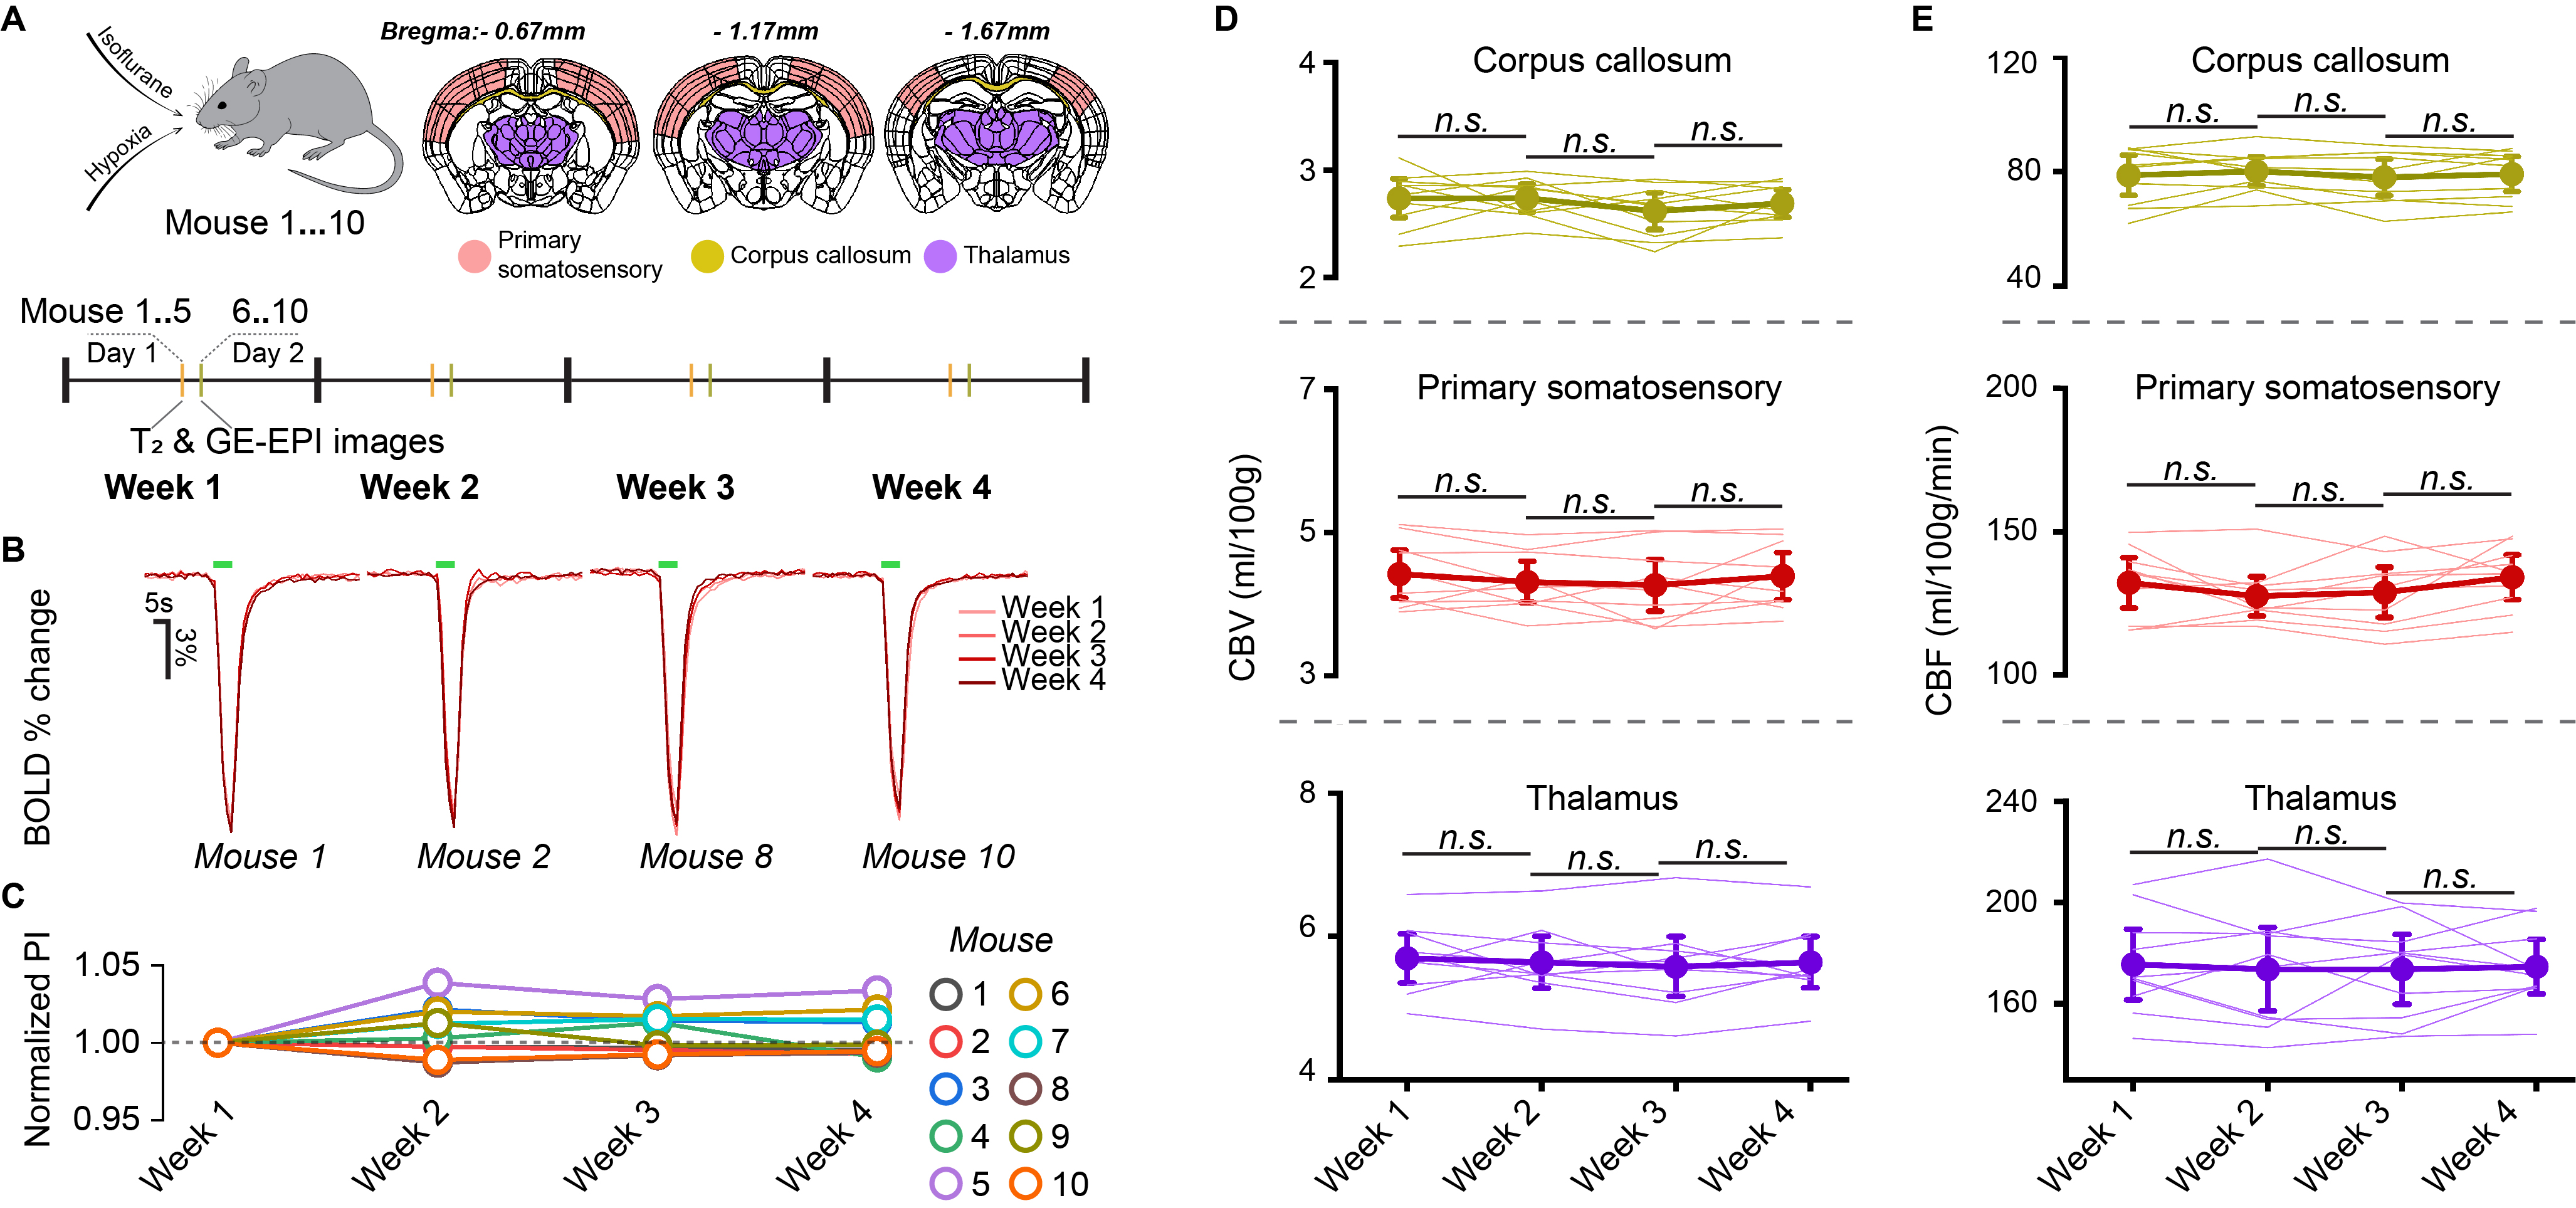
We observed almost identical hypoxia-induced BOLD responses in the primary somatosensory area (SSp) from week 1 to week 4 in all animals (Fig. 4B, data from four representative animals). Notably, there were slight variations in the peak amplitudes of BOLD responses in SSp among the 10 animals over four weeks (Fig. 4C). Hypoxia-induced BOLD responses were converted into absolute CBV and CBF values. We observed consistency in CBV and CBF measurements across four sessions. Importantly, no significant differences in quantitative regional CBV and CBF metrics were observed across the four repeated weekly measurements in the CC, SSp, and thalamus area (Figs. 4D-E). In summary, our BOLD-DSC measurements have high reproducibility and consistency over multiple scan sessions.
Discussion and Conclusions
We demonstrated excellent reproducibility and sensitivity of hypoxic-induced signal changes in BOLD data at the voxel level both within a single session and multiple sessions. The high reproducibility and sensitivity of our technique indicate its potential for routine perfusion measurements with high repeatability, which is particularly promising when considering the challenges faced by other techniques such as DSC with Gd injection and ASL2,3.Acknowledgements
This research was supported by the Institute of Basic Science (IBS-R015-D1).References
- Lee, D., Le, T. T., Im, G. H. & Kim, S.-G. Whole-brain perfusion mapping in mice by dynamic BOLD MRI with transient hypoxia. Journal of Cerebral Blood Flow & Metabolism, 0271678X221117008 (2022).
- Parkes, L. M., Rashid, W., Chard, D. T. & Tofts, P. S. Normal cerebral perfusion measurements using arterial spin labeling: reproducibility, stability, and age and gender effects. Magnetic Resonance in Medicine: An Official Journal of the International Society for Magnetic Resonance in Medicine 51, 736-743 (2004).
- Jahng, G.-H. et al. Human brain: reliability and reproducibility of pulsed arterial spin-labeling perfusion MR imaging. Radiology 234, 909-916 (2005).
Figures