2018
Quantitative T2 of Long Post-Labeling-Delay (PLD) ASL Signal as a Reporter of Extravascular Microenvironment1Biomedical Engineering, Johns Hopkins University, Baltimore, MD, United States, 2Radiology, Johns Hopkins University, Baltimore, MD, United States, 3Philips Healthcare, Rochester, MN, United States, 4F.M. Kirby Center for Functional Brain Imaging, Kennedy Krieger Institute, Baltimore, MD, United States
Synopsis
Keywords: Arterial Spin Labelling, Blood
Motivation: Quantitative T2 values of ASL spins may then inform their local microenvironment.
Goal(s): In this study, we aim to conduct a technical development to demonstrate the feasibility of measuring ASL T2 at long post-labeling-delay (PLD), at a time when the spins have fully exited the vasculature.
Approach: A protocol comprised of Pseudo-Continuous Arterial Spin Labeling (PCASL) module followed by optimized background suppression pulses and 2D multiple-spin-echo (MSE) EPI readout was used to collect T2-weighted images at different post labeling delay (PLD).
Results: We estimated T2 of ASL difference signals at long PLDs and also find age related changes in T2 values.
Impact: Our result suggests that ASL spins may be used as a reporting probe to assessment the microvascular environment of the brain in health and diseases.
Introduction
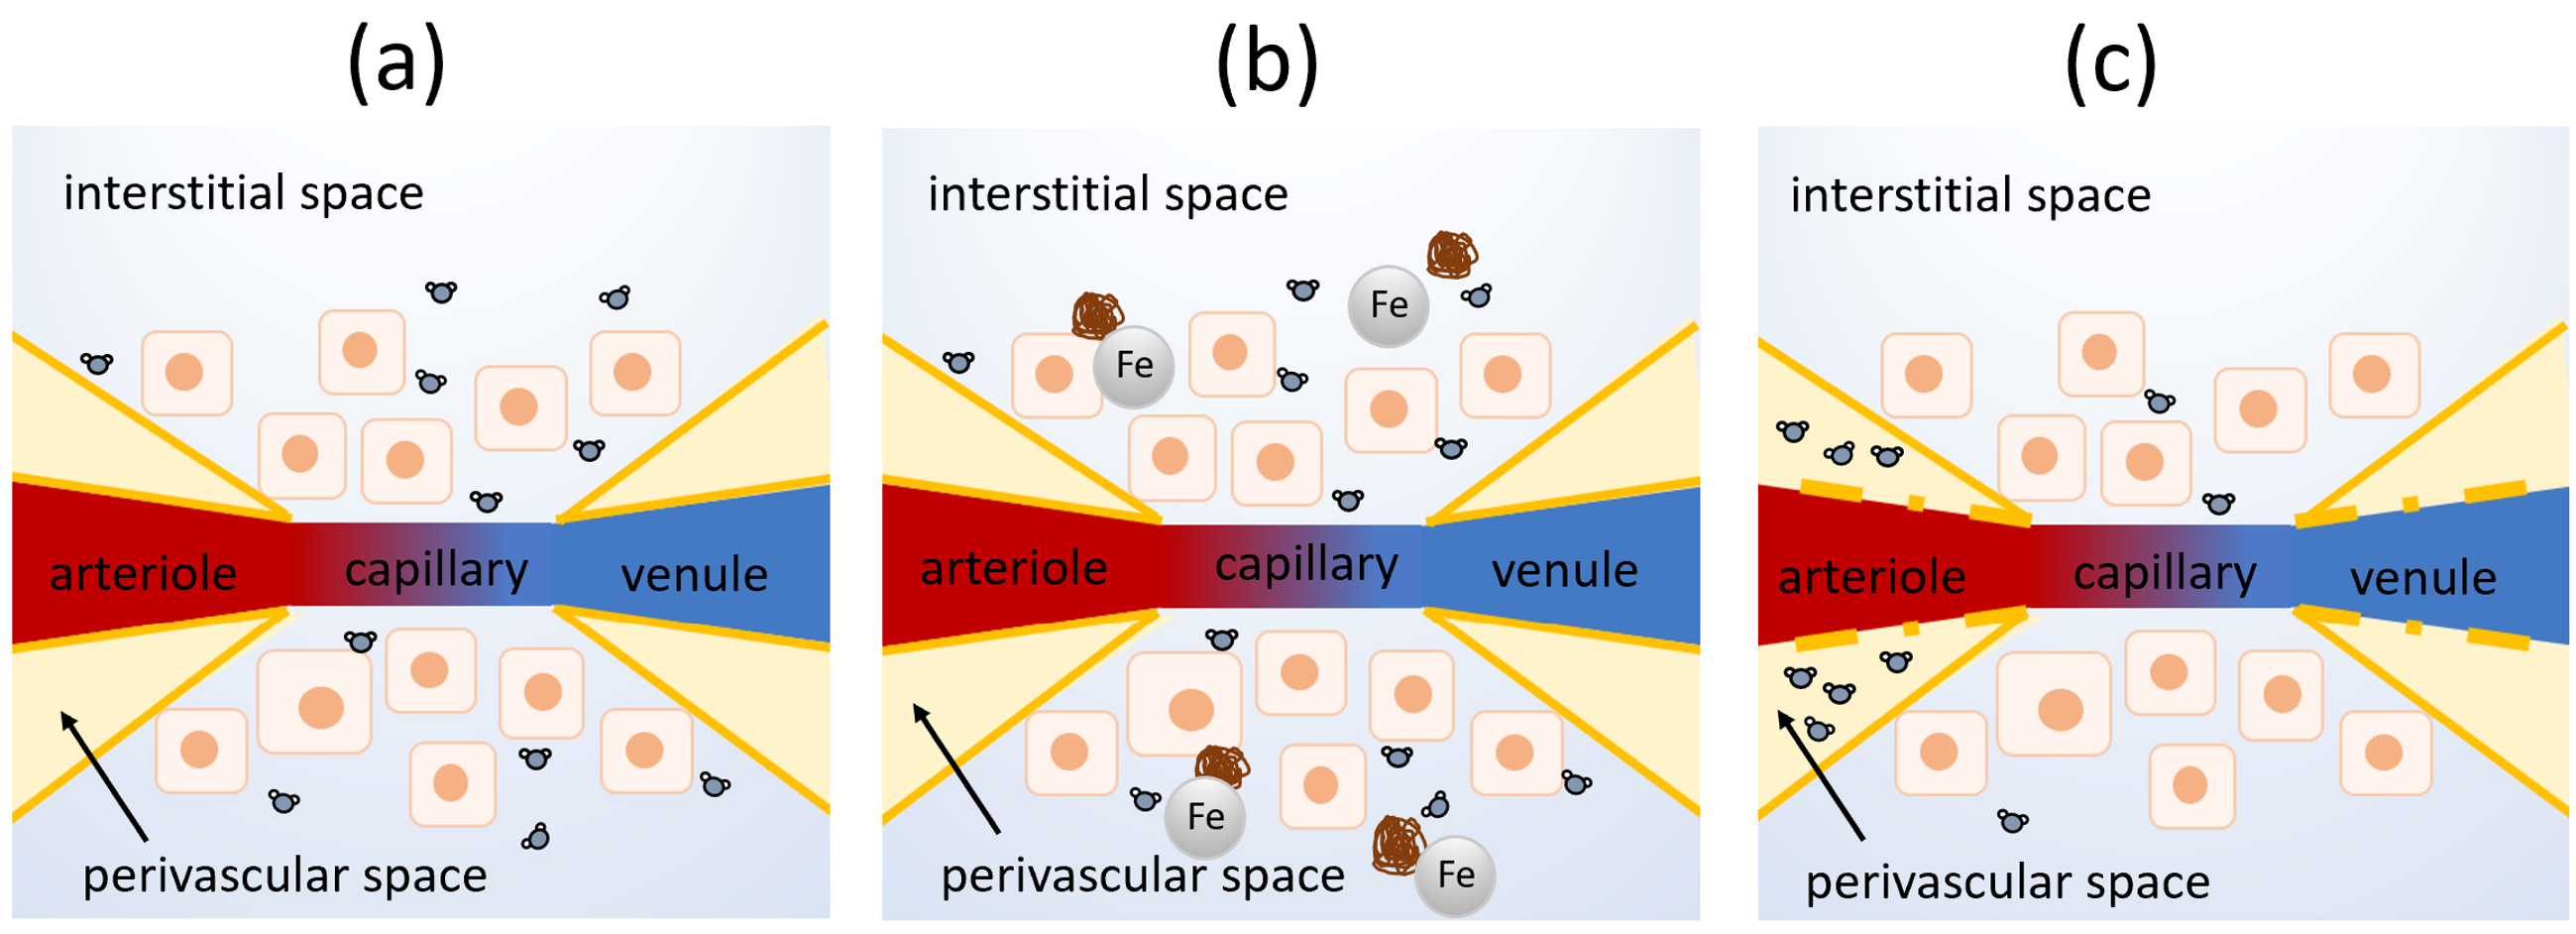
The vast majority of Arterial Spin Labeling (ASL) spins leaves vasculature after reaching capillary via water exchange. Quantitative T2 values of these spins may then inform their local microenvironment1. While there have been several studies to investigate T2 of ASL spins when still inside the vasculature1-5, no studies have focused on the spins’ microenvironment after they have reached tissue. As illustrated in Figure 1a, since the ASL spins will primarily reside in the interstitial space after leaving capillary, T2 of ASL spins may be sensitive to microenvironment changes in the interstitial space such as accumulation of iron-containing amyloid plaques (Figure 1b). On the other hand, when arterial vessels are damaged and the ASL spins leak to the perivascular space (Figure 1c), T2 of ASL may substantially lengthen due to the very long T2 of the CSF. In this study, we aim to conduct a technical development to demonstrate the feasibility of measuring ASL T2 at long post-labeling-delay (PLD), at a time when the spins have fully exited the vasculature. Age effect on ASL T2 was also investigated.Methods
All studies were performed in a 3T Philips MRI. Eight young healthy subjects (4F, 24.6±2.1 years) and five older subjects (3F, 68.8±5.6 years) were enrolled for this study.Experiments
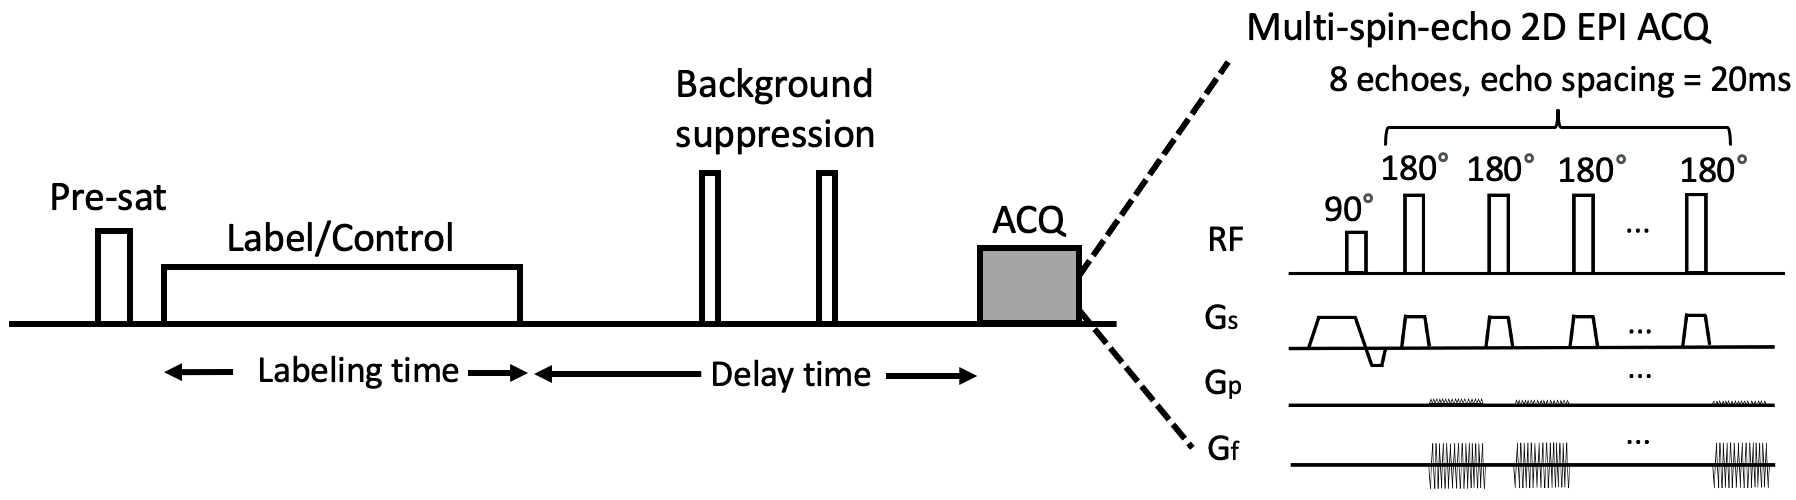
The main protocol comprised of Pseudo-Continuous Arterial Spin Labeling (PCASL) module followed by optimized background suppression pulses and 2D multiple-spin-echo (MSE) EPI readout, referred to as MSE protocol (Figure 2). Eight young healthy subjects were scanned with the MSE protocol using the following parameters: labeling duration=1s, post labeling delay (PLD)=1525ms, 2000ms, 2500ms, 3000ms, 3500ms, TE=20*8ms, 25 averages, total duration 18 min 26 sec. The labeling duration was purposely chosen to be relatively short to enhance the compartment specificity of our measurement. A MSE M0 scan was also acquired to get a reference of the T2 of control tissue signals. To investigate the age effect, five older subjects were scanned using the same MSE protocol at PLD=3000ms only (4 min 18 sec). We also compare the MSE sequence with another sequence in which different T2-weightings were collected in separate TRs, referred to as TRUST-PCASL1, which has the advantage of immune to spin outflow effect on T2 estimation but is more time-consuming. Four of the eight young healthy subjects (1F, 25.5±1.7 years) received the TRUST-PCASL protocol1 used the following parameters: labeling duration = 1s, PLD = 200ms, 850ms, 1525ms, 2000ms, eTE = 0ms 40ms, 80ms, 160ms, 16 averages, scan time 28 min 4 sec.
Data Analysis
T2 of ASL signals in the gray matter ROI was estimated.
Results/Discussion
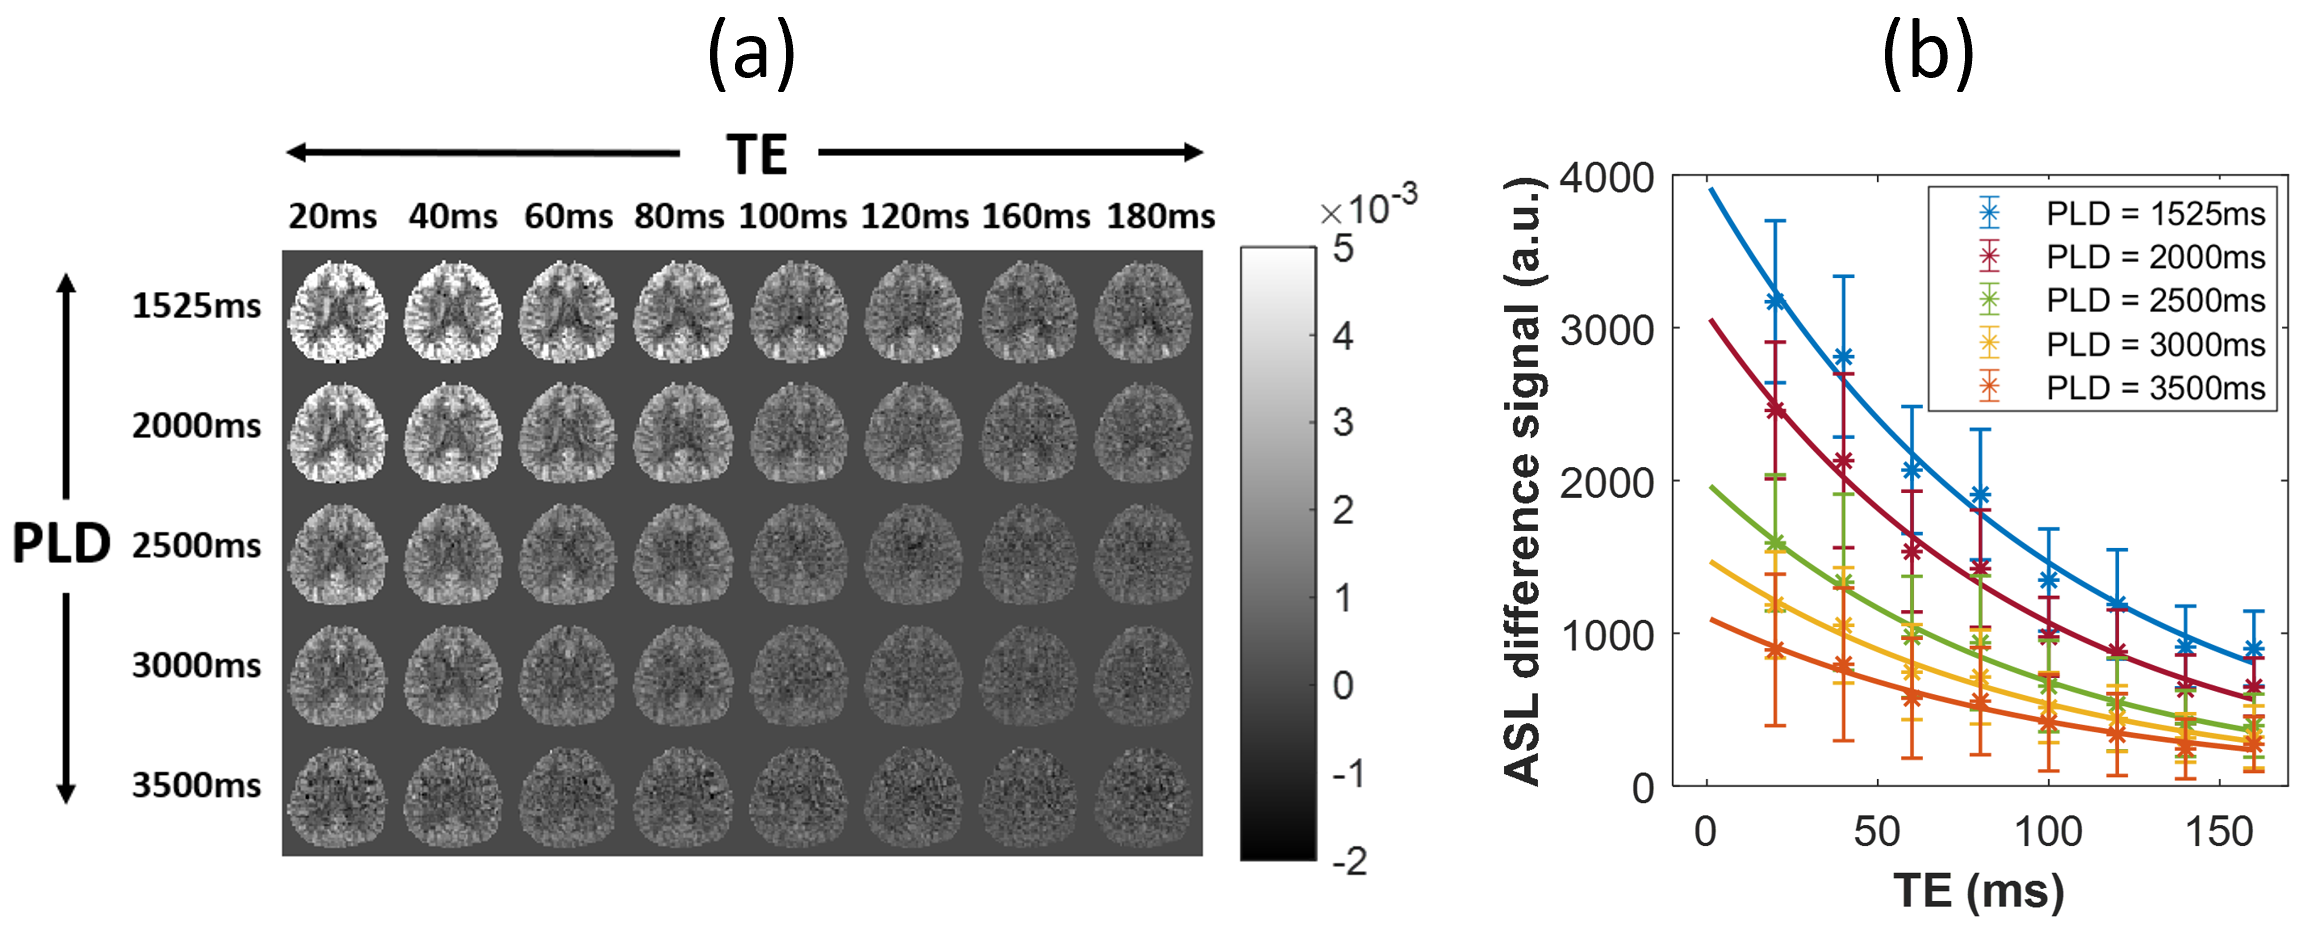
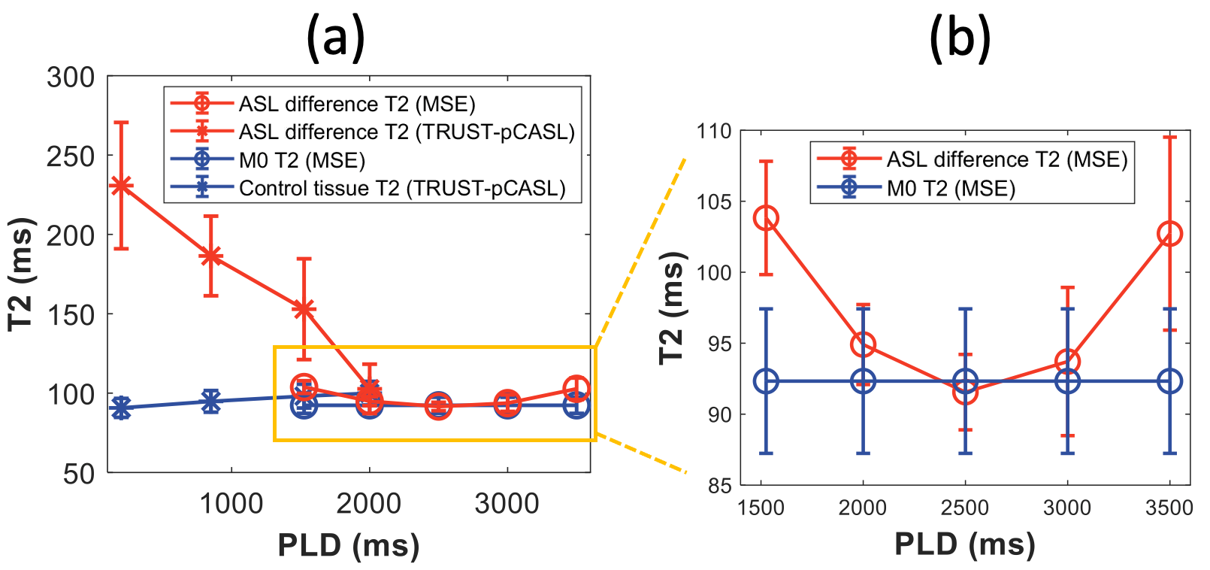
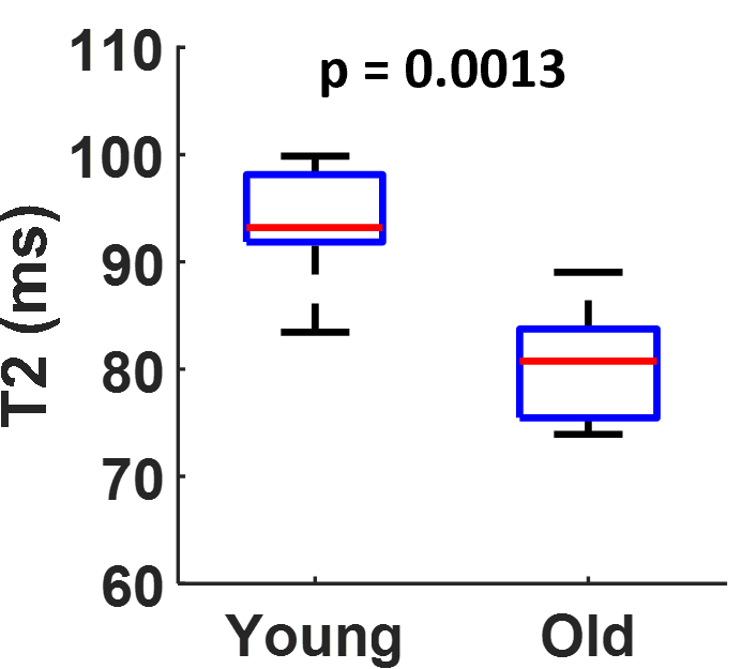
A representative set of ASL images acquired by the MSE protocol are displayed in Figure 3a. The signal intensity of the ASL difference images decreases as TE and PLD increases. Figure 3b shows the T2 fitting results from a representative subject. Generally, the ASL T2 fitting was reliable with 95% confidence interval of 97.1±9.8ms. Figure 4 shows the averaged T2 value of ASL difference signal and control tissue signal over PLD measured by both the MSE sequence and the TRUST-PCASL sequence. As the PLD increases from 200ms to 2000ms, the T2 from TRUST-PCASL decreases significantly as the spins enter capillaries from arteries with an oxygenation decrease. At the post labeling delay time of 2000ms, the T2 fitting results from the MSE sequence and the TRUST-PCASL sequence are very similar, suggesting that the flow effect was minimal at a PLD of 2000ms or longer (once the spins have left the vasculature). Interestingly, after PLD=2500ms, the averaged T2 value from MSE approach starts to increase (linear mixed model with quadratic term, p<0.001). Furthermore, the T2 value from ASL signal is significantly higher than the T2 value of the M0 tissue at PLD = 3500ms (p=0.009). These findings suggest that the ASL spins may be in compartments other than intracellular space, such as perivascular spaces or interstitial spaces which have a higher T2 due to lower protein contents. Figure 5 compares ASL T2 values between young and older participants (at PLD=3000ms). The T2 values of young healthy participants are significantly higher than the T2 values of old participants (p=0.001). One possible explanation is that older participants have more iron-containing protein aggregates such as amyloid plaques, which leads to a lower T2.Conclusion
In this study, we estimated T2 of ASL difference signals at long PLD (3000ms). These data, including the age-related ASL T2 changes, suggest that ASL spins may be used as a reporting probe to assess the microvascular environment of the brain in health and diseases.Acknowledgements
No acknowledgement found.References
1. Liu P, Uh J, Lu H. Determination of spin compartment in arterial spin labeling MRI. Magnetic resonance in medicine 2011;65:120-127.
2. Gregori J, Schuff N, Kern R, Günther M. T2‐based arterial spin labeling measurements of blood to tissue water transfer in human brain. Journal of magnetic resonance imaging 2013;37:332-342.
3. Ishida S, Kimura H, Takei N, Fujiwara Y, Matsuda T, Kanamoto M, Matta Y, Kosaka N, Kidoya E. Separating spin compartments in arterial spin labeling using delays alternating with nutation for tailored excitation (DANTE) pulse: A validation study using T2‐relaxometry and application to arterial cerebral blood volume imaging. Magnetic Resonance in Medicine 2022;87:1329-1345.
4. Schidlowski M, Boland M, Rüber T, Stöcker T. Blood–brain barrier permeability measurement by biexponentially modeling whole‐brain arterial spin labeling data with multiple T2‐weightings. NMR in Biomedicine 2020;33:e4374.
5. Schmid S, Teeuwisse WM, Lu H, van Osch MJ. Time-efficient determination of spin compartments by time-encoded pCASL T2-relaxation-under-spin-tagging and its application in hemodynamic characterization of the cerebral border zones. Neuroimage 2015;123:72-79.
Figures