2017
Multi-PLD ASL avoids up to 30% CBF underestimation in above half subjects without compromising test-retest reliability compared to single-PLD1Laboratory of FMRI Technology (LOFT), Mark & Mary Stevens Neuroimaging and Informatics Institute, Keck School of Medicine, University of Southern California, Los Angeles, CA, United States
Synopsis
Keywords: Arterial Spin Labelling, Brain, Single-PLD, Multi-PLD
Motivation: Long arterial transit time (ATT) may cause underestimation of CBF in single-delay arterial spin labeling (ASL) quantification.
Goal(s): Our goal is to evaluate the accuracy and reliability between single- and multi-delay ASL acquisition.
Approach: 28 subjects underwent test-retest scans ~1 week apart. Voxel-wise and regional CBF/ATT values were quantified to evaluate the test-retest reliability. ATT values obtained from 5-PLD data were used to estimate quantification errors for CBF estimated from single-delay (PLD=2s) ASL.
Results: Overall, single-delay may cause an average of 4% to 30% of CBF underestimation in 56% regions. 5-delay is a solid solution to evaluate ATT and CBF.
Impact: While single-delay ASL results in slightly higher test-retest reliability, the underestimation of CBF may compromise the quantification accuracy. Since ATT variation is more common in elderly and patients, multi-delay ASL with model-fitting analysis is expected to outperform single-delay ASL.
Background
Both single-delay and multi-delay are commonly used in arterial spin labeling (ASL) acquisitions. Because of the prolonged ATT in elderly subjects and/or under disease conditions, it may cause underestimation of CBF if the post-labeling delay(PLD) is not optimally selected for single-delay ASL1. Multi-delay ASL can mitigate this problem by acquiring images at different PLDs to estimate both CBF and ATT values. In this study, we systematically compared single- and multi-delay ASL, including the degree of CBF underestimation with single-delay compared to multi-delay acquisitions, as well as the test-retest reliability of both methods.Method
28 healthy participants (14 females, age=39 ±17 years) received both single-delay and multi-delay ASL scans on a Siemens 3T Prisma scanner. Test and retest scans were acquired about one week apart. Imaging parameters for 3D GRASE pCASL were: FOV=240×240mm2, resolution=2.5×2.5×3mm3, 40 slices, 10% slice oversampling, TE of 37.8ms, and TR of 4500ms, labeling duration=1.8s. PLD=2s for single-delay, 9 repetitions were acquired in 5min 24s. Multi-delay used the same labeling duration and PLDs=[0.5,1,1.5,2,2.5]s with [2,2,2,3,3] repetitions, more repetitions were acquired for longer PLDs to improve SNR. Total acquisition time was 7min 12s. M0 was acquired separately in the 18s. Control/label images were motion corrected and normalized to Montreal Neurological Institute (MNI) on SPM12 to obtain perfusion images. CBF values for single-delay acquisition were calculated based on the single-compartment Kety model2, assuming ATT<2s. Multi-delay ATT and CBF maps were calculated by model fitting approach3. Both ROI such as frontal lobe and voxel-wise average values were extracted for each scan. To estimate the probability that an underestimation occurs for each voxel, we calculated the ratio of ATT underestimation by counting the number of scans that had an estimated ATT>2s versus the total of scans to indicate the possibility of ATT exceeding 2s at each voxel. Then, the average ATT bias was calculated by Eq.[1] for voxel higher than 2s and longer ATT bias suggests longer PLD should be used to avoid CBF underestimation. Finally, the underestimation of CBF using the single-delay approach compared to single-delay CBF calculated with 5-PLD ATT was quantified by Eq.[2].We furthermore calculated the reliability of CBF/ATT between the test and retest scans using the intra-class correlation coefficient (ICC) in both ROIs and voxels.
$$ ATT_{bias} = \sum (ATT_{over2000ms} - 2000)/(N_{SubjectswithATT>2000ms}) [1] $$
$$ \% CBF_{underestimation}=(CBF_{singleDelayCalculated}-CBF_{singleDelayOrignal})/(CBF_{singleDelayCalulated})×100 \% [2] $$
Results and discussion
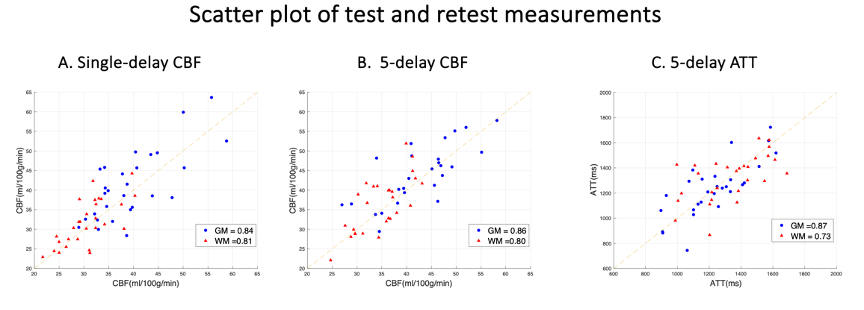
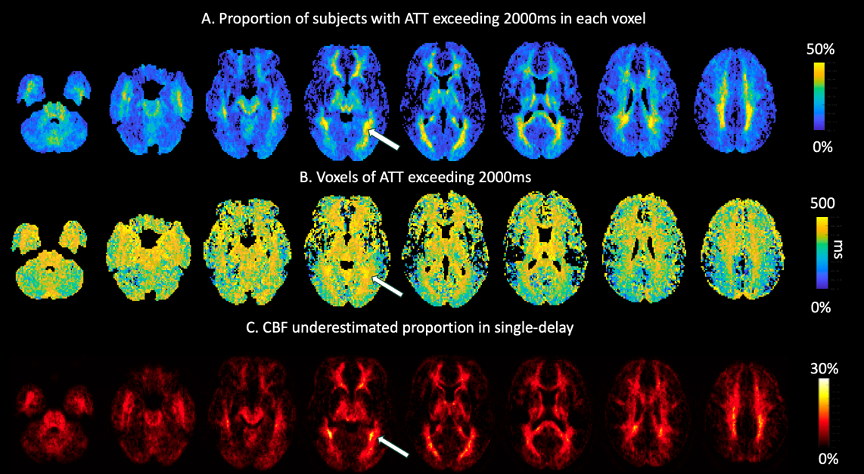
Figure 1 displays scatter plots of test and retest values for CBF (A and B) and ATT (C), in GM (blue) and WM (red) across 28 subjects. 5-delay CBF demonstrated similar ICCs compared with the single-delay approach.Figure 2 shows the averaged ATT underestimation ratio maps as well as the resulting CBF underestimation level. Fig.2A reveals that approximately 56% of voxels had an ATT greater than 2,000ms in some specific brain regions, such as the parietal lobe. Figure.2B shows a map of ATT bias between 0 to 500ms, indicating that for these voxels, there could be biases in CBF estimation due to longer ATT. Figure 2C illustrates the differences in CBF between single-delay and multi-delay averaged voxels higher than 2s across all subjects. The highlighted area indicates the greatest CBF underestimation around 30%.
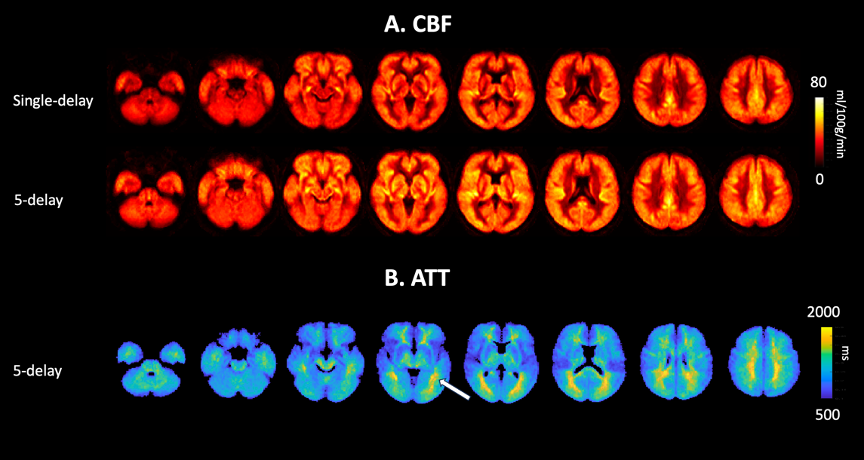
Figure 3 shows eight representative slices of averaged CBF (A) and ATT (B) maps obtained from 28 subjects' test-retest scans. 5-delay ASL shows higher CBF values, predominantly in regions with prolonged ATT (e.g. posterior brain).
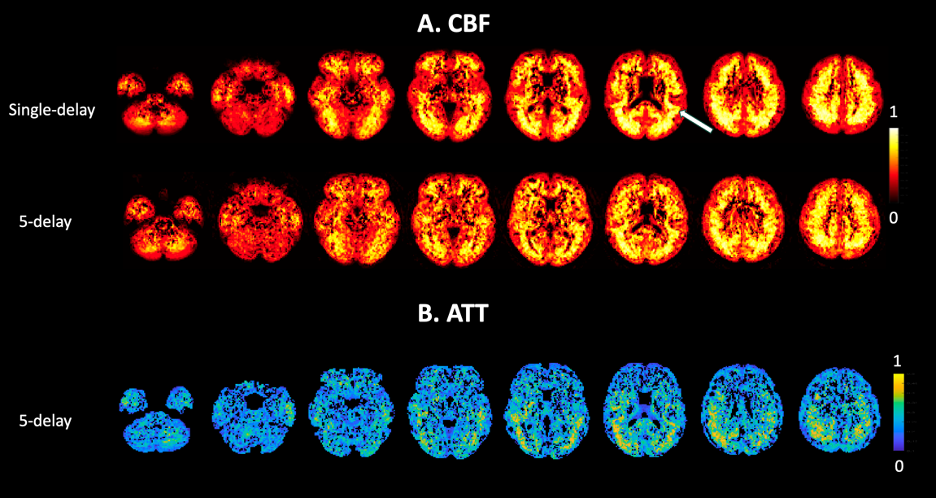
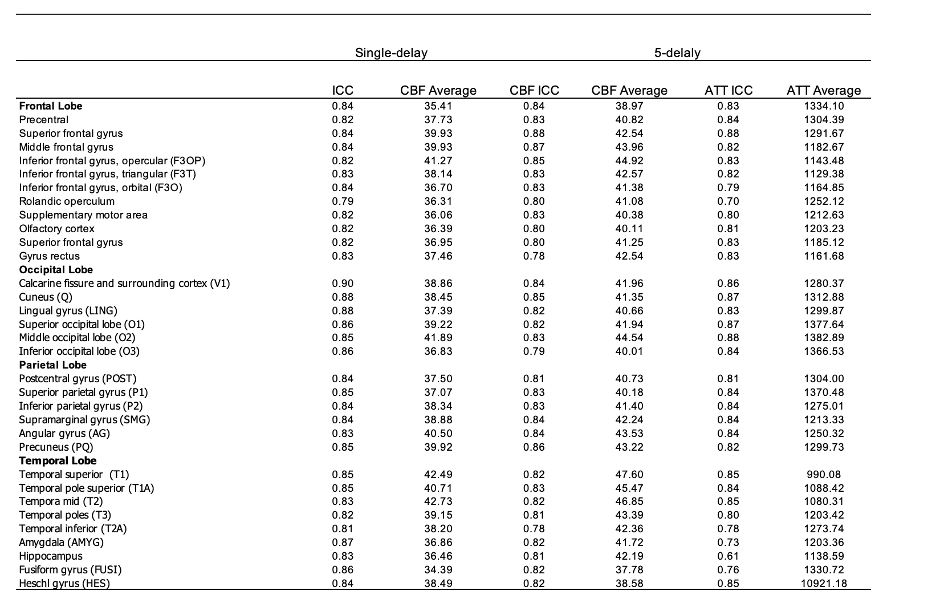
Figure 4 shows eight representative slices of CBF (A) and ATT (B) ICC maps, indicating slightly higher test/retest reliability of CBF measurements using single-delay acquisition. Table 1 shows average CBF/ATT values, and ICC in each ROI. Overall ICC values were comparable between single-delay (0.80±0.06) and 5-delay (0.79±0.04) CBF measurements. ICC values were 0.73±0.13 for ATT across brain regions indicating good repeatability of ATT measurements. Consistent with Fig. 4, single-delay ASL shows slightly higher ICC of CBF across the majority of brain regions, while 5-delay showed higher ICC in part of frontal lobe regions (e.g. 0.88 versus 0.84 in superior frontal gyrus) and comparable ICC in the parietal lobe regions. Notably, single-delay ASL systematically underestimated CBF around 10% across brain ROIs.
Conclusion
In conclusion, multi-delay CBF has comparable test-retest reliability to single-delay CBF. However, due to the ATT variation for each subject and different regions, ATT has around 56.1% possibility to exceed 2000ms, which could result in CBF underestimation by 4%~30%. Both whole brain and voxel-wise CBF results have shown the CBF value quantified from single-delay ASL is systematically about 10% lower compared with 5-delay ASL. Meanwhile, 5-delay would be a valid solution to evaluate ATT and CBF simultaneously with comparable test-retest reliability.Acknowledgements
This work was supported by National Institute of Health (NIH) grant R01-NS114382, R01-EB032169 and R01-EB028297.
References
1. Lin T, Qu J, Zuo Z, Fan X, You H, Feng F. Test-retest reliability and reproducibility of long-label pseudo-continuous arterial spin labeling. Magnetic resonance imaging. 2020;73:111-117.
2. Buxton RB, Frank LR, Wong EC, Siewert B, Warach S, Edelman RR. A general kinetic model for quantitative perfusion imaging with arterial spin labeling. Magnetic resonance in medicine 1998;40(3):383-396.
3. Shao X, Wang D. Single shot high resolution 3D arterial spin labeling using 2D CAIPI and ESPIRiT reconstruction. 2017. p 3629.
Figures