2014
Machine Learning Based Approach for Partial Volume Corrected Cerebral Blood Flow and Arterial Transit Time Mapping1Radiology, University of California, Davis, Sacramento, CA, United States, 2Stanford University, Palo Alto, CA, United States, 3Wake Forest School of Medicine, Winston-Salem, NC, United States, 4Zhejiang University, Hangzhou, China, 5Medical College of Wisconsin, Milwaukee, WI, United States
Synopsis
Keywords: Arterial Spin Labelling, Arterial spin labelling
Motivation: To reduce a scan time of multi-PLD PCASL imaging using a convolutional neural network (CNN) for robust estimation of partial volume (PV)-corrected ATT and CBF maps.
Goal(s): To develop a CNN to predict PV-corrected ATT and CBF from fewer PLDs, ensuring minimal accuracy loss.
Approach: Trained and validated a CNN on multi-PLD ASL data from 48 subjects, comparing its performance with a standard method.
Results: The CNN achieved low mean average errors, suggesting reduced PLD count does not significantly affect ATT and CBF estimation accuracy.
Impact: The study’s CNN reduces MRI scan times while accurately estimating brain hemodynamic parameters, such as cerebral blood flow and arterial transit time, enhancing patient comfort and diagnostic efficiency, potentially transforming cerebrovascular disease monitoring and advancing AI integration in medical imaging.
Introduction
Arterial spin labeling (ASL) is an MRI technique to measure cerebral blood flow (CBF) by labeling arterial blood in the neck, with multiple post labeling delays (PLDs) enhancing accuracy by estimating arterial transit time (ATT). However, multi-PLD ASL's longer scan time limits its clinical use and increases motion artifact risk. Deep learning has been proposed to maintain accuracy with fewer PLDs1, but previous studies didn’t address partial volume (PV) effects, which can distort results due to mixed tissue signals in brain voxels. A modified 3D hierarchically structured convolutional neural network (H-CNN) has been adapted to address this, providing PV-corrected ATT and CBF estimations. This approach could reduce scan times while preserving the ability to correct for PV effects, potentially improving the utility of ASL in clinical settings.
Methods
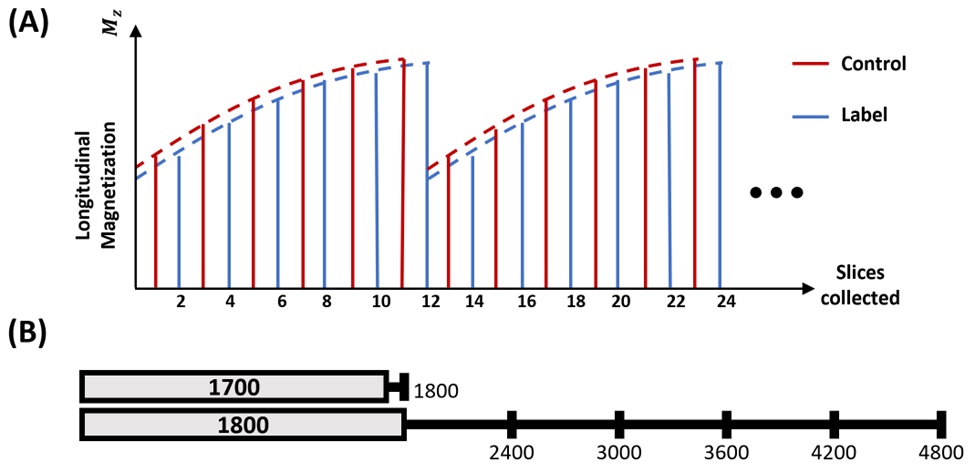
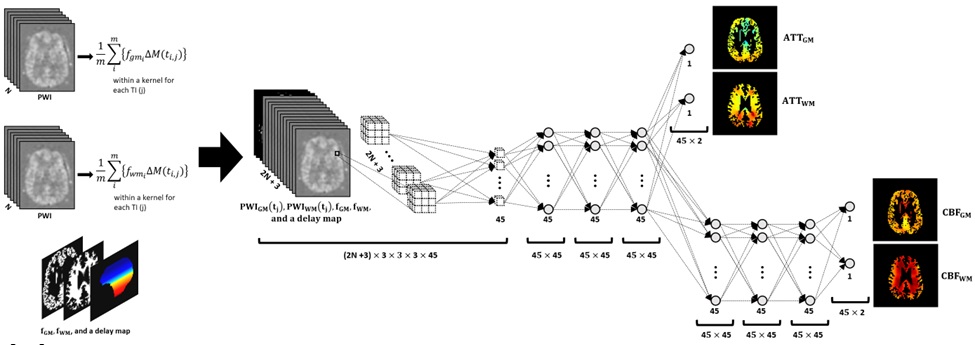
The study used a multi-PLD PCASL MRI technique2 to acquire brain images of 48 subjects without severe neurological diseases on which included a multi-PLD PCASL scheme (Figure 1) on a 3T Siemens Skyra MRI with a 32-channel head coil. For the multi-PLD PCASL scheme, a total of 6 PLDs 0~3000ms with increments of 600ms and six averages per PLD were collected. A separately acquired T1-weighted structural image was used for tissue fraction estimates. The tissue probability maps were obtained through a nonlinear normalization between the acquired T1-weighted image and a T1-weighted based tissue probability template. The ASL signal was formulated considering the tissue PV estimates, excluding the CSF due to its negligible blood flow. Linear regression-based PVC3 and nonlinear model fitting methods were applied to create reference ATT and CBF maps using the full dataset. A CNN, specifically a modified H-CNN, was implemented for simultaneous estimation of PV-corrected ATT and CBF in grey and white matter (Figure 2). This network was trained using a subset of subjects and tested on others, with RMSE as the loss function. The H-CNN processed input PWIs using kernel-based PVC before estimating the ATT and CBF maps, employing leaky ReLU activations and an Adam optimizer for training. The study also investigated the impact of using reduced PLD information on ATT and CBF estimation accuracy. The selection of optimal PLDs was guided by the normalized RMSEs, which were lowest when using the best PLD combination determined separately for the H-CNN and the nonlinear fitting method. Experiments ran on high-performance Linux machines with NVIDIA GPUs and were developed in Python using Keras and TensorFlow. The effectiveness of the neural network was measured against ground truth images, with Mean Absolute Errors (MAE).Results
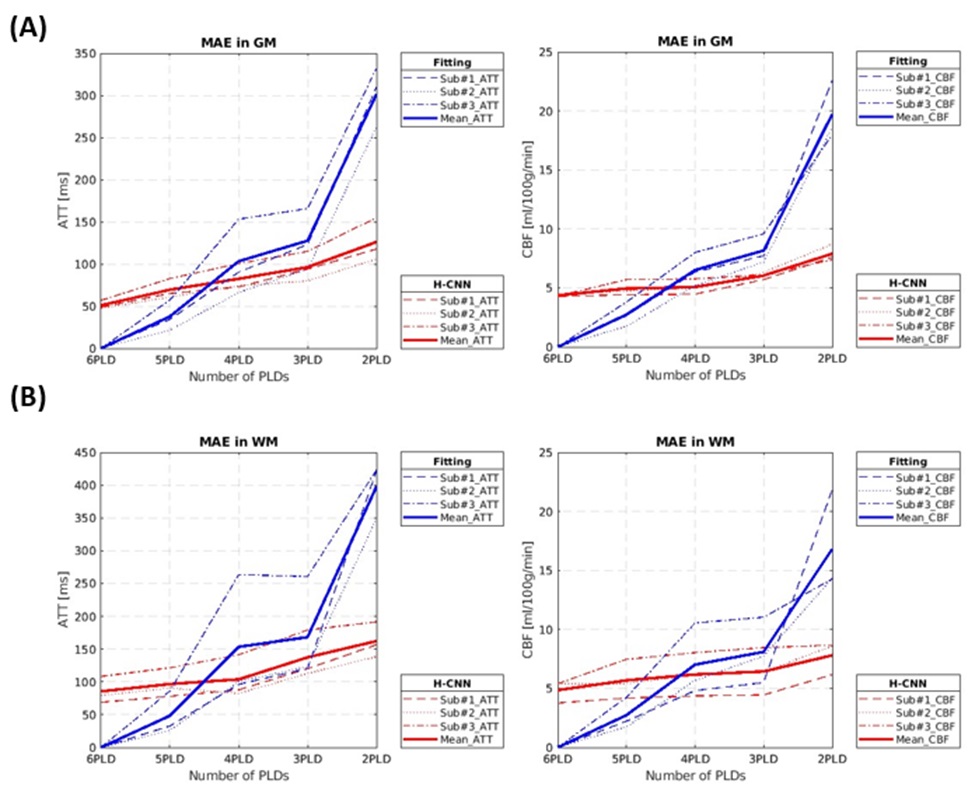
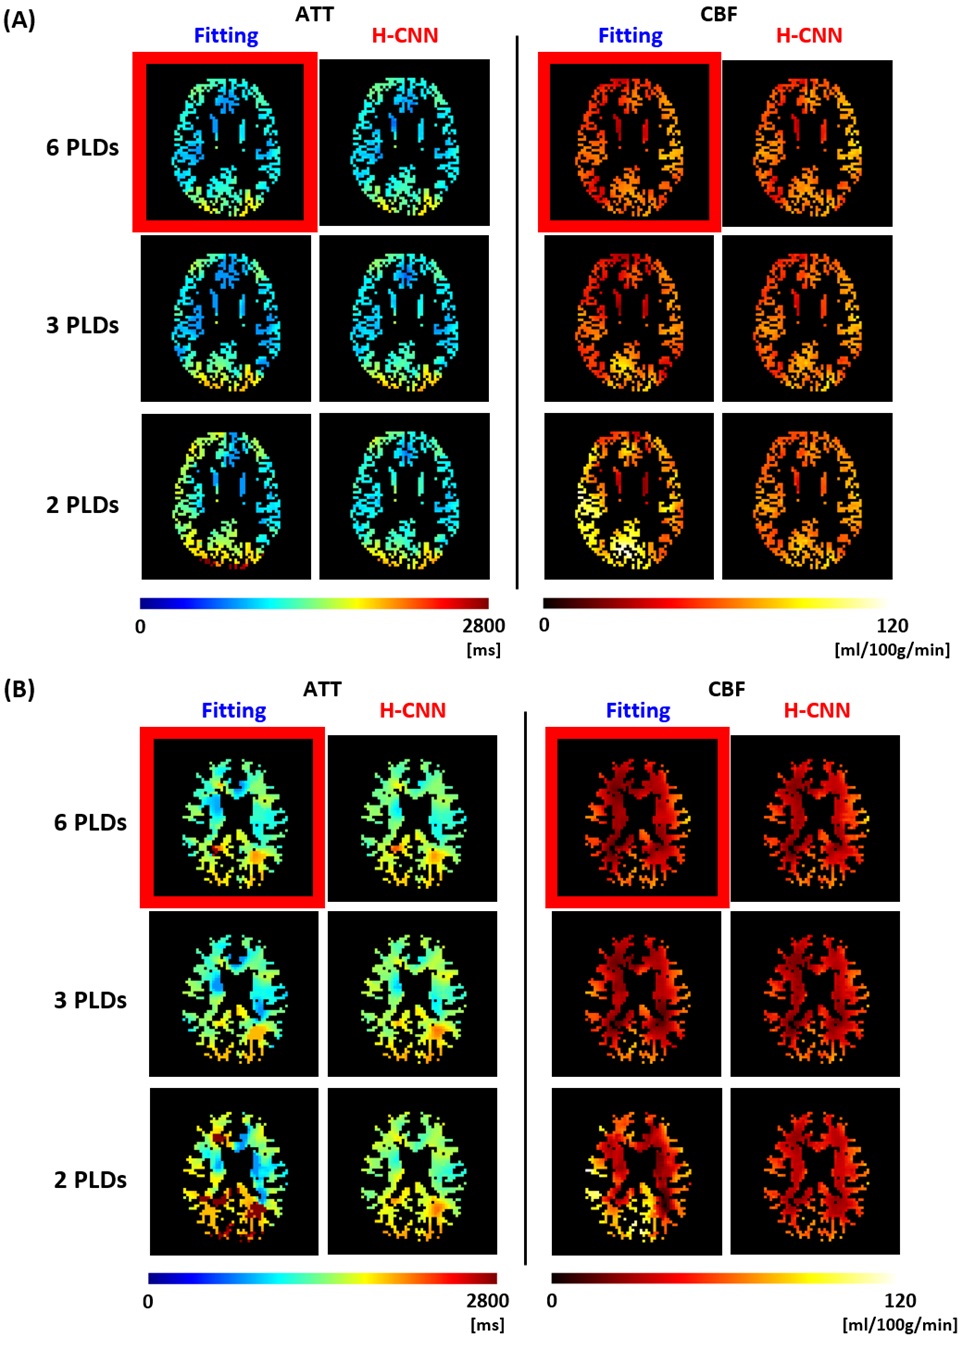
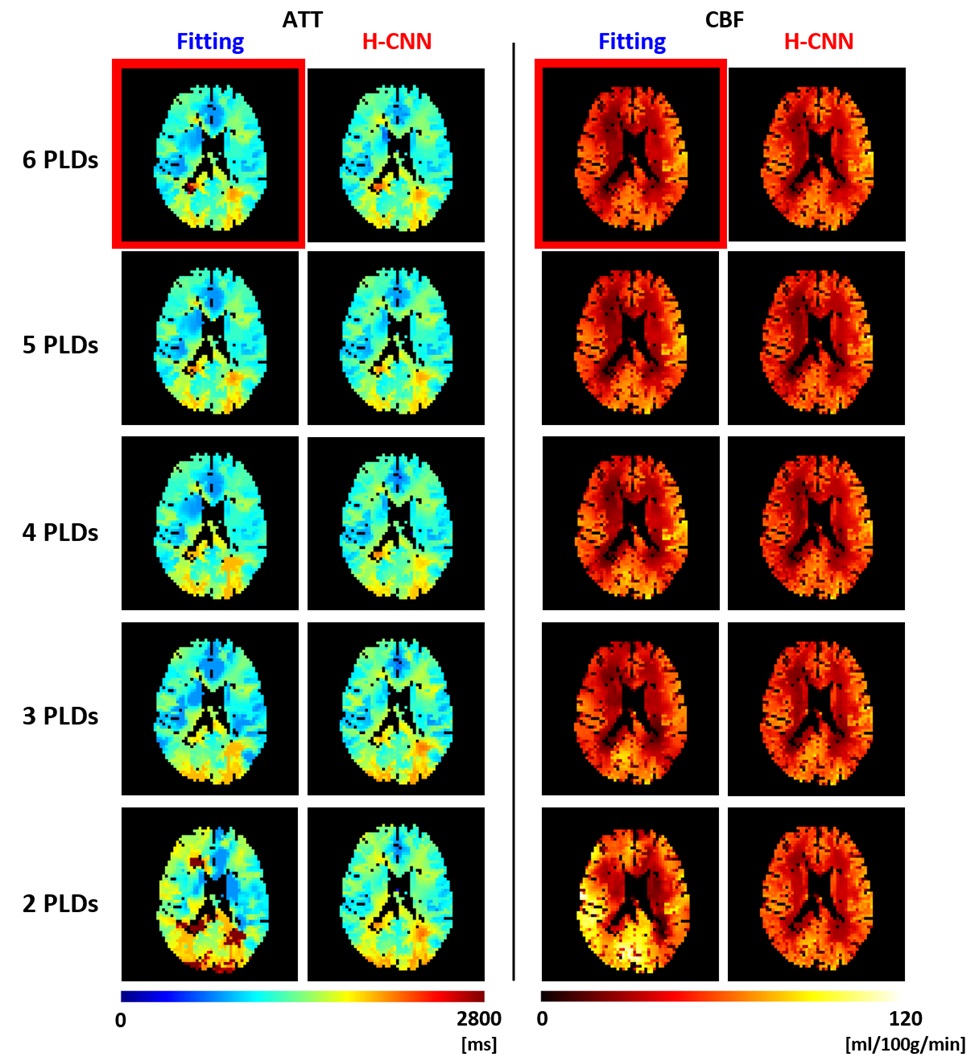
The study demonstrated that training neural networks for estimating ATT and CBF stabilized after including data from 30 subjects, with 45 subjects being sufficient for robust training. Comparisons were made between a conventional nonlinear fitting method and a modified H-CNN model under conditions of reduced PLDs. The H-CNN outperformed the conventional method with fewer than five PLDs, which is illustrated in Figure 3. Furthermore, Figures 4 and 5 displayed estimated ATT and CBF maps for test subjects, with the H-CNN showing closer approximation to the reference from full datasets even with fewer PLDs. Time savings achieved by using two and three PLDs are 73% and 56%, respectively. while MAE between ground truth and estimated values under various PLD conditions were shown in Figure 3 underscoring the effectiveness of H-CNN in producing accurate brain maps with reduced data and shorter scan times.Discussion
The study showed that a modified H-CNN model can accurately estimate ATT and CBF maps from multi-PLD PCASL data with fewer PLDs, without significant loss of information compared to the reference images. When less than five PLDs were used, the H-CNN surpassed the conventional nonlinear fitting in accuracy. Despite using a seemingly small sample of 45 subjects for training, the model was effectively trained, as indicated by the results and minimal discrepancies in estimation errors. The study, however, had limitations including the ground truth not being the gold standard, assumptions made for tissue and blood T1 values, and not testing on diverse populations or comparing to other deep learning methods. Furthermore, only one partial volume correction method was utilized, and its impact on results may vary with different methods.Conclusion
The study aimed to reduce a scan time of multi-PLD PCASL using a modified H-CNN for accurate PV-corrected ATT and CBF maps estimation with fewer PLDs, successfully reducing scan time without significant information loss.Acknowledgements
Grant support: This work was supported by the Wake Forest Alzheimer’s Disease Research Center (NIH P30AG072947) and an NIH Research grant (RF1NS110043).References
1. Kim D, Lipford ME, He H, Ding Q, Ivanovic V, Lockhart SN, Craft S, Whitlow CT, Jung Y. Parametric cerebral blood flow and arterial transit time mapping using a 3D convolutional neural network. Magnetic Resonance in Medicine 2023.;90(2):583-595. 2. Johnston ME, Lu K, Maldjian JA, Jung Y. Multi-TI arterial spin labeling MRI with variable TR and bolus duration for cerebral blood flow and arterial transit time mapping. IEEE transactions on medical imaging 2015;34(6):1392-1402. 3. Asllani I, Borogovac A, Brown TR. Regression algorithm correcting for partial volume effects in arterial spin labeling MRI. Magnetic Resonance in Medicine: An Official Journal of the International Society for Magnetic Resonance in Medicine 2008;60(6):1362-1371.Figures