2011
Clinical application of multi-delay arterial spin labeling MRI to Parkinson’s disease: more insights into hemodynamic disturbance1Dalian Medical University, Dalian, China, 2GE Healthcare, Beijing, China, 3Clinical medical college, Yangzhou University, Yangzhou, China
Synopsis
Keywords: Arterial Spin Labelling, Machine Learning/Artificial Intelligence
Motivation: Hemodynamic disturbance is one of the neuropathological characteristics of Parkinson's disease (PD). Multi-delay arterial spin labeling (m-ASL) MRI can optimize the accuracy of cerebral blood flow (CBF) quantification by taking into account arterial transit time (ATT).
Goal(s): We aimed to comprehensively explore the detailed abnormalities of hemodynamics in PD and verify the application of m-ASL in PD diagnosis.
Approach: Voxel-based analysis and machine learning approach were applied to this study.
Results: Our findings identified impaired hemodynamics in PD with regional abnormalities of CBF, ATT and cerebral blood volume, providing complementary depictions of perfusion disruption in PD and highlighting the clinical feasibility of m-ASL.
Impact: Our results provided complementary depictions of perfusion disruption in PD, and validated the promise of m-ASL in the investigation of underlying neurodegeneration and the clinical diagnosis of PD, providing an effective neuroimaging biomarkers for the diagnosis of neurodegenerative diseases.
Introduction
Parkinson’s disease (PD) suffers from hemodynamic abnormalities, which could be effectively mapped via perfusion imaging approaches with quantification of cerebral blood flow (CBF)1. However, a major concern with the above mentioned findings in patients with PD was inaccurate quantification of CBF (uncorrected-CBF) by conventional ASL (c-ASL) with a single post labeling delay (PLD) due to individual differences in cerebral hemodynamics2. Multi-delay arterial spin labeling (m-ASL) strategy has been developed to optimize the accuracy of CBF quantification and obtain multiple perfusion indices, including arterial transit time (ATT), CBF with ATT correction (corrected-CBF) and cerebral blood volume (CBV)3, 4.The feasibility of m-ASL technique has been validated in cerebrovascular diseases5, but few studies have been performed in PD. Hence, we aimed to investigate whether m-ASL with the derived metrics of corrected-CBF as well as ATT and CBV can systematically evaluate the hemodynamics of patients with PD by comparing with healthy control (HC). We hypothesized that m-ASL is a feasible method to investigate neurodegeneration in PD, complementing other sources of information on regional perfusion alterations, and that greater diagnostic efficacy could be improved by taking more perfusion information into account than by using c-ASL alone.
Materials and Methods
Subjects47 (29 male and 18 female) patients with PD, and 50 (28 male and 22 female) matched HC subjects were recruited. The Mini-Mental State Examination was assessed the global cognitive function of all subjects. The Unified Parkinson’s Disease Rating Scale part III and Hoehn-Yahr scale were scored for disease severity and stage of PD.
MRI experiment
MRI experiments were performed using a 3.0-tesla MRI scanner (Discovery MR750, GE, USA) with an 8-channel head coil. M-ASL sequence was acquired with scan parameters shown as follows: labeling duration, (220, 260, 300, 370, 480, 680, 1180) ms; PLD, (1000, 1220, 1480, 1780, 2150, 2630, 3320) ms; TR, 6019 ms; TE, 11.4 ms; FOV, 220×220 mm2; arms, 4; points, 640; 4.5 mm without gap; scan duration, 4 min 3 s.
Perfusion data were preprocessed in SPM 12 embedded in the MATLAB 2018a platform. First, motion correction was performed to exclude translation and rotation greater than 3 mm and 3°, respectively. Co-registration between ASL imaging and T1-weighted imaging with a resampling voxel size of 3×3×3 mm3. Standardization was conducted by subtracting the global mean and dividing by the standard deviation. Finally, the standardized perfusion images were spatially smoothed with a 6 mm× 6 mm× 6 mm full width at half maximum Gaussian kernel.
Statistical analysis
A paired t test was utilized to compare the difference between uncorrected-CBF and corrected-CBF within each group and a two-sample t test to analyze the intergroup differences in perfusion metrics through a voxel-wise manner using SPM 12 software. Spearman rank correlation was calculated to explore the potential correlations between regional perfusion parameters and scores of clinical assessments. Machine learning (ML) analysis was used to identify the classification performance of perfusion indices in discriminating patients with PD from HC subjects.
Results
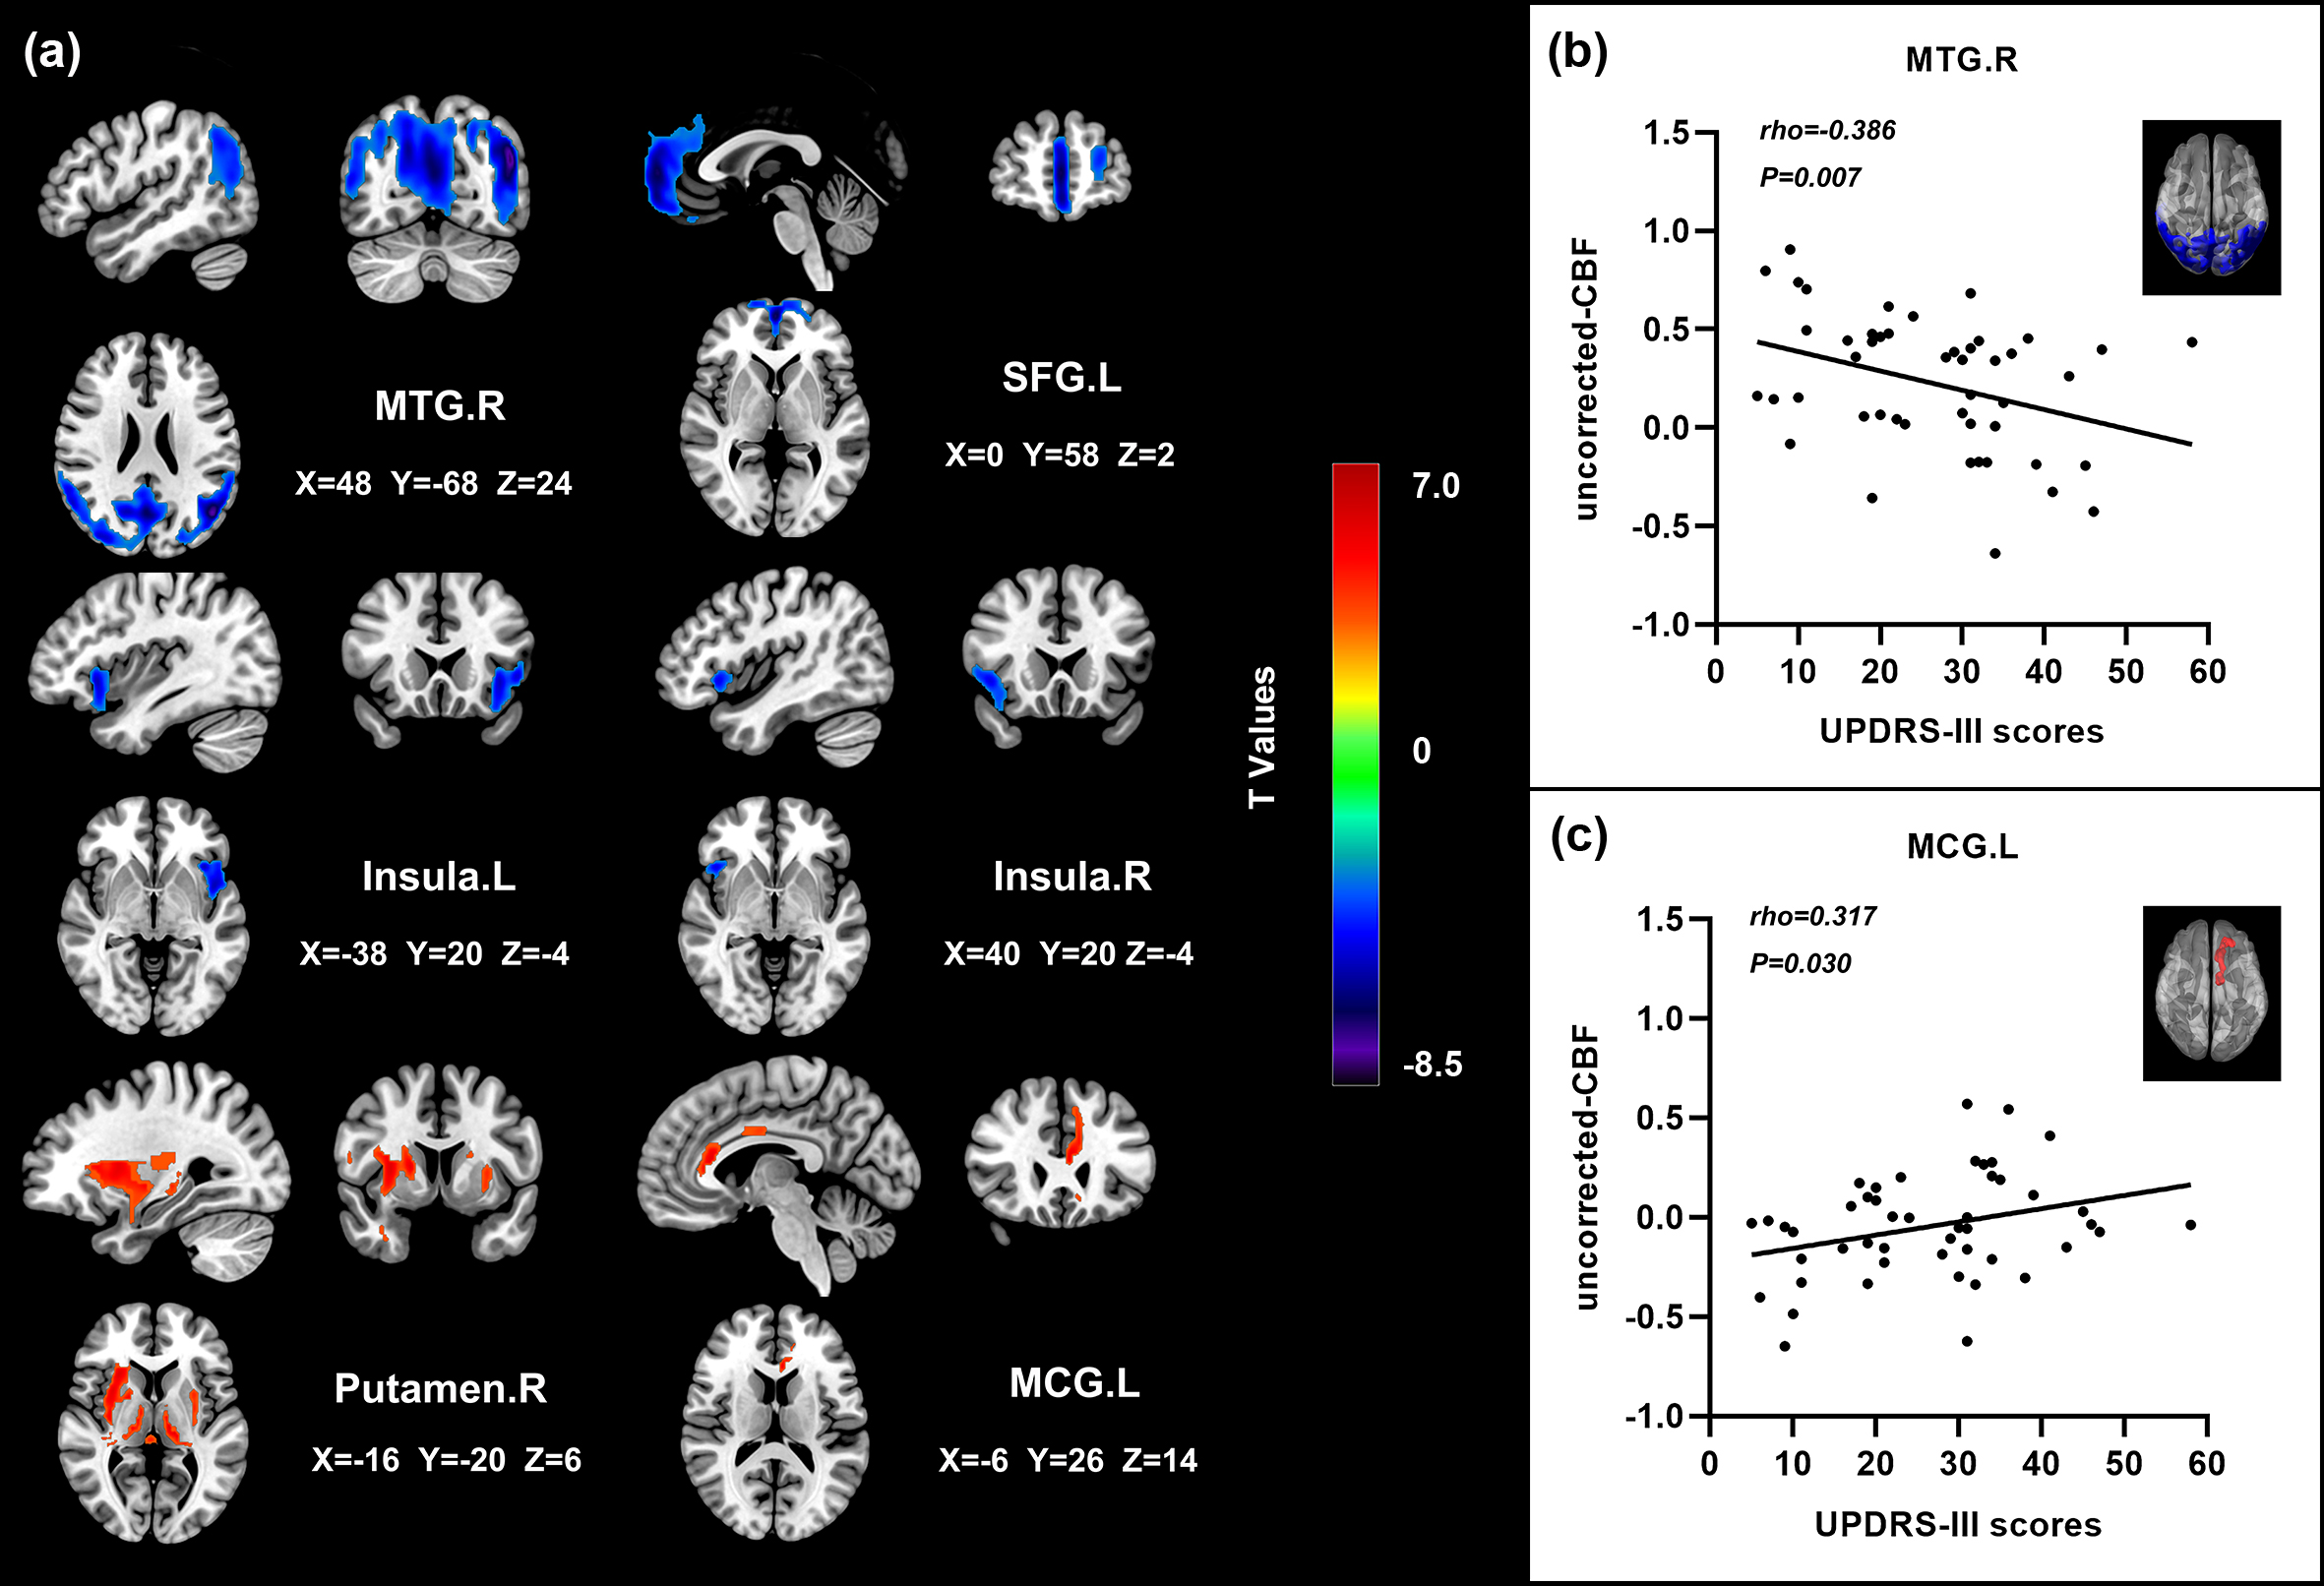
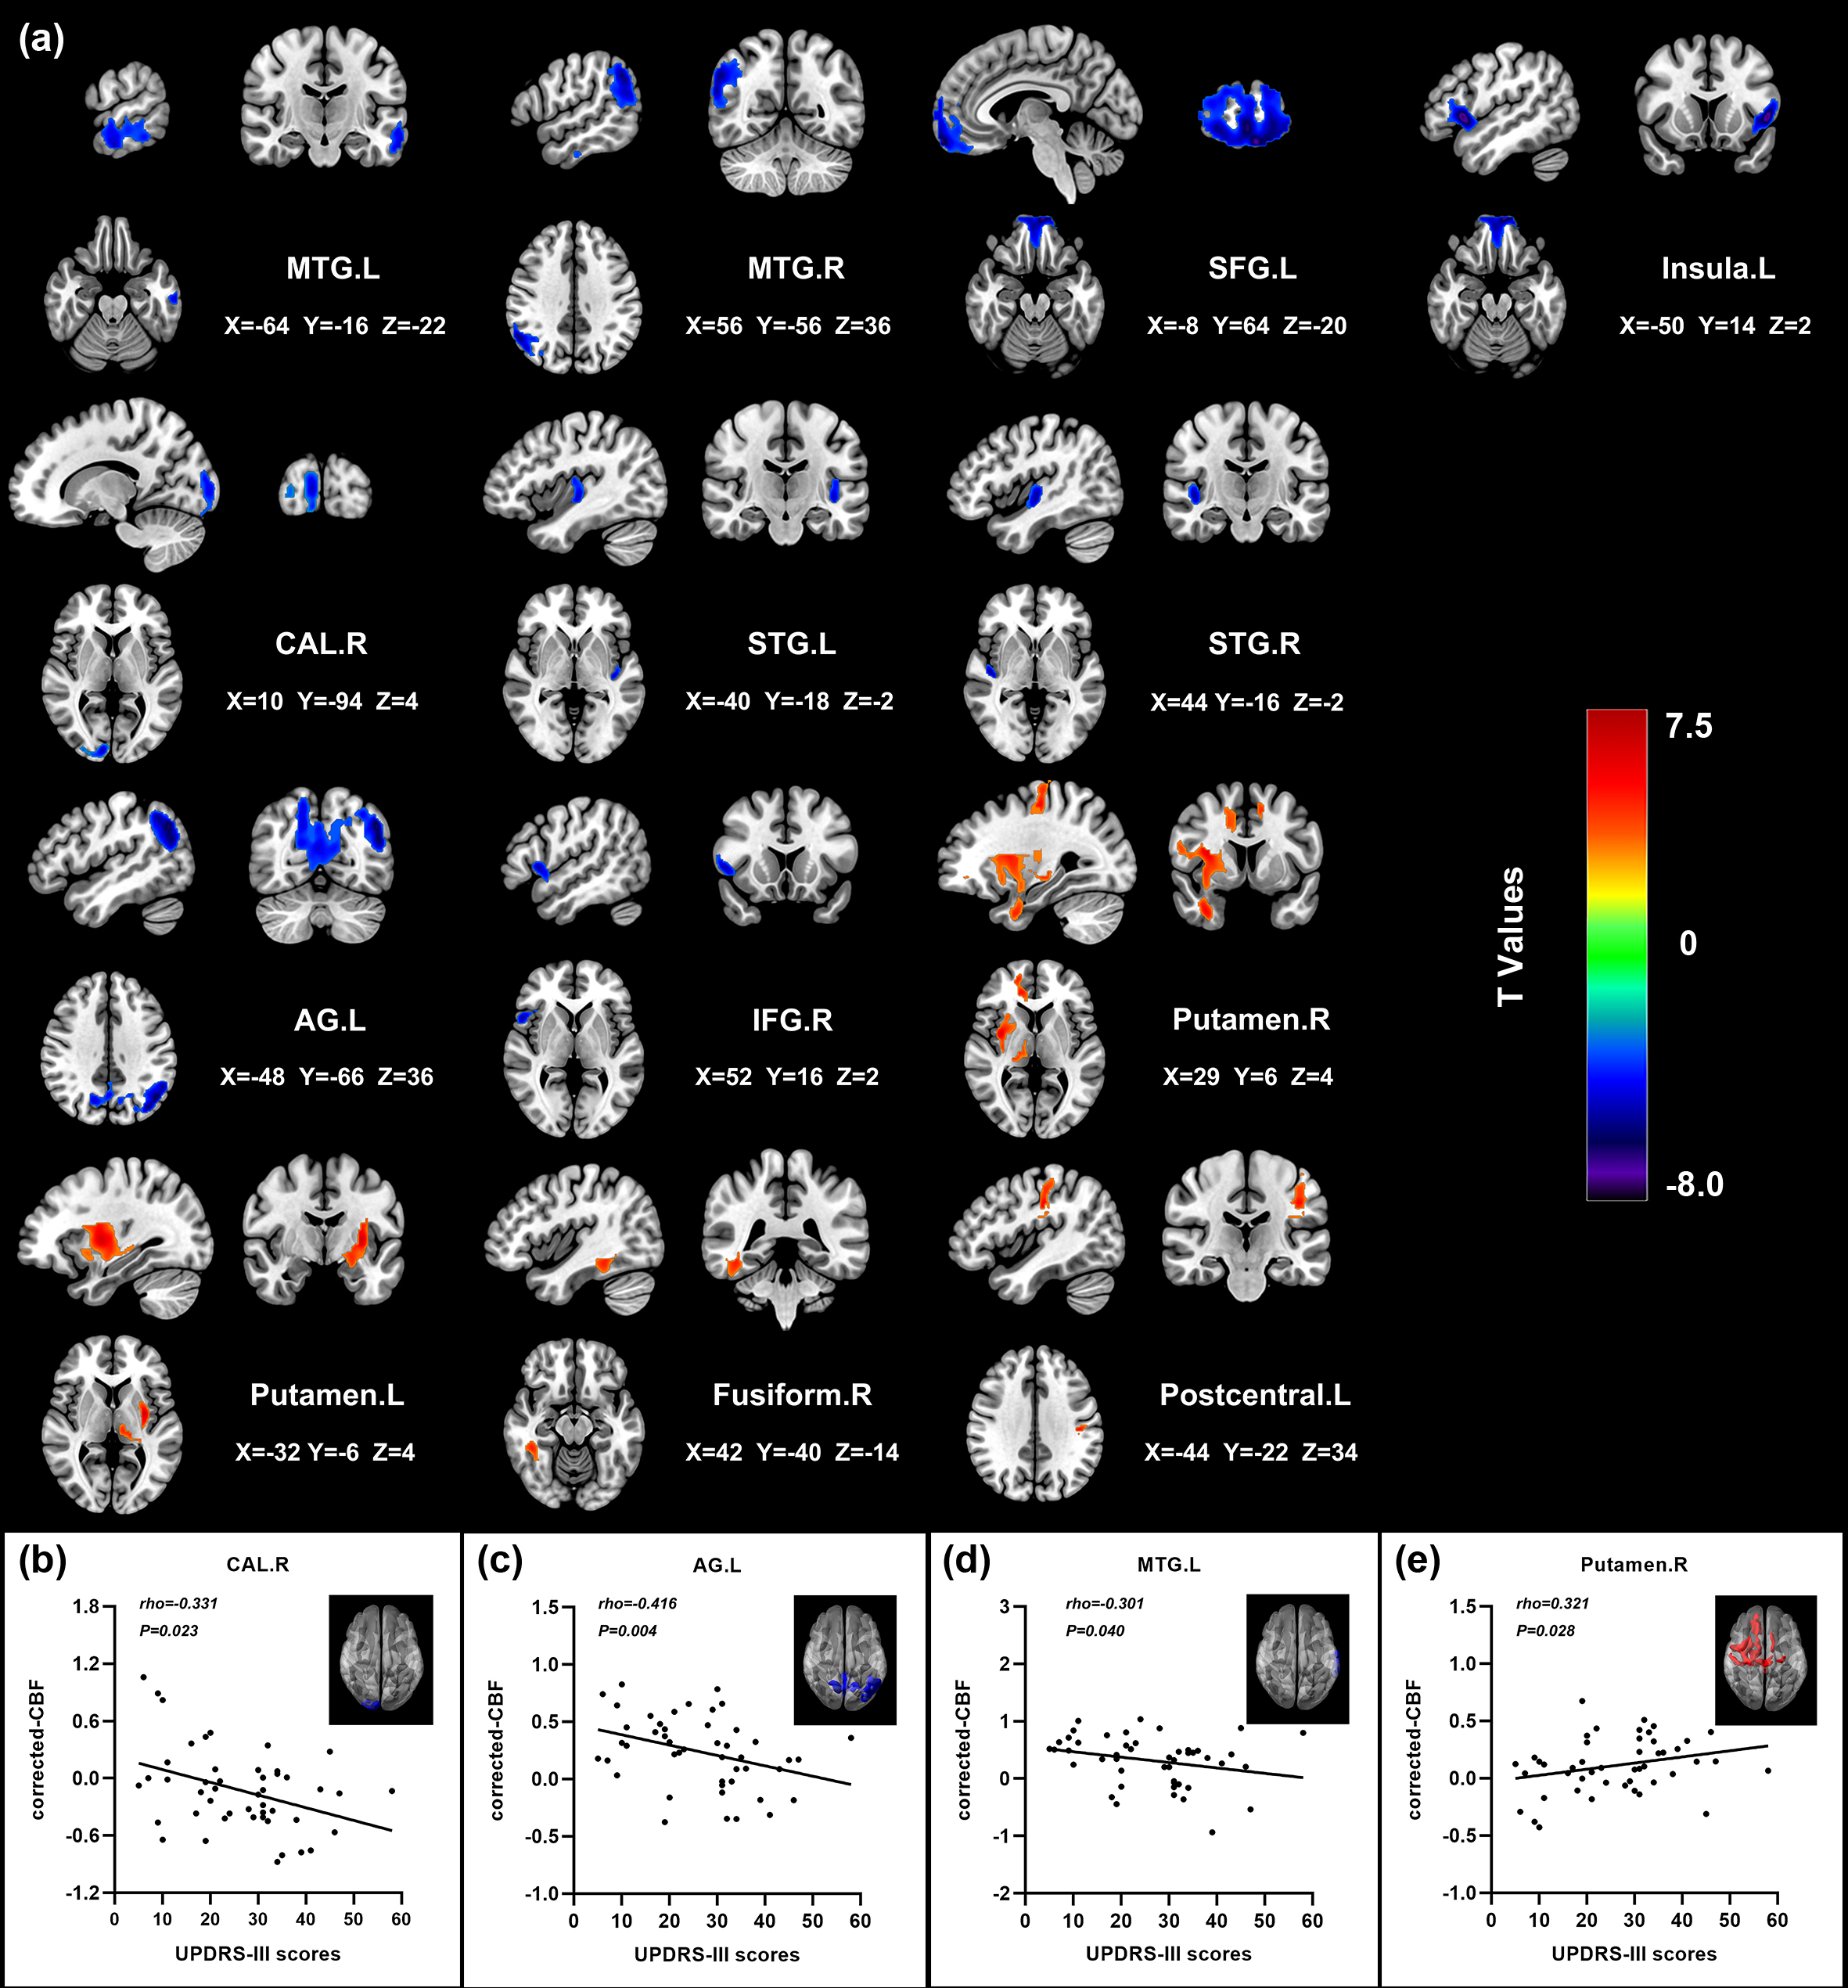
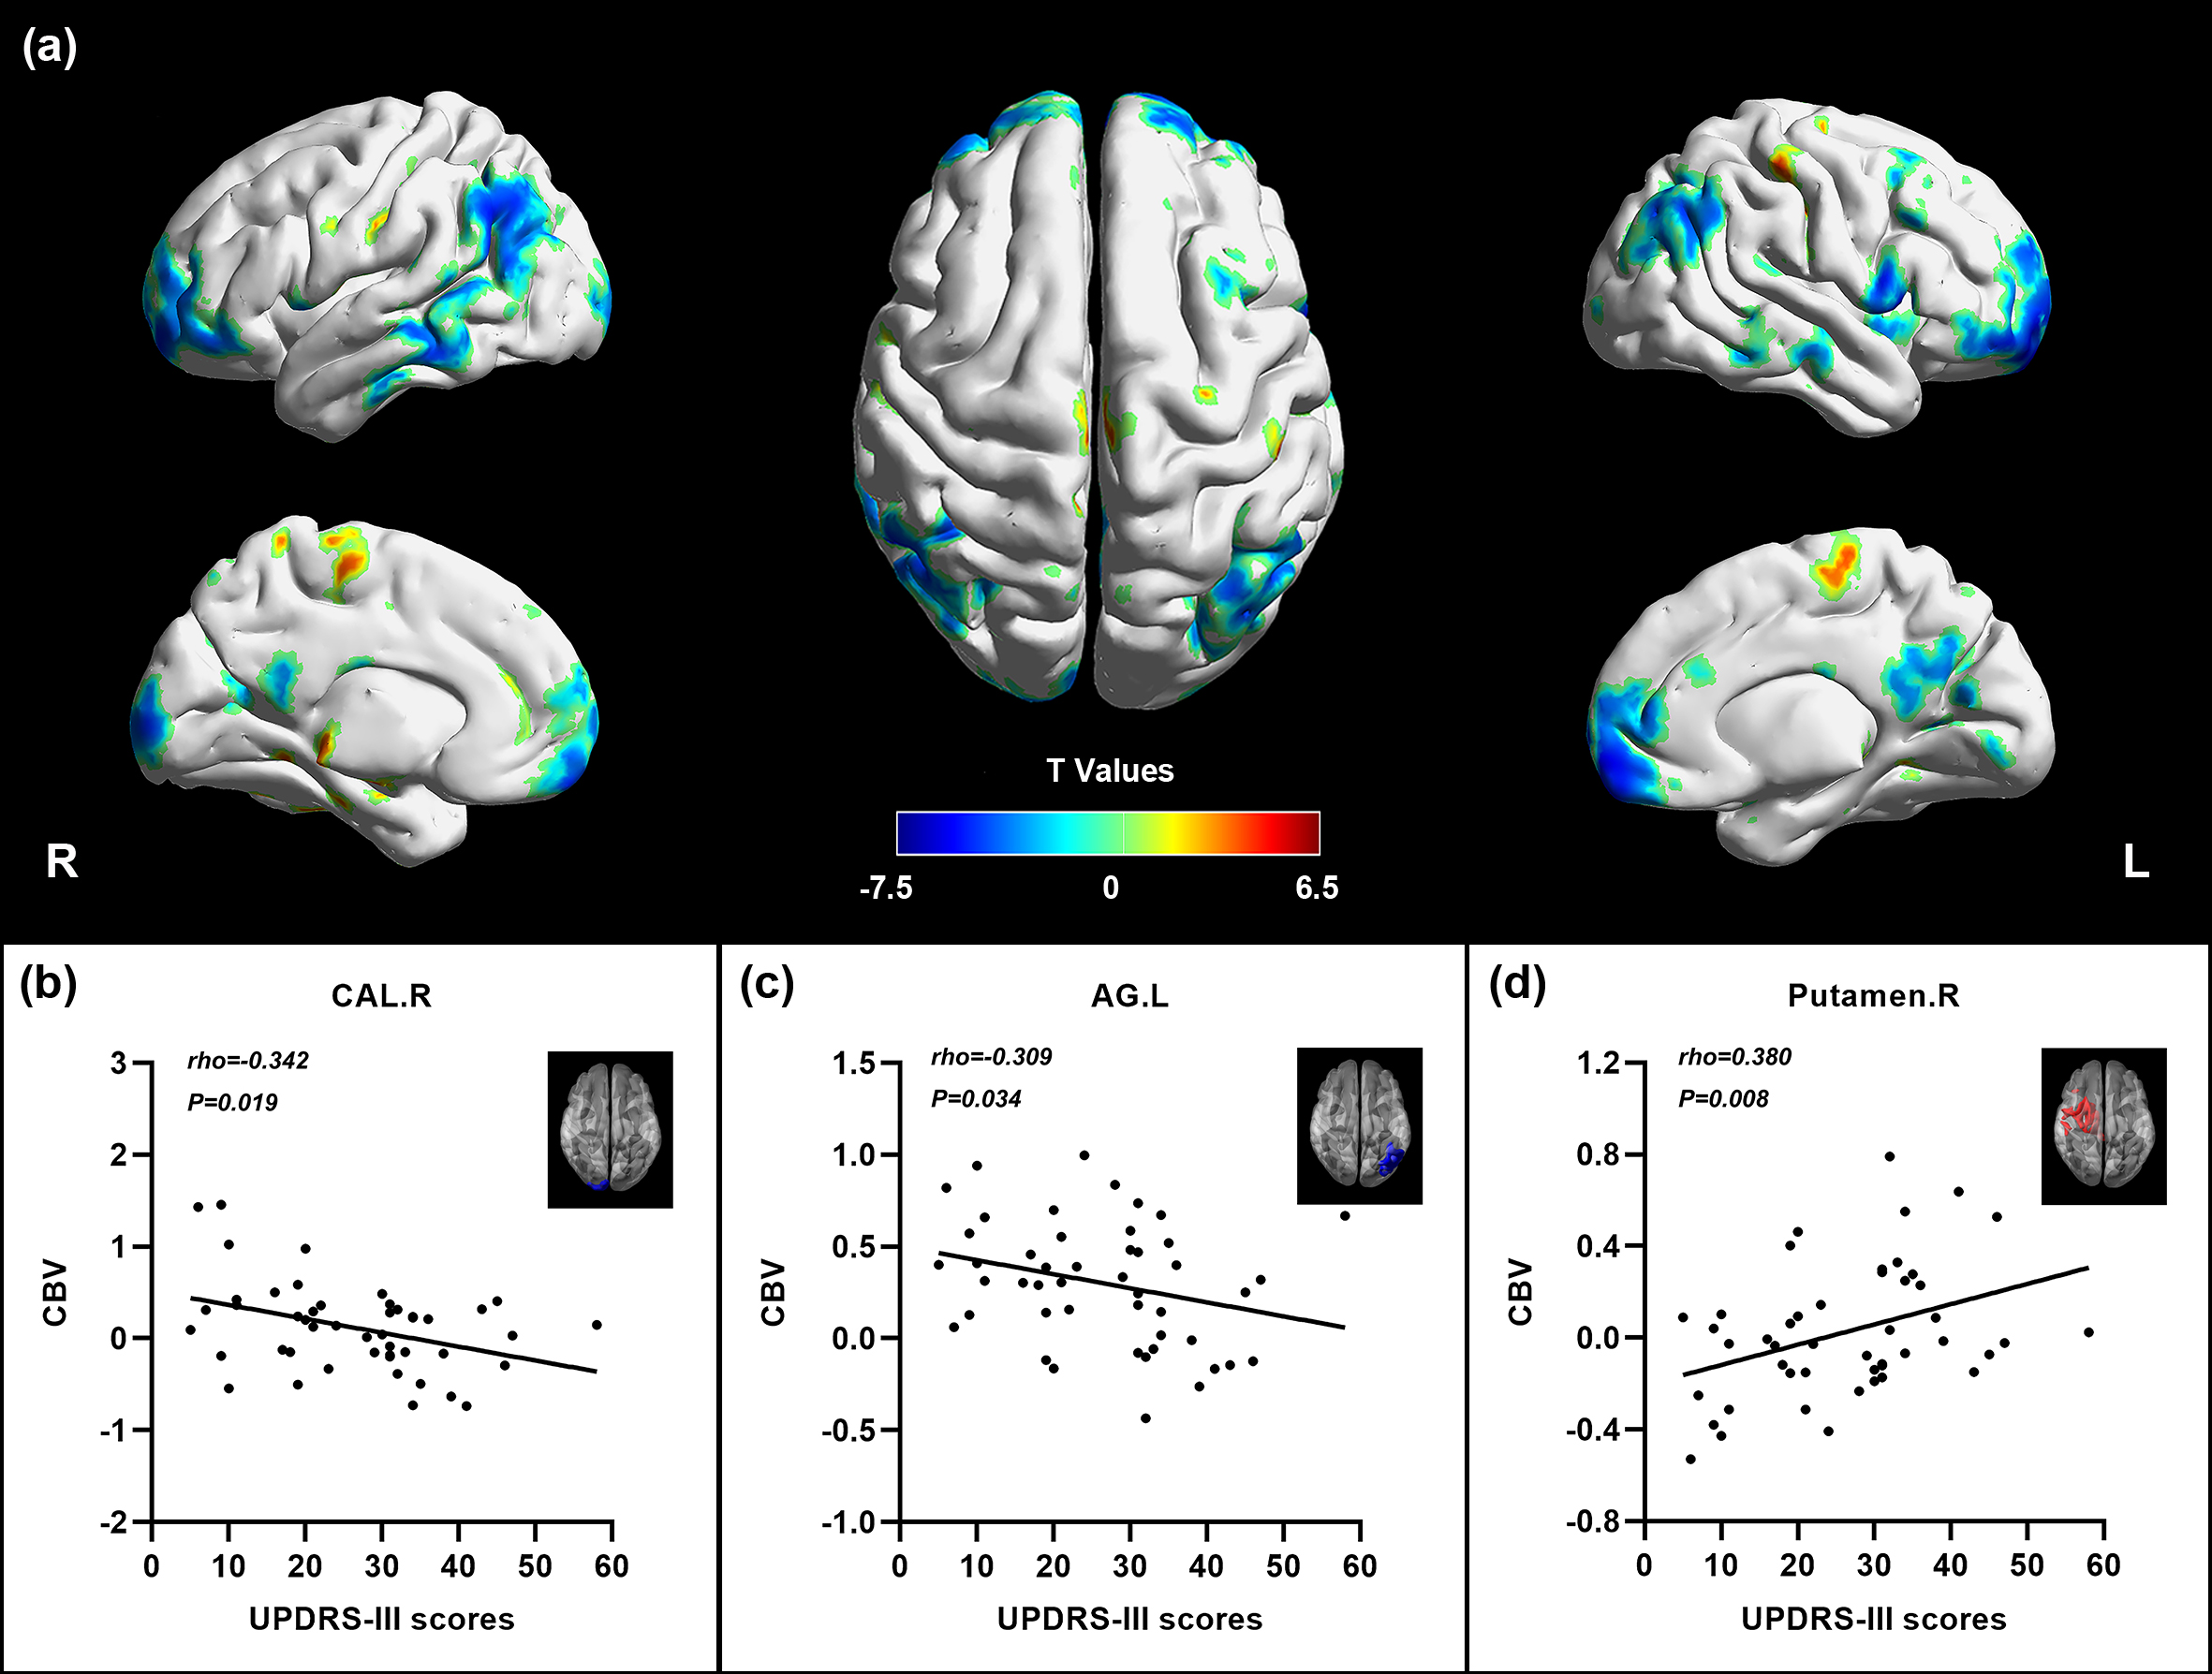
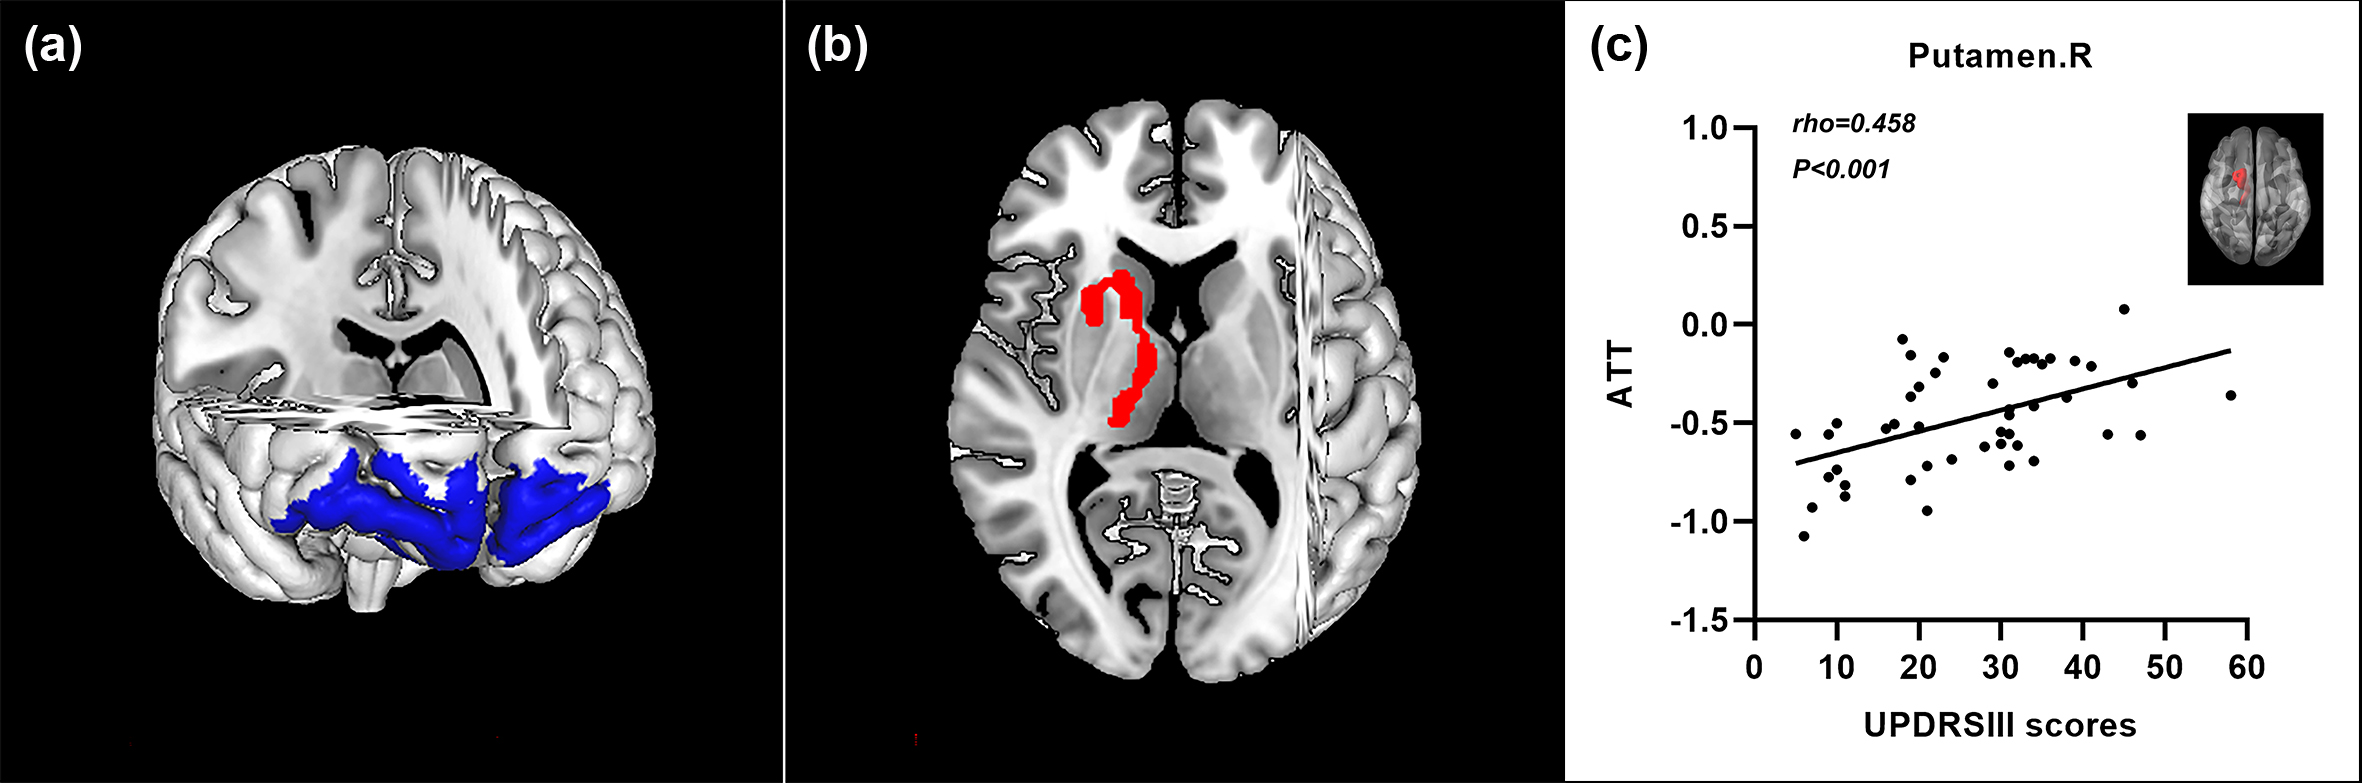
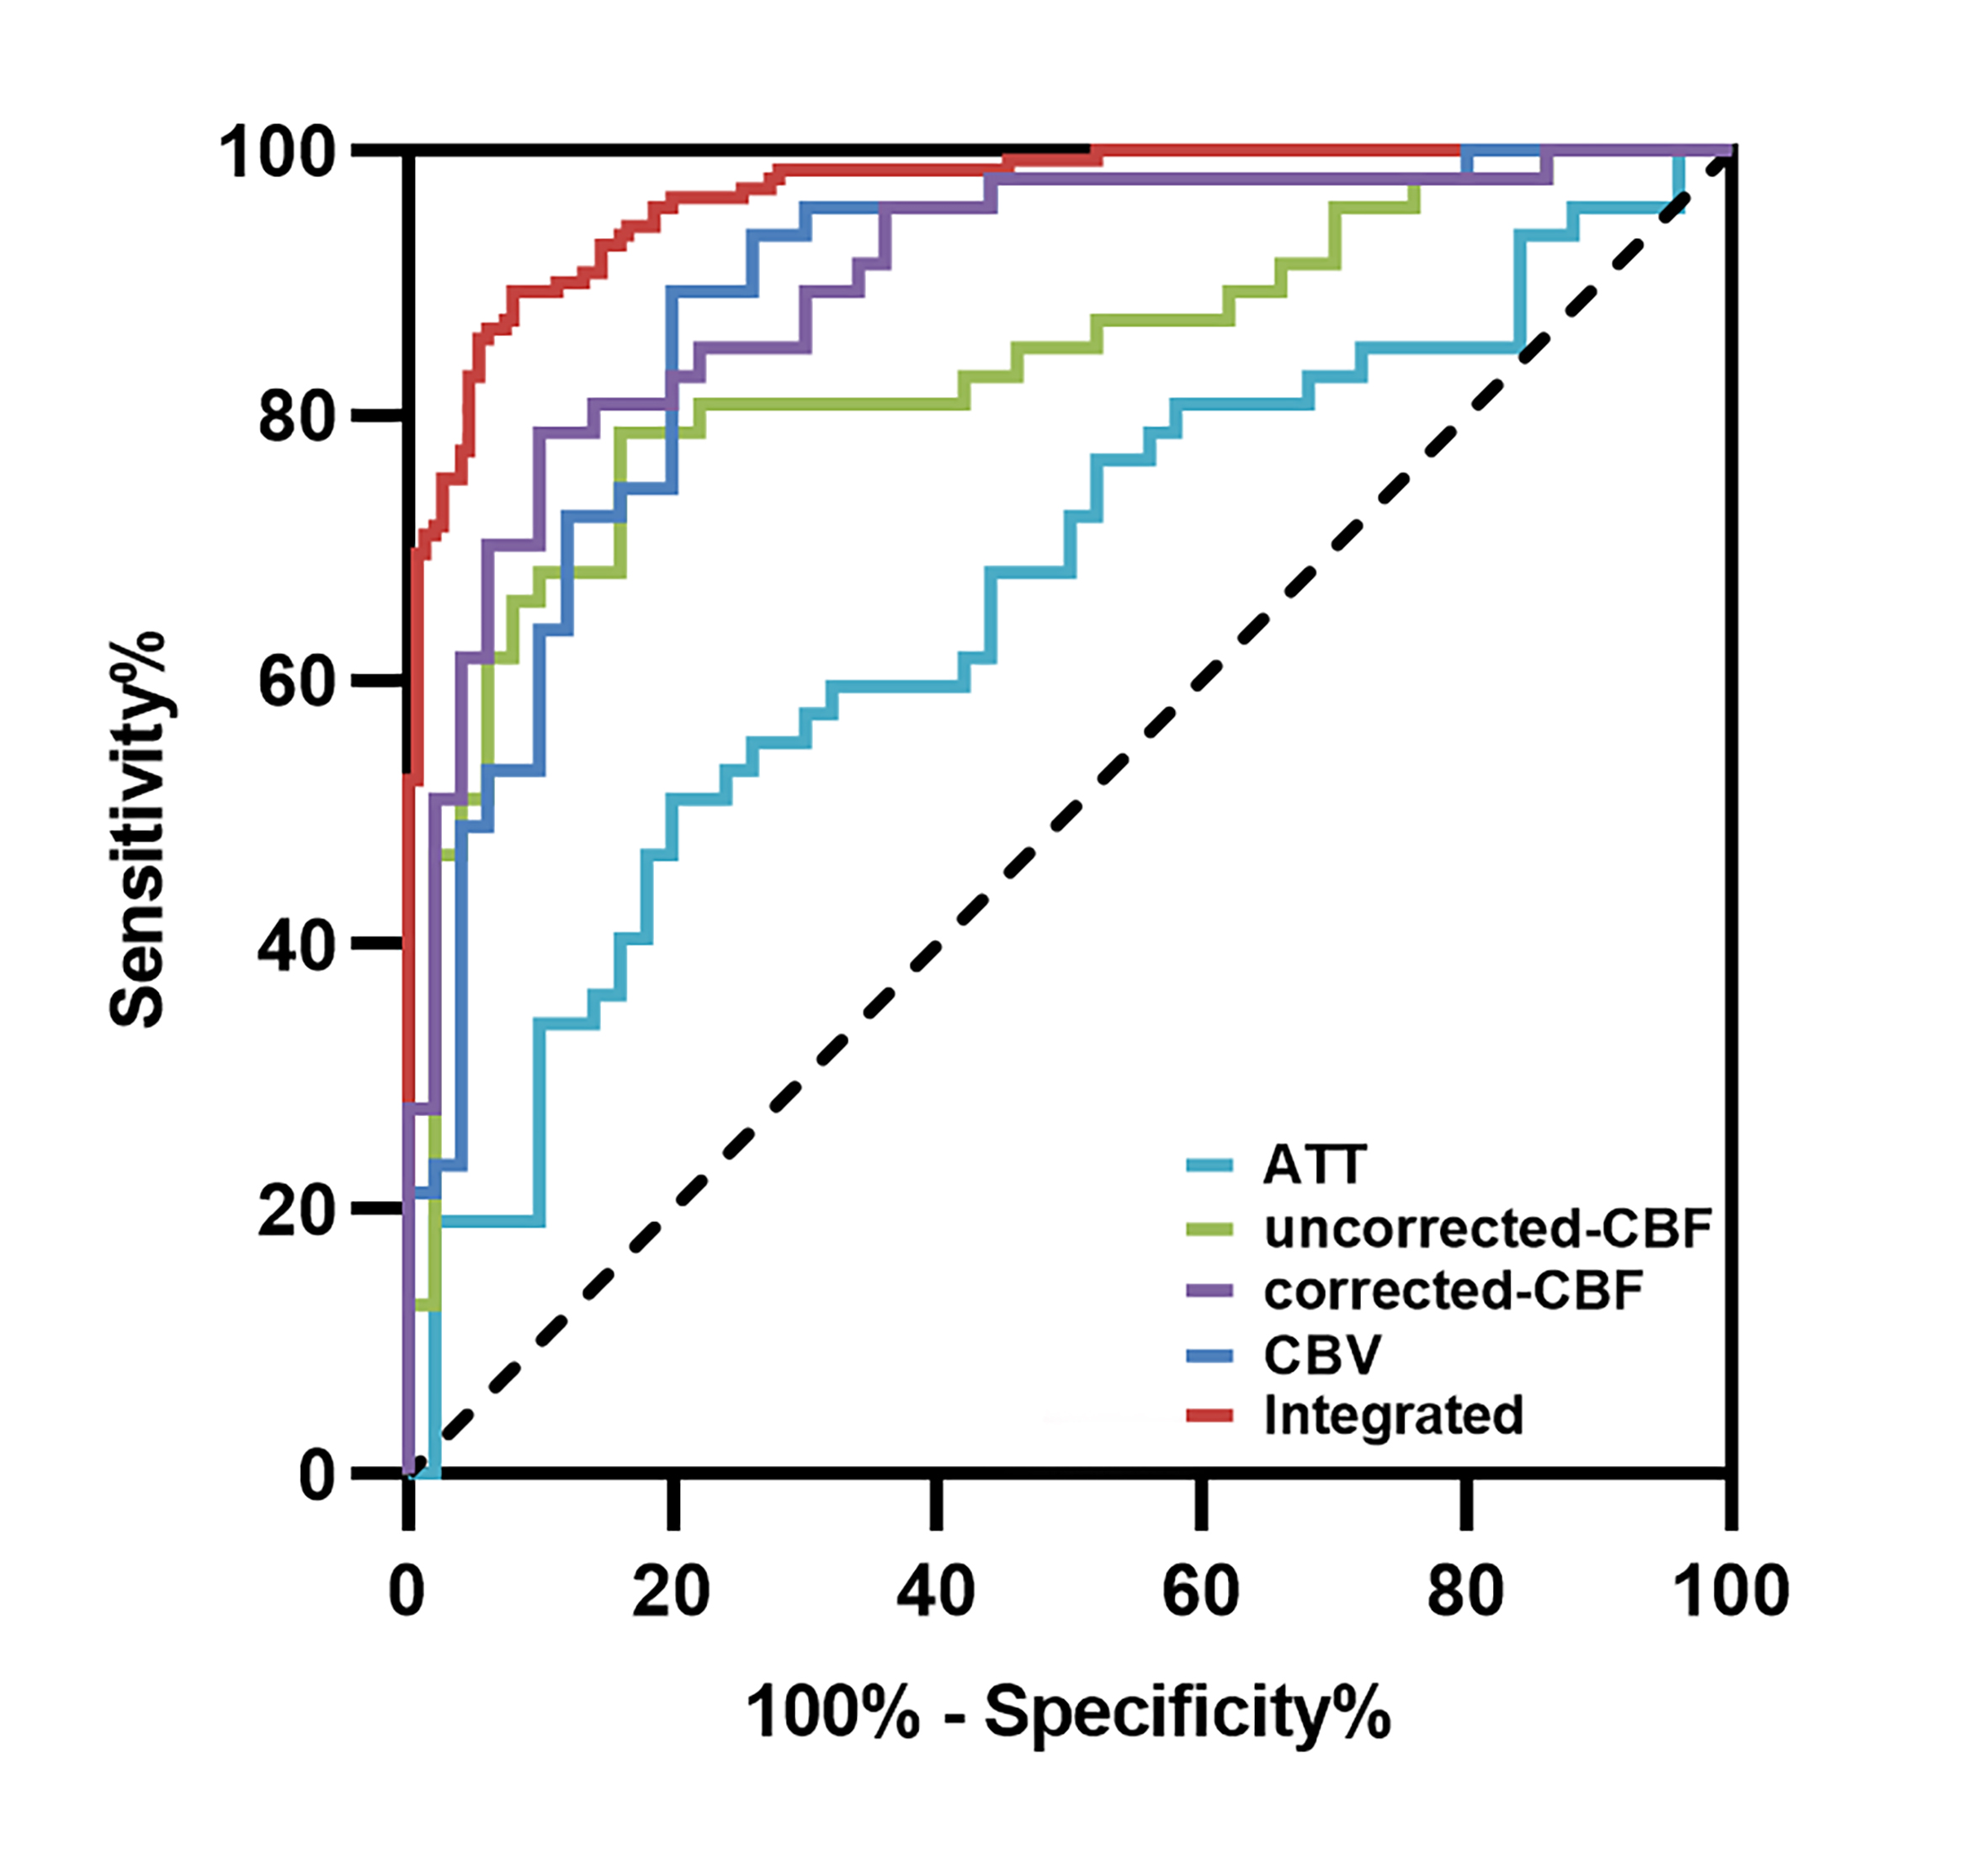
Relative to the uncorrected-CBF map, the corrected-CBF map further refined the distributed brain regions in PD group versus HC group, manifested as the extension of motor-related regions (Figure 1 and 2). Compared to HC group, PD patients had elevated ATT and CBV in the right putamen, a shortened ATT in the superior frontal gyrus, and specific CBV variations in the left precuneus and the right supplementary motor area (Figure 3 and 4). The integration of hemodynamic features from m-ASL provided improved performance (area under the curve 0.97) in PD diagnosis (Figure 5).Discussion
Convergent perfusion alterations that accompany neuronal dysfunction have been proposed as imaging features of PD. In this preliminary study, hemodynamic impairments in patients with PD were comprehensively detected with the superiority of m-ASL. Our findings revealed that m-ASL is capable of visualizing detailed brain regions with abnormal CBF in patients with PD and provides more information on perfusion injury of ATT and CBV than c-ASL, especially in motor-related regions. Moreover, the ML analysis validated that m-ASL could achieve improved diagnostic efficiency using features of corrected-CBF and even optimal classification performance via integrated perfusion features.Conclusion
In conclusion, we comprehensively identified the aberrant pattern of hemodynamics in patients with PD by implementing a m-ASL approach, demonstrating extensive regional disturbances of perfusion characteristics that are responsible for movement disorders. m-ASL is feasible for the investigation of PD with optimized quantification of CBF, detailed information on cerebral blood and improved classification performance. These findings in our study provided complementary insights into the neurodegenerative process and validated the clinical application of m-ASL for the diagnosis of PD.Acknowledgements
NoneReferences
1. Melzer TR, Watts R, MacAskill MR, et al. Arterial spin labelling reveals an abnormal cerebral perfusion pattern in Parkinson's disease. Brain. 2011;134(Pt 3):845-855.
2. Amemiya S, Watanabe Y, Takei N, et al. Arterial Transit Time-Based Multidelay Combination Strategy Improves Arterial Spin Labeling Cerebral Blood Flow Measurement Accuracy in Severe Steno-Occlusive Diseases. J Magn Reson Imaging. 2022;55(1):178-187.
3.van der Thiel M, Rodriguez C, Giannakopoulos P, et al. Brain Perfusion Measurements Using Multidelay Arterial Spin-Labeling Are Systematically Biased by the Number of Delays. AJNR Am J Neuroradiol. 2018;39(8):1432-1438.
4. Cohen AD, Agarwal M, Jagra AS, et al. Longitudinal Reproducibility of MR Perfusion Using 3D Pseudocontinuous Arterial Spin Labeling With Hadamard-Encoded Multiple Postlabeling Delays. J Magn Reson Imaging. 2020;51(6):1846-1853.
5. Luijten SPR, Bos D, van Doormaal PJ, et al. Cerebral blood flow quantification with multi-delay arterial spin labeling in ischemic stroke and the association with early neurological outcome. Neuroimage Clin. 2023;37:103340.
Figures