2010
Measuring intra-to-extra-vascular cerebral water-transport in patients with small vessel disease using 3D T2-prepared time-encoded pCASL1Department of Radiology and Nuclear Medicine, Maastricht University Medical Center +, Maastricht, Netherlands, 2Department of Neurology, Maastricht University Medical Center +, Maastricht, Netherlands, 3Department of Radiology, C.J. Gorter MRI Center, Leiden, Netherlands, 4C.J. Gorter MRI Center, Leiden, Netherlands
Synopsis
Keywords: Arterial Spin Labelling, Arterial spin labelling, cerebral small vessel disease
Motivation: The blood brain barrier (BBB) is damaged in patients with cerebral small vessel disease (cSVD).
Goal(s): To study the role of subtle BBB impairment in cSVD by measuring water-transport over the vessel wall.
Approach: T2-prepared time-encoded pCASL was applied in cerebral small vessel disease (cSVD) patients and healthy controls.
Results: T2 variations between the groups showed no significance in this preliminary sample yet. However, T2-values tend to decay earlier in VCI patients compared to HC. This suggests earlier water-transport from blood to tissue, possibly referring to stronger BBB impairment. Moreover, broader distributions of T2-values seem to indicate larger heterogeneity in the VCI-group.
Impact: This study applied T2-prepared time-encoded pCASL in cerebral small vessel disease (cSVD) patients and healthy controls to study subtle BBB-damage. Although T2-values showed no significant differences yet, the T2-values seem to decay earlier in cSVD, suggesting earlier water-transport into tissue.
Introduction
The clinical standard method to measure subtle blood-brain barrier (BBB) leakage is dynamic contrast-enhanced MRI, which requires invasive administration of a contrast agent1,2. Recently, non-invasive pseudo-continuous (and repeatable) arterial spin labeling (pCASL) methods have been developed to measure subtle BBB impairment for the exchange of water3,4. These methods seek to capture the labeled spins at multiple time points as they travel from an intravascular to an extravascular compartment based on the difference in T2-decay times. This is made possible by gathering ASL signal across several echo times from a multi-echo sequence or by modulating the ASL signal with a T2-preparation prior to the readout5–7. Since water is a smaller molecule than contrast agent particles, it has the potential advantage of providing high sensitivity to detect subtle changes in BBB permeability. Because water crosses the BBB both through passive and active diffusion, this method may additionally be able to provide insight into pathological processes8,9. In this preliminary study, we assessed the feasibility of T2-prepared time-encoded pCASL in patients with cerebral small vessel disease (cSVD). To account for the possible inflow delays in the different arterial flow regions, we additionally assessed the T2 values in the anterior cerebral artery (ACA), anterior middle artery (MCA), and posterior cerebral artery (PCA) territories within the CGM.Methods
Study population: Eight patients with cSVD (6 males; 60-83 years) and seven HC (6 males; 52-77 years) were included. cSVD patients had objective cognitive decline (MoCA<26 or cognitive impairment in at least 1 cognitive domain in neuropsychological assessment), and imaging evidence of vascular cognitive impairment (Fazekas ≥ 2 or Fazekas 1 and lacunar infarcts/microbleeds).Image acquisition: Images were acquired on a 3T clinical MR system (Ingenia, Philips, NL). T2-FLAIR and T1-weighted images were acquired for segmentation of regions of interest (ROI). Two repetitions each with a different post-label-delay(PLD), of a Hadamard-4 time-encoded pCASL sequence 10–13 were acquired (TR/TE = 5000/12 ms) with a T2-Relaxation-Under-Spin-Tagging (TRUST) preparation using four effective echo times: 0, 40, 80, and 160 ms (Figure 1)5–7. Label duration (LD)/PLD combinations were 1961/2389, 1961/2089, 871/1518, 871/1218, 568/950, 568/650 ms. Four background suppression pulses were applied with a 3D segmented GRASE readout (TSE-factor of 25, slice oversampling factor 1.47, SENSE (FH 1, AP 2.2), and acquisition matrix of 64 x 64 (RL x AP), reconstructed to 3.75 x 3.75 x 6.00 mm3). The EPI readout in the phase-encoding direction (AP) was split into 2 segments (15 lines/segment). Scan time was 5:27mins.
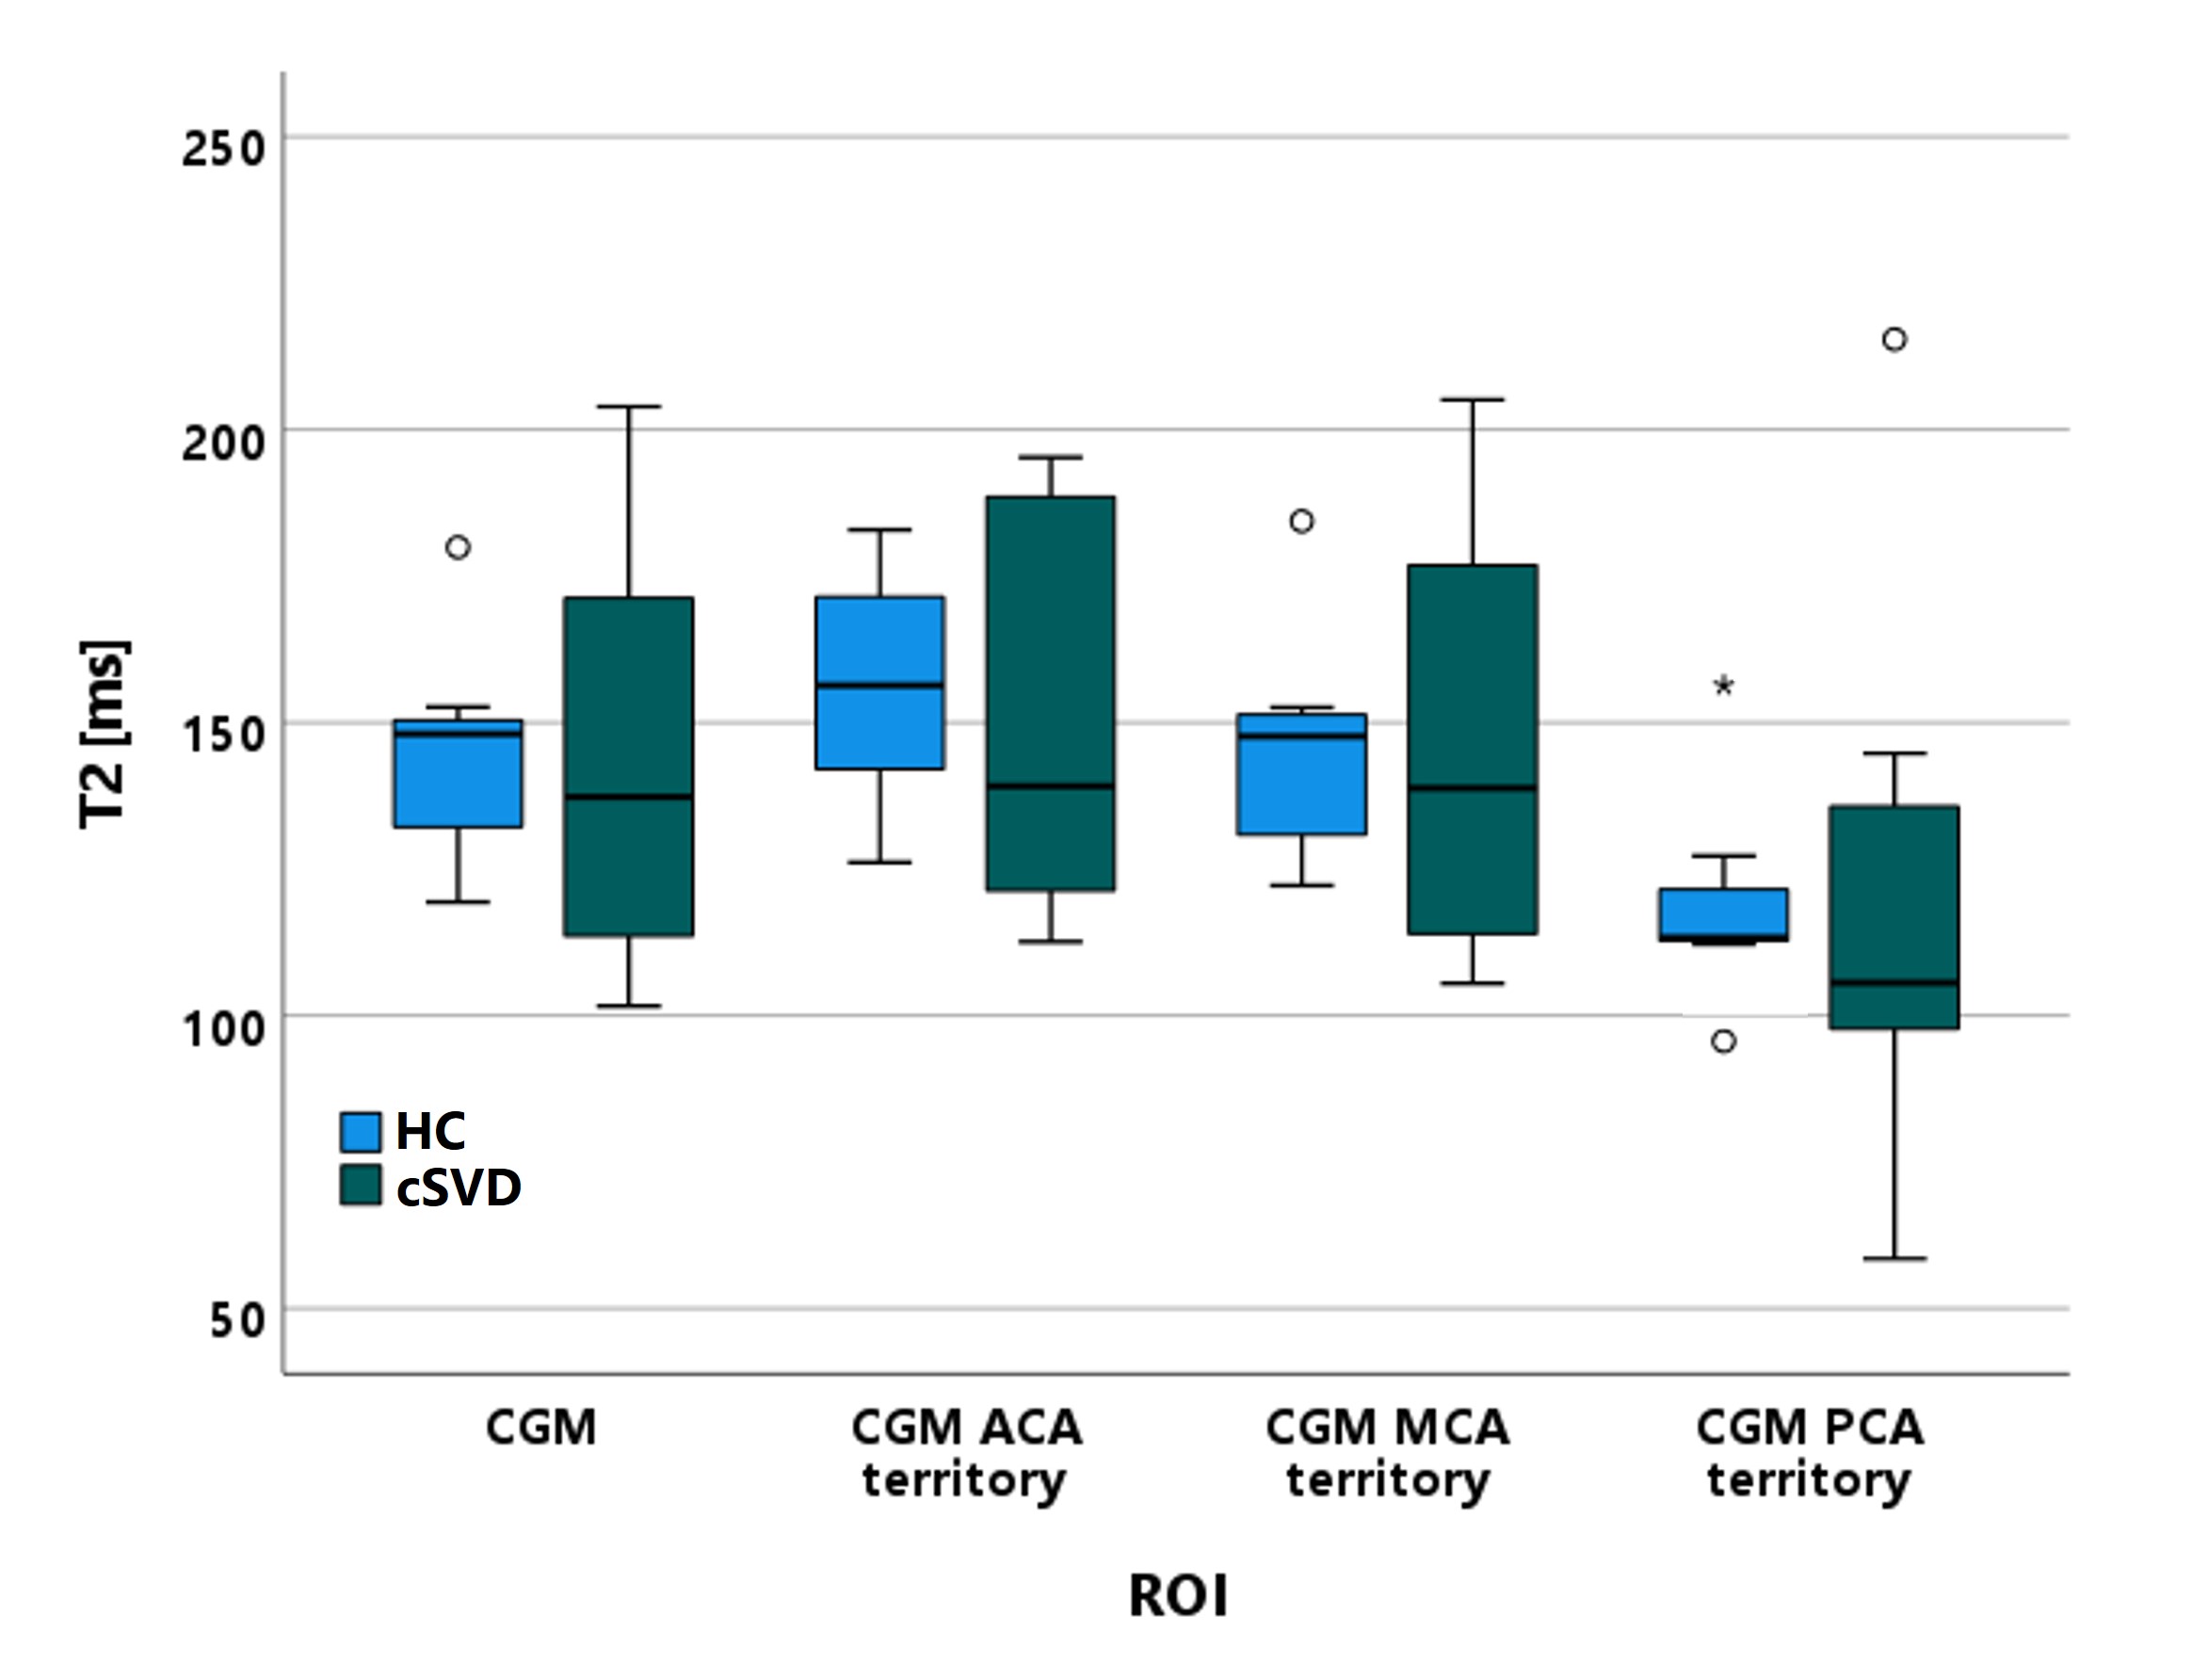
Image analyses: The ASL signal at each PLD was obtained by subtracting images A,B,C,D (Figure 1) according to the Hadamard-4 scheme. Images were spatially smoothed with a 3x3 Gaussian kernel after which a mono-exponential fit was performed voxel wise to obtain T2-maps. Subsequently, the average T2 in CGM was calculated, as well as the average CGM T2 for the ACA, MCA, and PCA flow territories. CGM masks were automatically segmented from the T2-FLAIR and T1-weighted images using the Samseg tool14. For the different arterial flow regions an arterial territory atlas was used15. All masks were registered to the ASL data (FSL flirt). We compared the ROI-averaged T2 measures over the last 2 PLDs between cSVD patients and HC with linear regression, and additionally performed a T2 histogram analysis over the multiple PLDs.
Results
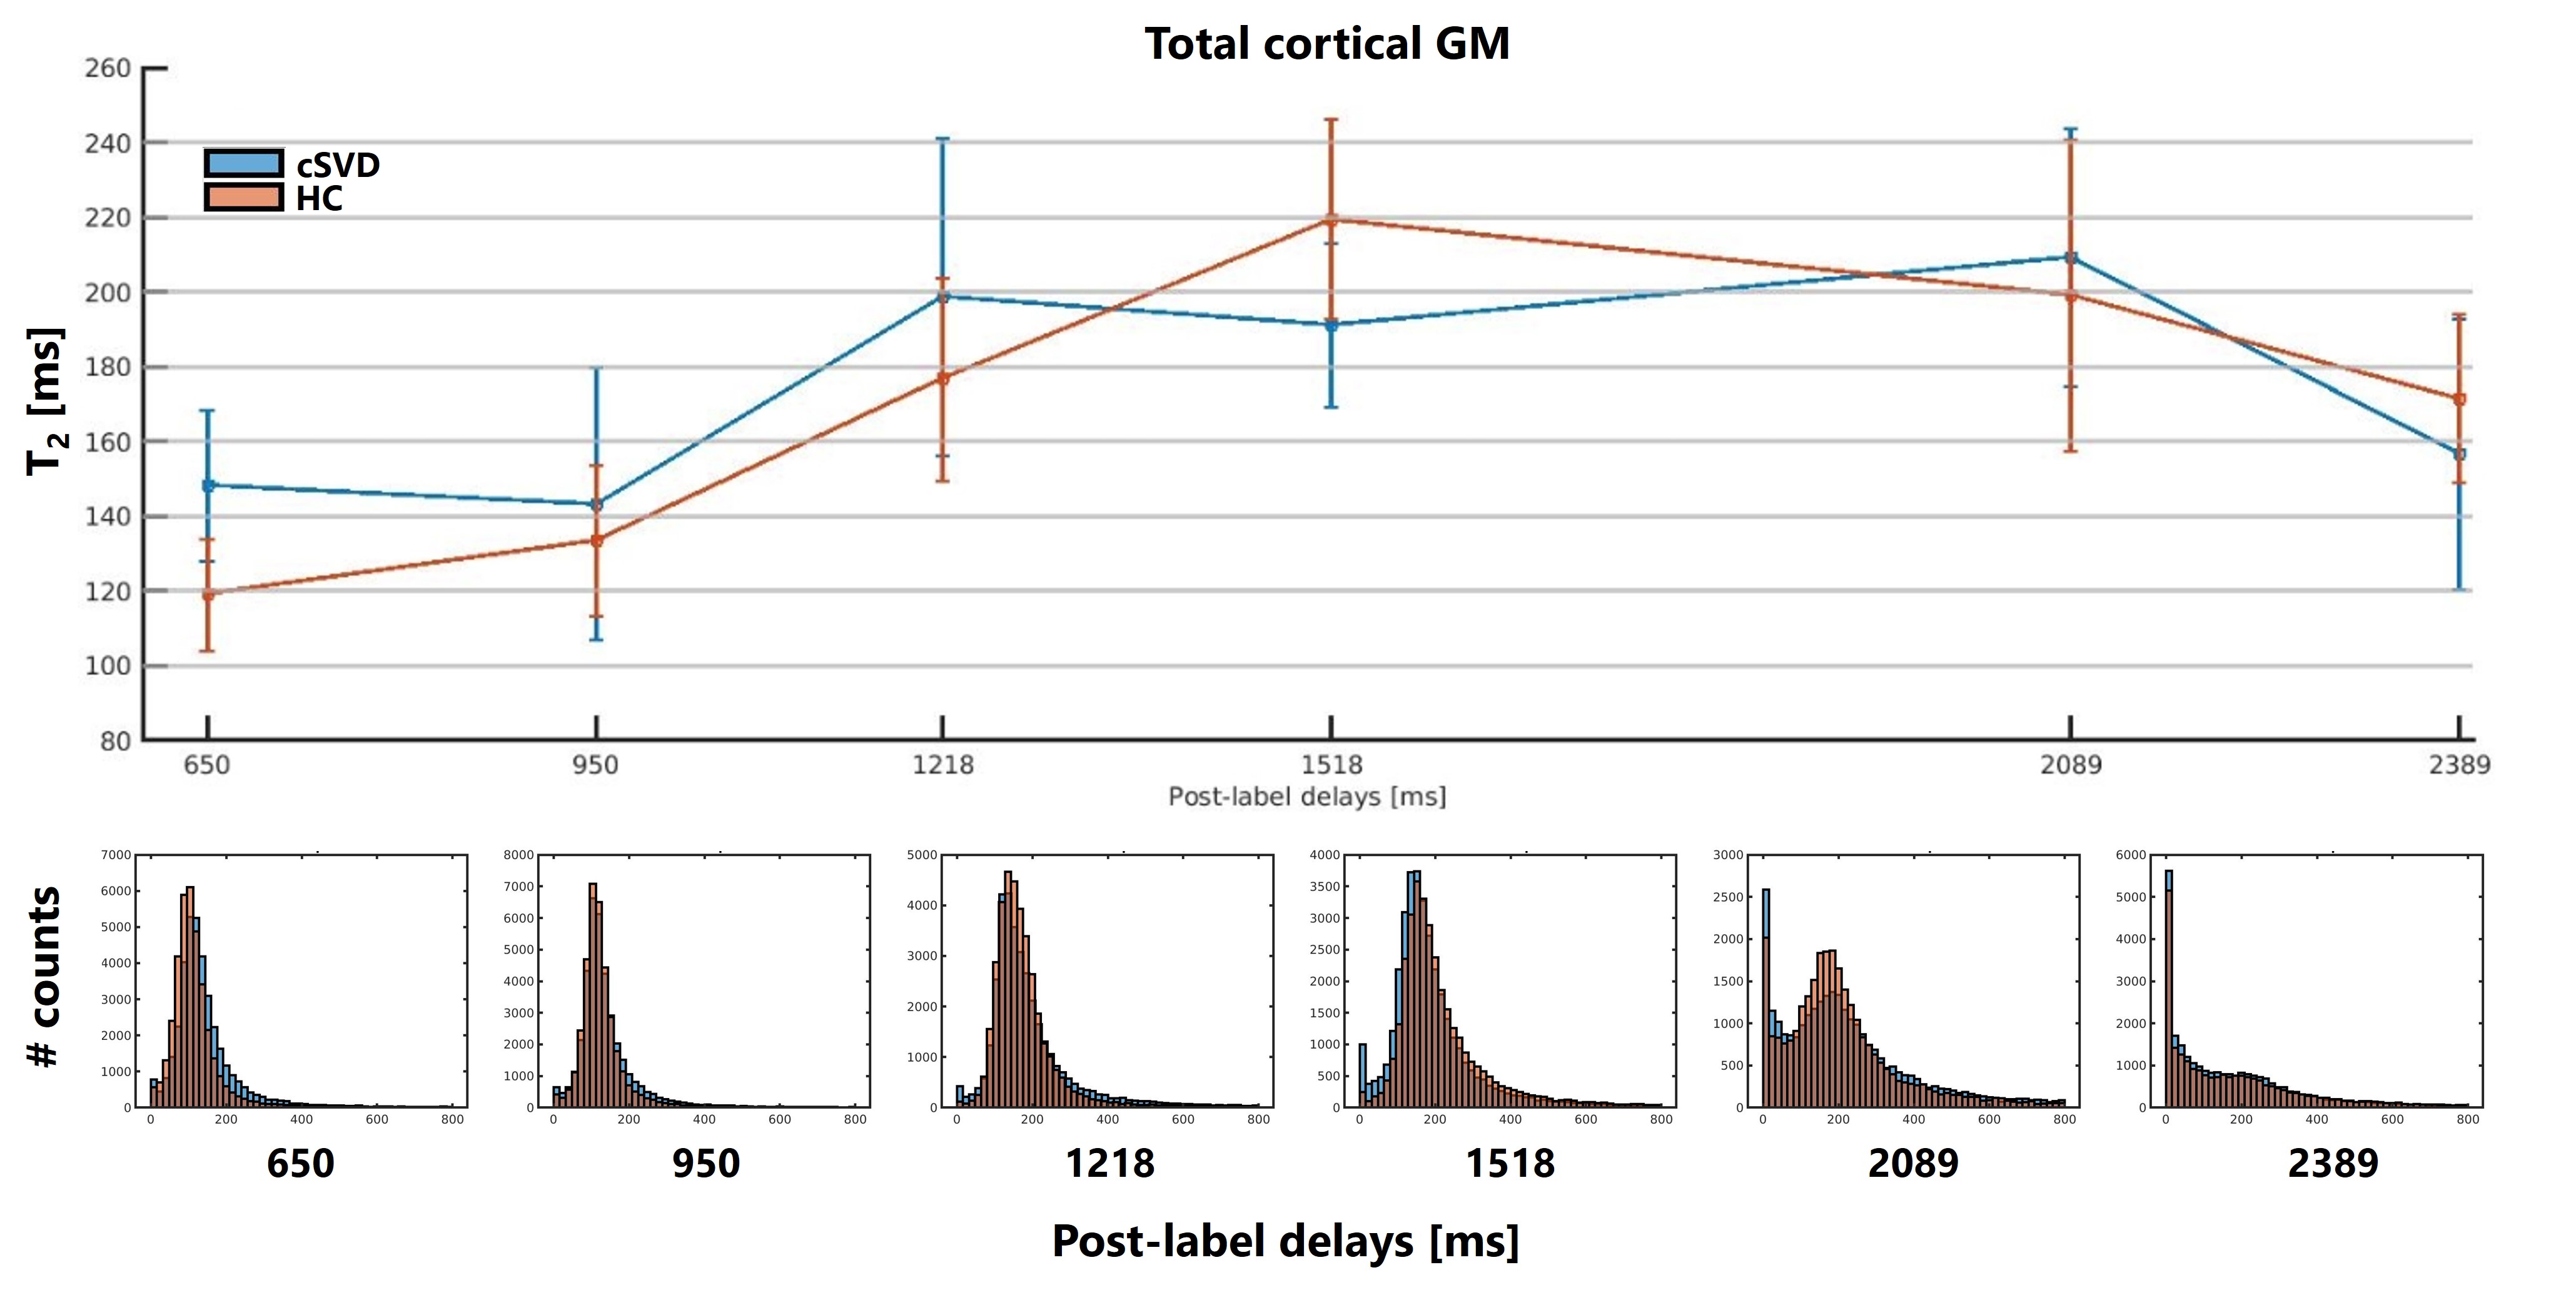
Example te-pCASL and T2-maps are shown in Figure 2, and an overview of the T2-values can be found in Table 1. T2 did not significantly differ between cSVD and HC for any LD/PLD combination (Figure 3). In the T2 histograms differences between cSVD and HC can be observed (Figure 4).Discussion and Conclusion
While no significant variations in T2-values could be measured between cSVD compared to HC in this preliminary sample, the T2 variation over the multiple PLDs seems to show a different behavior. The T2 seems to decrease earlier in cSVD (at PLD=1518 ms) compared to HC (at PLD=2089 ms), suggesting more labeled water to transition earlier into tissue, possibly referring to more subtle BBB leakage. Moreover, the histograms of cSVD-subjects seems more dispersed, which might reflect larger heterogeneity in cSVD. For future studies patient inclusion will continue with two-compartment modelling to separate the blood- and tissue-fractions of the T2-prepared ASL signal as a function of delay time, which will provide another estimate of BBB alongside CBF and ATT in this cohort.Acknowledgements
This work has received funding from the European Union’s Horizon 2020 research and innovation program ‘CRUCIAL’ (grant number 848109), the Dutch ZONMW organization for the project MODEM (grant number 10510032120006), and is part of the program Translational Research 2 (project number 446002509), funded by ZonMw/Epilepsiefonds. Furthermore, we would like to thank Alexandru Cernicanu (Philips) for his substantial contribution to the successful implementation of a new MRI patch.References
1. Haar HJ, Jansen JFA, Jeukens CRLPN, et al. Subtle blood‐brain barrier leakage rate and spatial extent: Considerations for dynamic contrast‐enhanced MRI. Med Phys. 2017;44(8):4112-4125. doi:10.1002/mp.12328
2. Heye AK, Culling RD, Valdés Hernández MDC, Thrippleton MJ, Wardlaw JM. Assessment of blood–brain barrier disruption using dynamic contrast-enhanced MRI. A systematic review. NeuroImage Clin. 2014;6:262-274. doi:10.1016/j.nicl.2014.09.002
3. Dickie BR, Parker GJM, Parkes LM. Measuring water exchange across the blood-brain barrier using MRI. Prog Nucl Magn Reson Spectrosc. 2020;116:19-39. doi:10.1016/j.pnmrs.2019.09.002
4. Shao X, Ma SJ, Casey M, D’Orazio L, Ringman JM, Wang DJJ. Mapping water exchange across the blood–brain barrier using 3D diffusion-prepared arterial spin labeled perfusion MRI. Magn Reson Med. 2019;81(5):3065-3079. doi:10.1002/mrm.27632
5. Schmid S, Teeuwisse WM, Lu H, van Osch MJP. Time-efficient determination of spin compartments by time-encoded pCASL T2-relaxation-under-spin-tagging and its application in hemodynamic characterization of the cerebral border zones. Neuroimage. 2015;123:72-79. doi:10.1016/j.neuroimage.2015.08.025
6. Liu P, Uh J, Lu H. Determination of spin compartment in arterial spin labeling MRI. Magn Reson Med. 2011;65(1):120-127. doi:10.1002/mrm.22601
7. Petitclerc L, Schmid S, Hirschler L, van Osch MJP. Combining T 2 measurements and crusher gradients into a single ASL sequence for comparison of the measurement of water transport across the blood–brain barrier. Magn Reson Med. 2021;85(5):2649-2660. doi:10.1002/mrm.28613
8. Mahroo A, Konstandin S, Günther M. Blood–Brain Barrier Permeability to Water Measured Using Multiple Echo Time Arterial Spin Labeling <scp>MRI</scp> in the Aging Human Brain. J Magn Reson Imaging. Published online June 20, 2023:1-14. doi:10.1002/jmri.28874
9. Dickie BR, Parker GJM, Parkes LM. Measuring water exchange across the blood-brain barrier using MRI. Prog Nucl Magn Reson Spectrosc. 2020;116:19-39. doi:10.1016/j.pnmrs.2019.09.002
10. Woods JG, Chappell MA, Okell TW. Designing and comparing optimized pseudo-continuous Arterial Spin Labeling protocols for measurement of cerebral blood flow. Neuroimage. 2020;223(August):117246. doi:10.1016/j.neuroimage.2020.117246
11. Wells JA, Lythgoe MF, Gadian DG, Ordidge RJ, Thomas DL. In vivo hadamard encoded continuous arterial spin labeling (H-CASL). Magn Reson Med. 2010;63(4):1111-1118. doi:10.1002/mrm.22266
12. Teeuwisse WM, Schmid S, Ghariq E, Veer IM, van Osch MJP. Time‐encoded pseudocontinuous arterial spin labeling: Basic properties and timing strategies for human applications. Magn Reson Med. 2014;72(6):1712-1722. doi:10.1002/mrm.25083
13. Günther M. Highly efficient accelerated acquisition of perfusion inflow series by Cycled Arterial Spin Labeling. Proc Intl Soc Mag Reson Med 15. 2007;15:380.
14. Cerri S, Puonti O, Meier DS, et al. A contrast-adaptive method for simultaneous whole-brain and lesion segmentation in multiple sclerosis. Neuroimage. 2021;225:117471. doi:10.1016/j.neuroimage.2020.117471
15. Liu C-F, Hsu J, Xu X, et al. Digital 3D Brain MRI Arterial Territories Atlas. Sci Data. 2023;10(1):74. doi:10.1038/s41597-022-01923-0
Figures
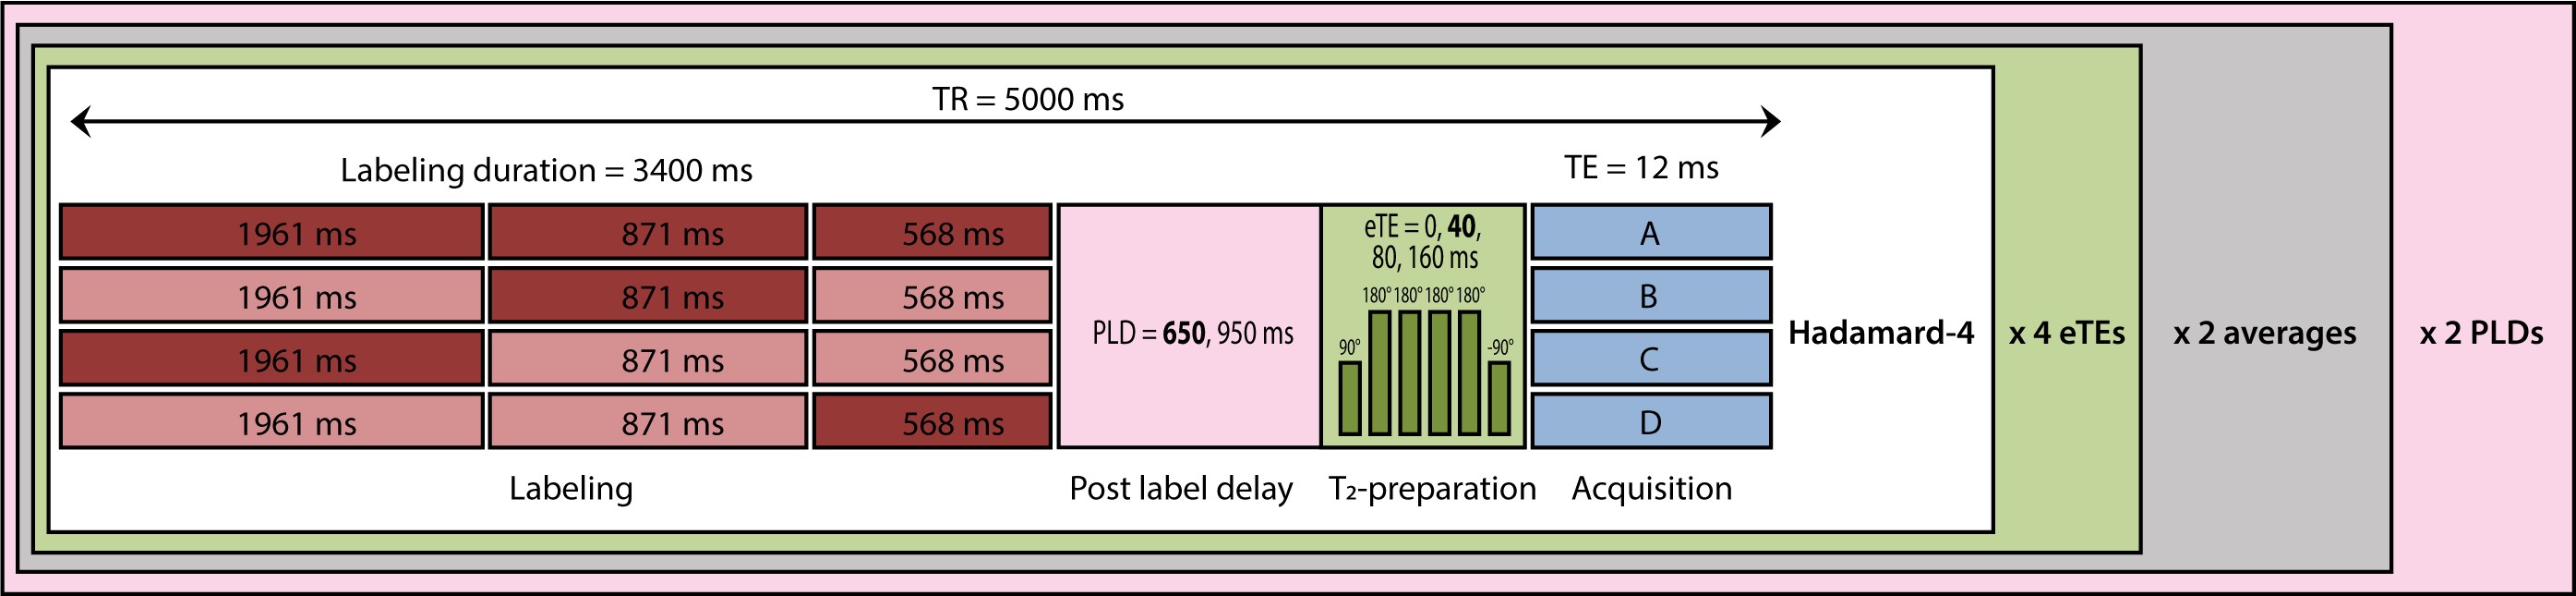
Figure 1: Acquisition scheme for the 3D T2-prepared time-encoded pCASL. A Hadamard-4 matrix with the same block durations but different post-label-delay (PLD), and therefore also different background suppression timings, is used. The Hadamard matrix is applied, followed by the T2-preparation module, and finally the image acquisition (white). The acquisition of different effective TEs (eTEs) are interleaved within the dynamic cycle (green). This was repeated twice to increase SNR (grey box). Subsequently, this whole sequence was performed twice for two different PLDs (pink).
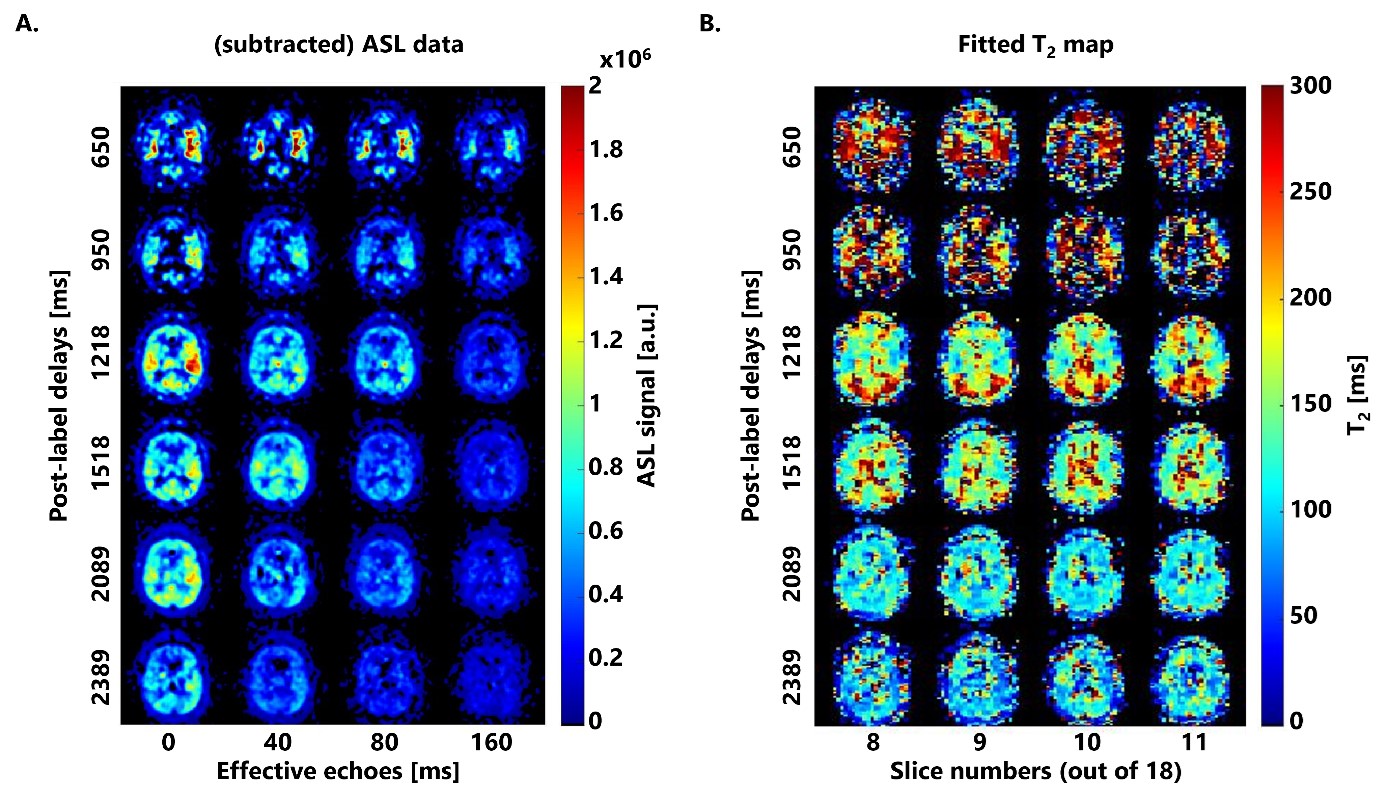
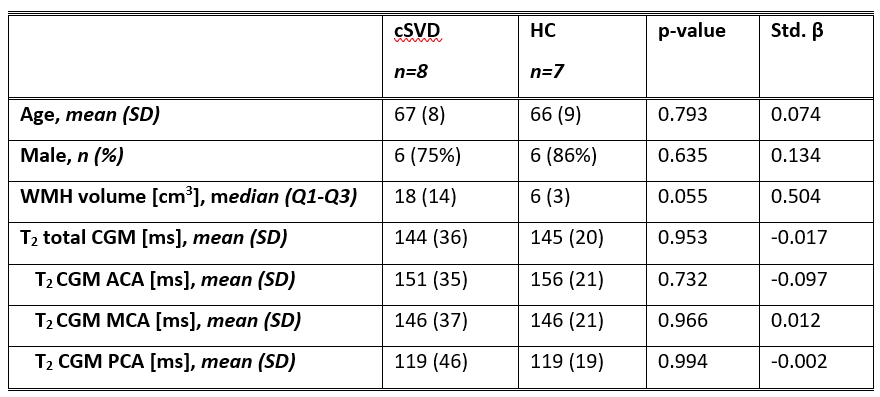
Table 1: Overview of demographics and T2-values averaged over the different ROIs in cerebral small vessel disease (cSVD) patients and healthy controls (HC).
Abbreviations: cSVD: cerebral small vessel disease; HC: healthy controls; WMH: white matter hyperintensities; CGM: cortical gray matter; ACA: Aterior cerebral artery; MCA: Middle cerebral artery; PCA: Posterior cerebral artery;