2003
Optimization of 3D PCASL perfusion SNR efficiency at 7T1NIH/NINDS/LFMI, Bethesda, MD, United States, 2Siemens Medical Solutions USA Inc., Malvern, PA, United States, 3NIH/NINDS/NMRF, Bethesda, MD, United States
Synopsis
Keywords: Arterial Spin Labelling, Perfusion
Motivation: 3D-PCASL is a well-established perfusion MRI technique at 3T. Nonetheless, its effectiveness is hampered by increased RF power deposition at 7T limiting the SNR efficiency and labeling duration.
Goal(s): This work investigates the relationship between gray matter perfusion signal and labeling duration aiming to optimize 3D-PCASL SNR efficiency while taking into consideration the increased RF power constraints of 7T MRI.
Approach: SNR efficiency was measured at various labeling durations maintaining scan time to ~6 min and SAR to ~90% of first-level mode limit at 7T.
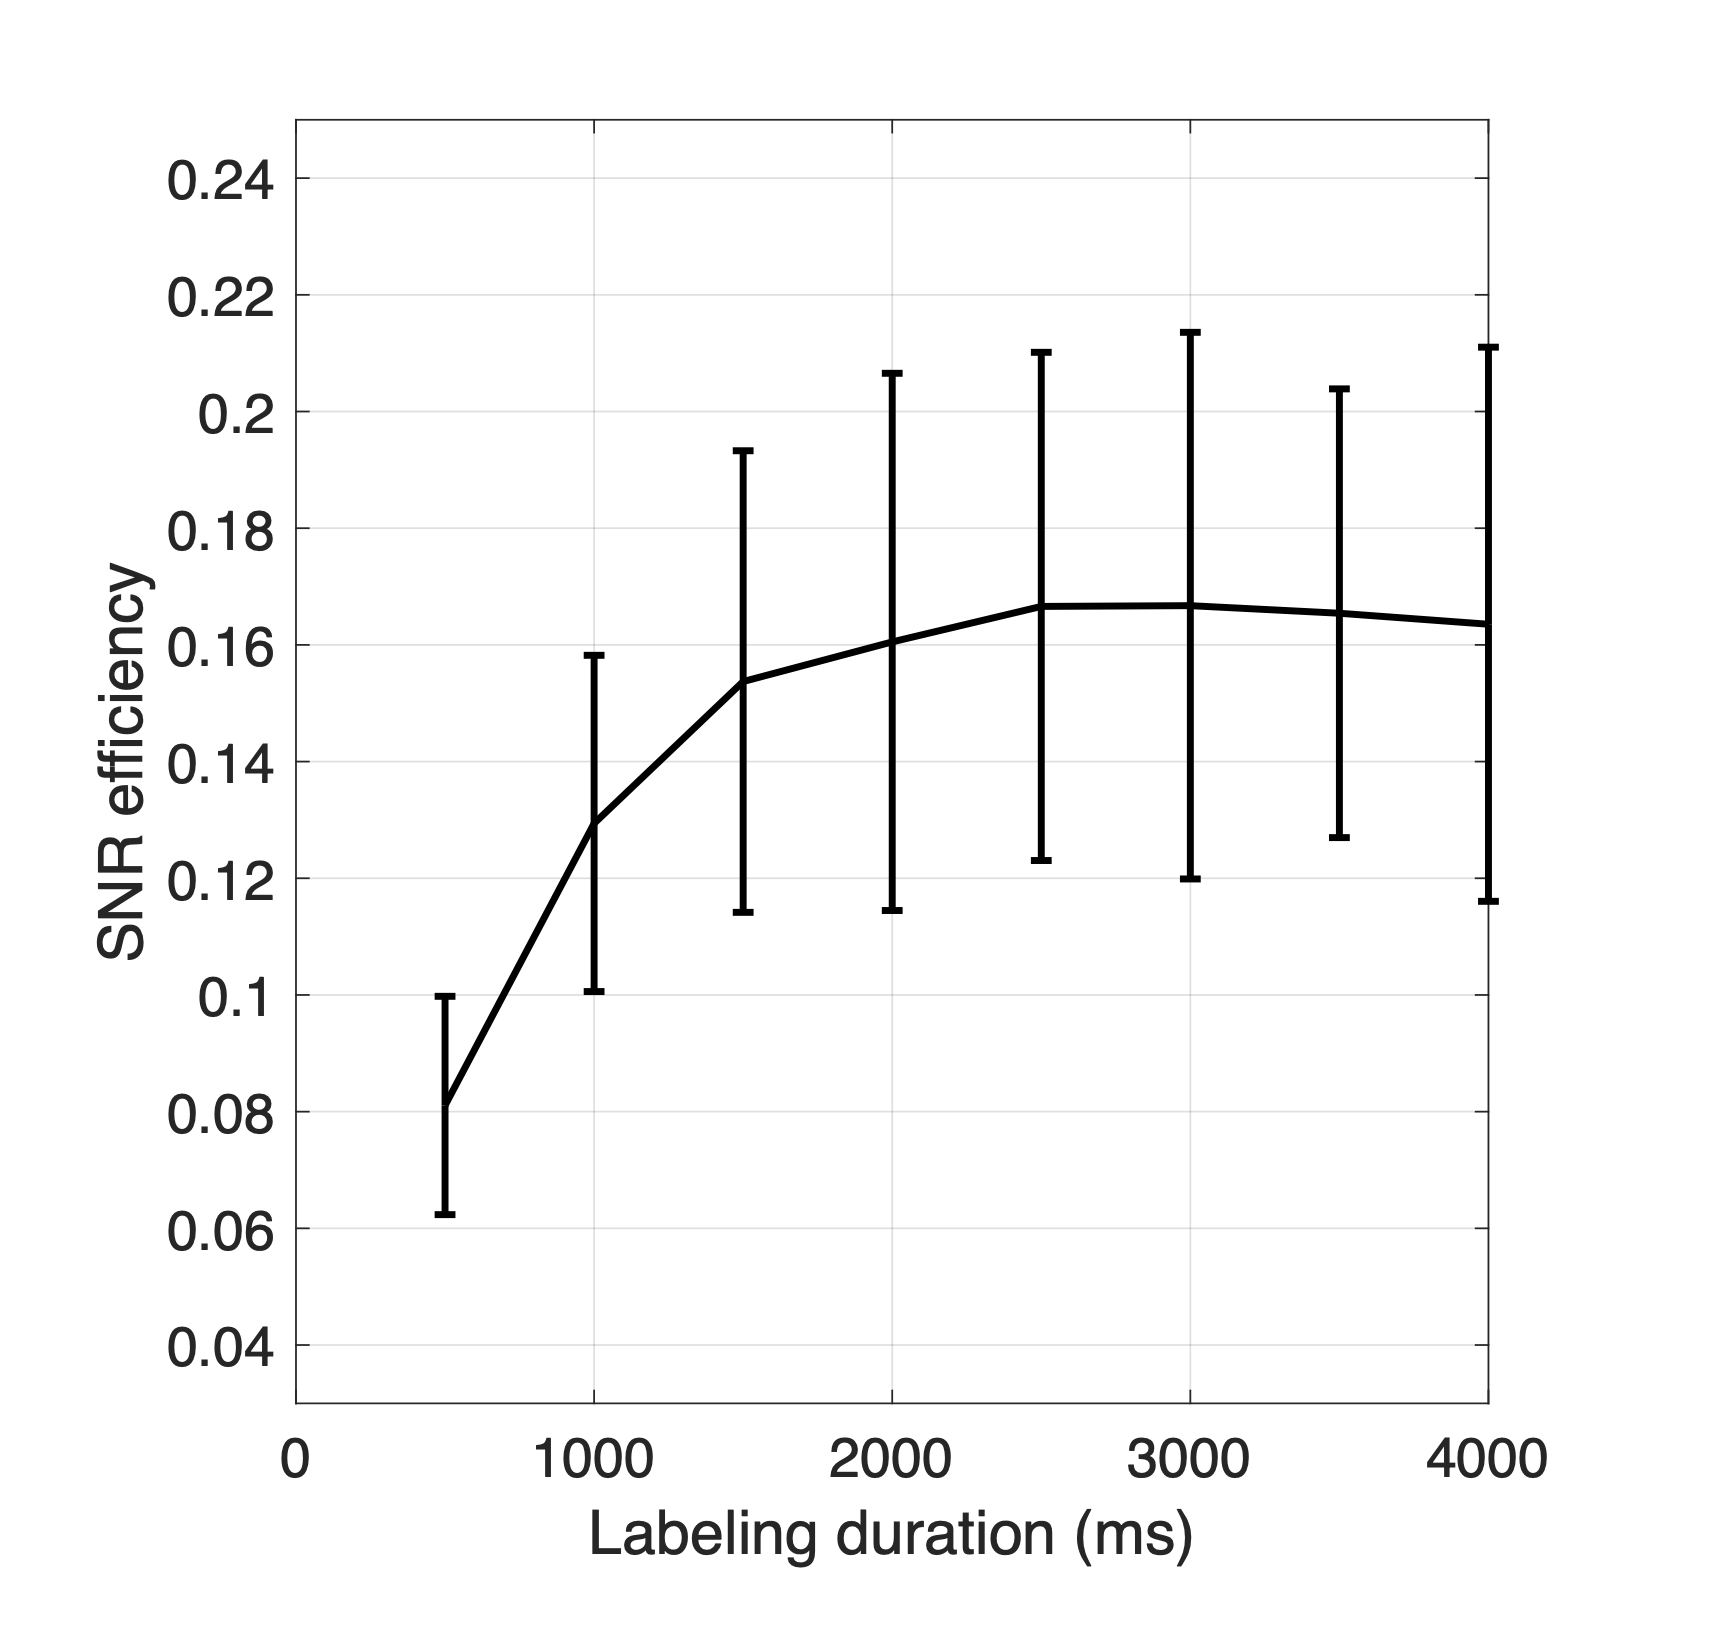
Results: Optimal SNR efficiency was obtained at labeling duration of ~3 s.
Impact: The result of this work provides optimal labeling duration for 7T 3D PCASL studies with maximum SNR per unit time taking into account first-level mode RF power limits.
Introduction
Pseudo-continuous ASL (PCASL) is an established pulse sequence for perfusion MRI of the human brain at 3T1,2. At ultra-high fields (≥7T), performing PCASL is challenging because of B1 and ΔB0 inhomogeneity. Recently, it has been shown that the ΔB0 robustness of PCASL labeling efficiency at 7T can be improved significantly either by compensating B0 off-resonance effects in the feeding arteries3 or by minimizing the interpulse duration within the PCASL RF pulse train4. However, 7T PCASL studies are constrained by elevated RF power deposition limiting both, the labeling duration (LD) and the SNR per unit time (i.e. SNR efficiency). In this work, we determined the dependence of PCASL SNR efficiency (SNReff) with respect to LD taking into account the RF power deposition constraints.Methods
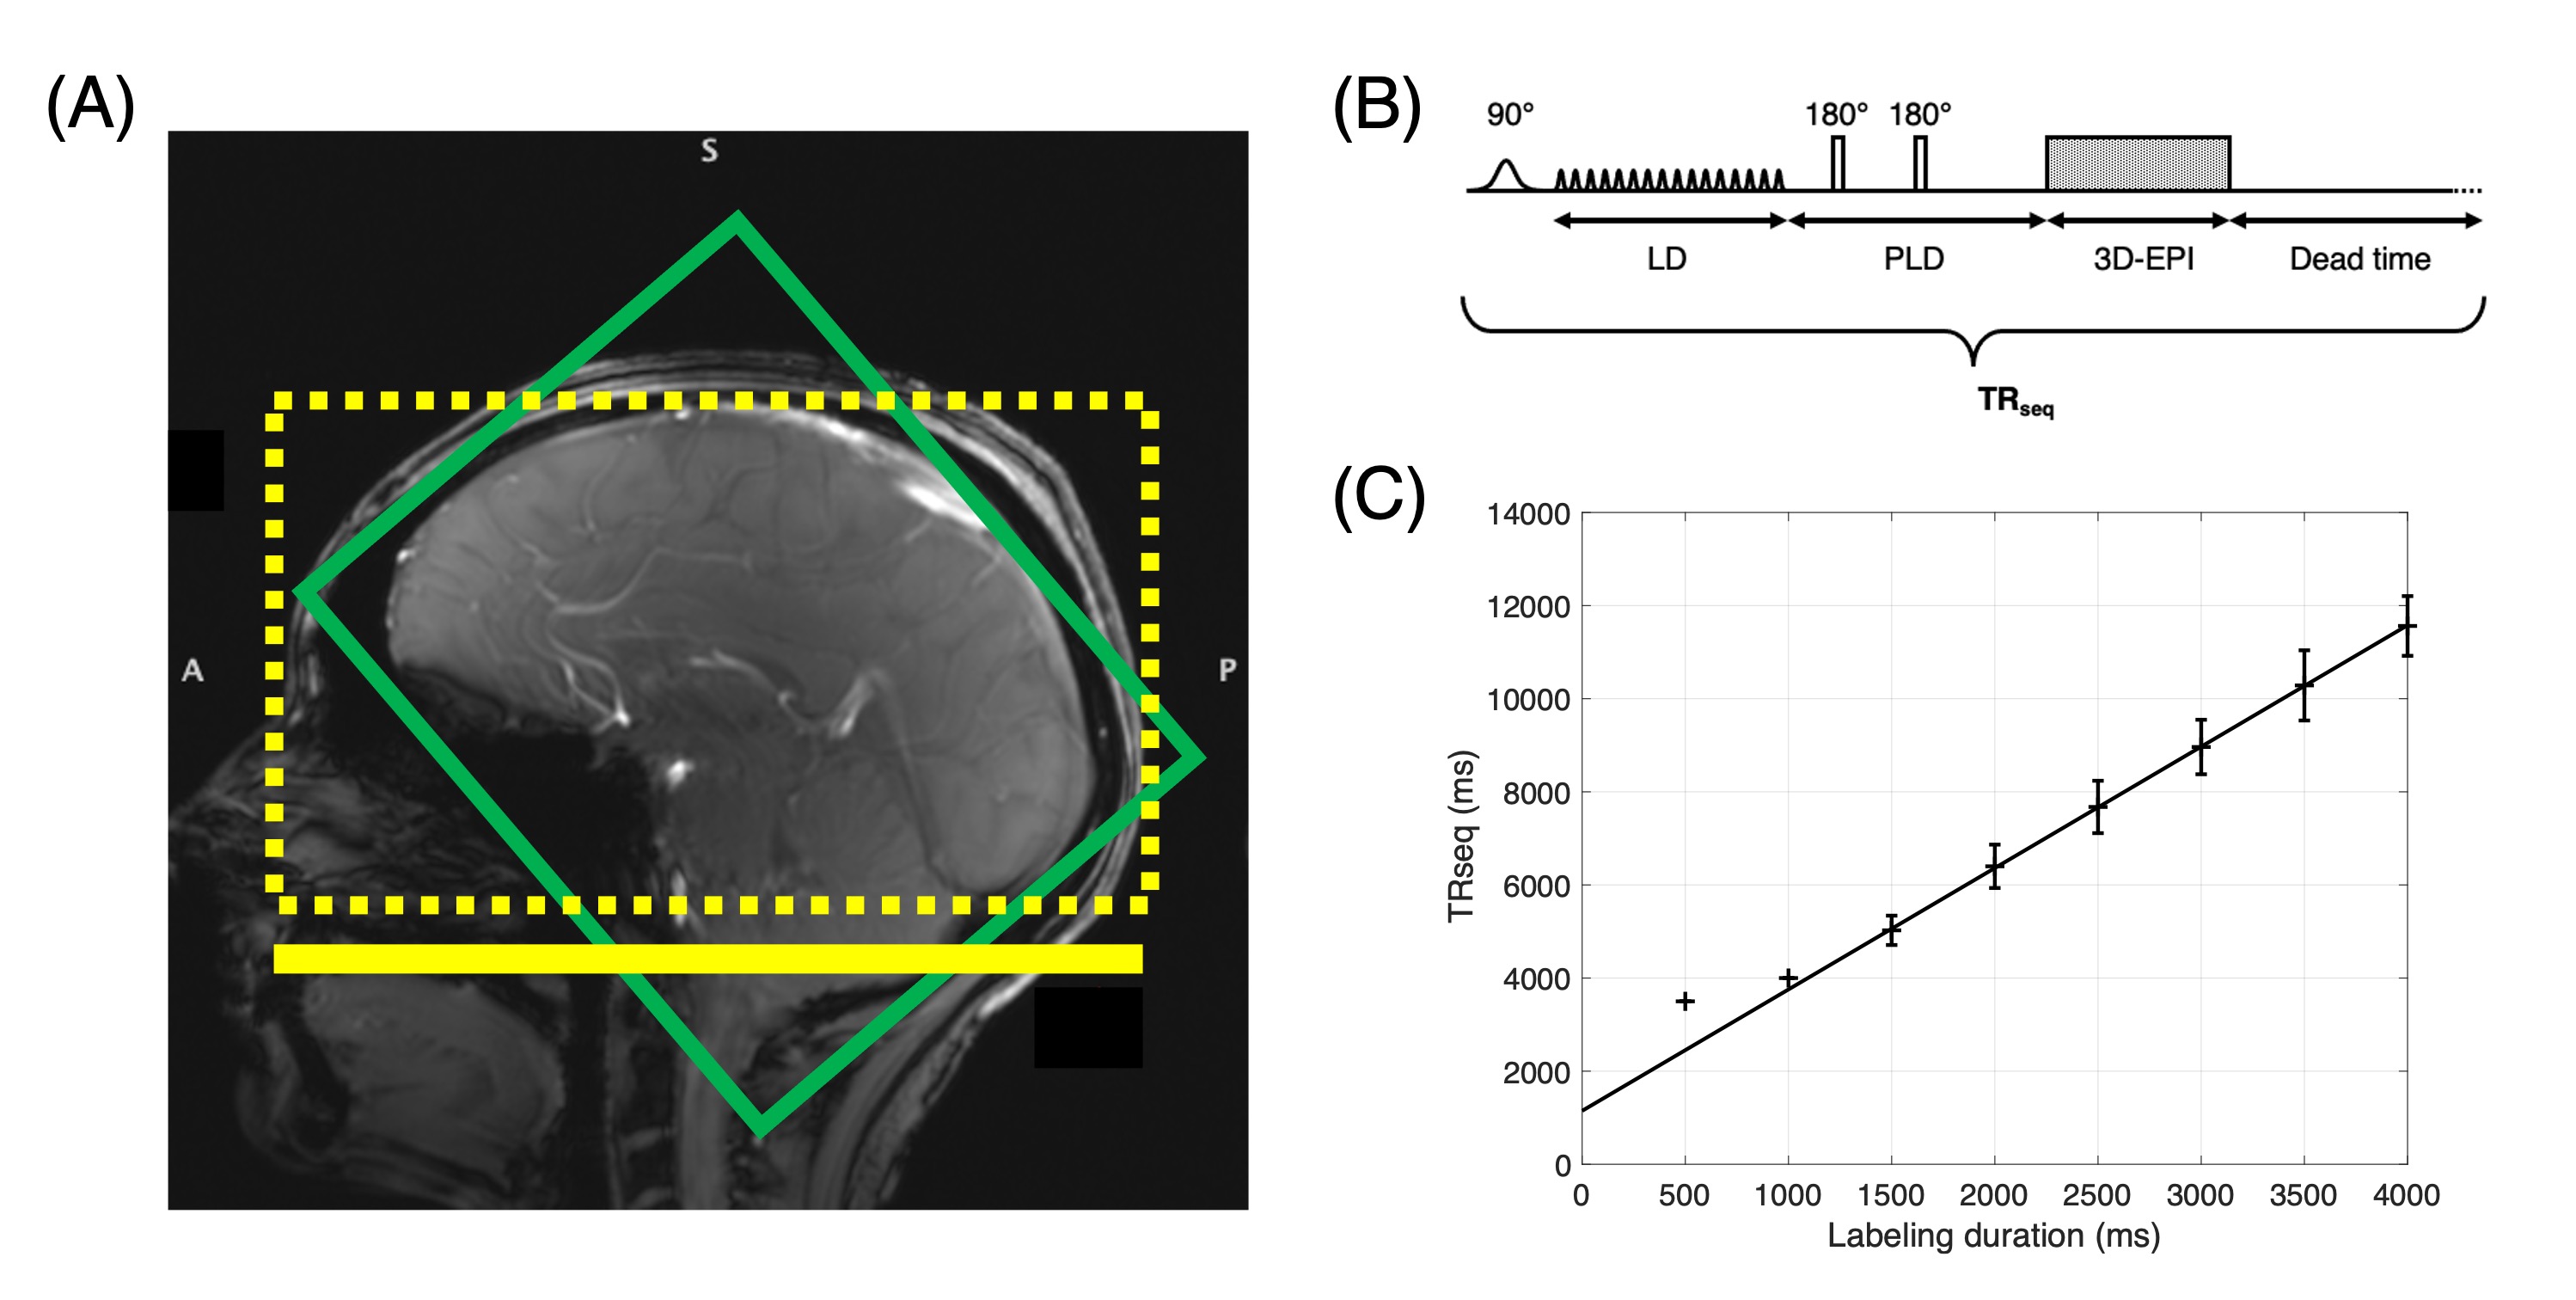
Eight subjects (two males and six females) aged 38±14 years (mean±stdev) were scanned under an IRB approved protocol using an investigational 7T MAGNETOM Terra system (Siemens Healthineers, Erlangen, Germany) with a 8Tx/32Rx head array (Nova Medical, Wilmington, USA). Subjects wore a loose fitting facial covering in the scanner per Institutional requirement. Vendor supplied 3rd order shimming was used. Shimming region covering the brain and the tagging location were positioned as in Figure 1A. B0 off-resonance corrected PCASL was performed using the FMcor method3. Following PCASL parameters were used: Gmax /Gmean= 5.8/0.4 mT/m, Hanning pulse duration/separation = 600/1000 μs and B1mean = ~1 μT, LD = 500 - 4000 ms, and post-labeling delay (PLD) = 1.8 s. Background suppression was accomplished with a selective saturation at the begining of the LD and two non-selective inversion pulses during the PLD. Following the PLD, a complete 3D-EPI5 data set was acquired with following parameters : TREPI = 35 ms, FA = 15°, TE = 13 ms, GRAPPA = 2 along ky, and centric z phase-encoding. Data were reconstructed to a 64x64x32 matrix with 3 mm isotropic resolution. The total sequence repetition time (TRseq) was defined as the sum of the LD, PLD, EPI duration and sequence dead time (Figure 1B). For LD > 1000 ms, a sequence dead time of 0.5-4.5 s was introduced after image acquisition to maintain the SAR ~90 % of the first-level mode limits. The number of control and labeled image volumes was adjusted to maintain a total scan time ~6 min. An M0 image was also acquired at the start of each scan. Anatomical images covering the whole brain were also acquired for tissue segmentation of the gray matter (GM) using an MP2RAGE sequence with 1 mm isotropic resolution for a scan time of ~6 min.SNReff, calculated as the normalized perfusion signal ($$$\overline{ΔM}/M_{0}$$$) divided by the square root of the time required to acquire a pair of control and label images ($$$2 \cdot TR_{seq}$$$), was quantified in 12 slices within the GM mask generated using the aligned anatomical images. The time constant of perfusion signal increase (T1*) was determined by fitting the $$$\overline{ΔM}/M_{0}$$$ vs LD data to $$$c\cdot(1-e^{-LD/T_{1}^{*}}) + d$$$1.
Results
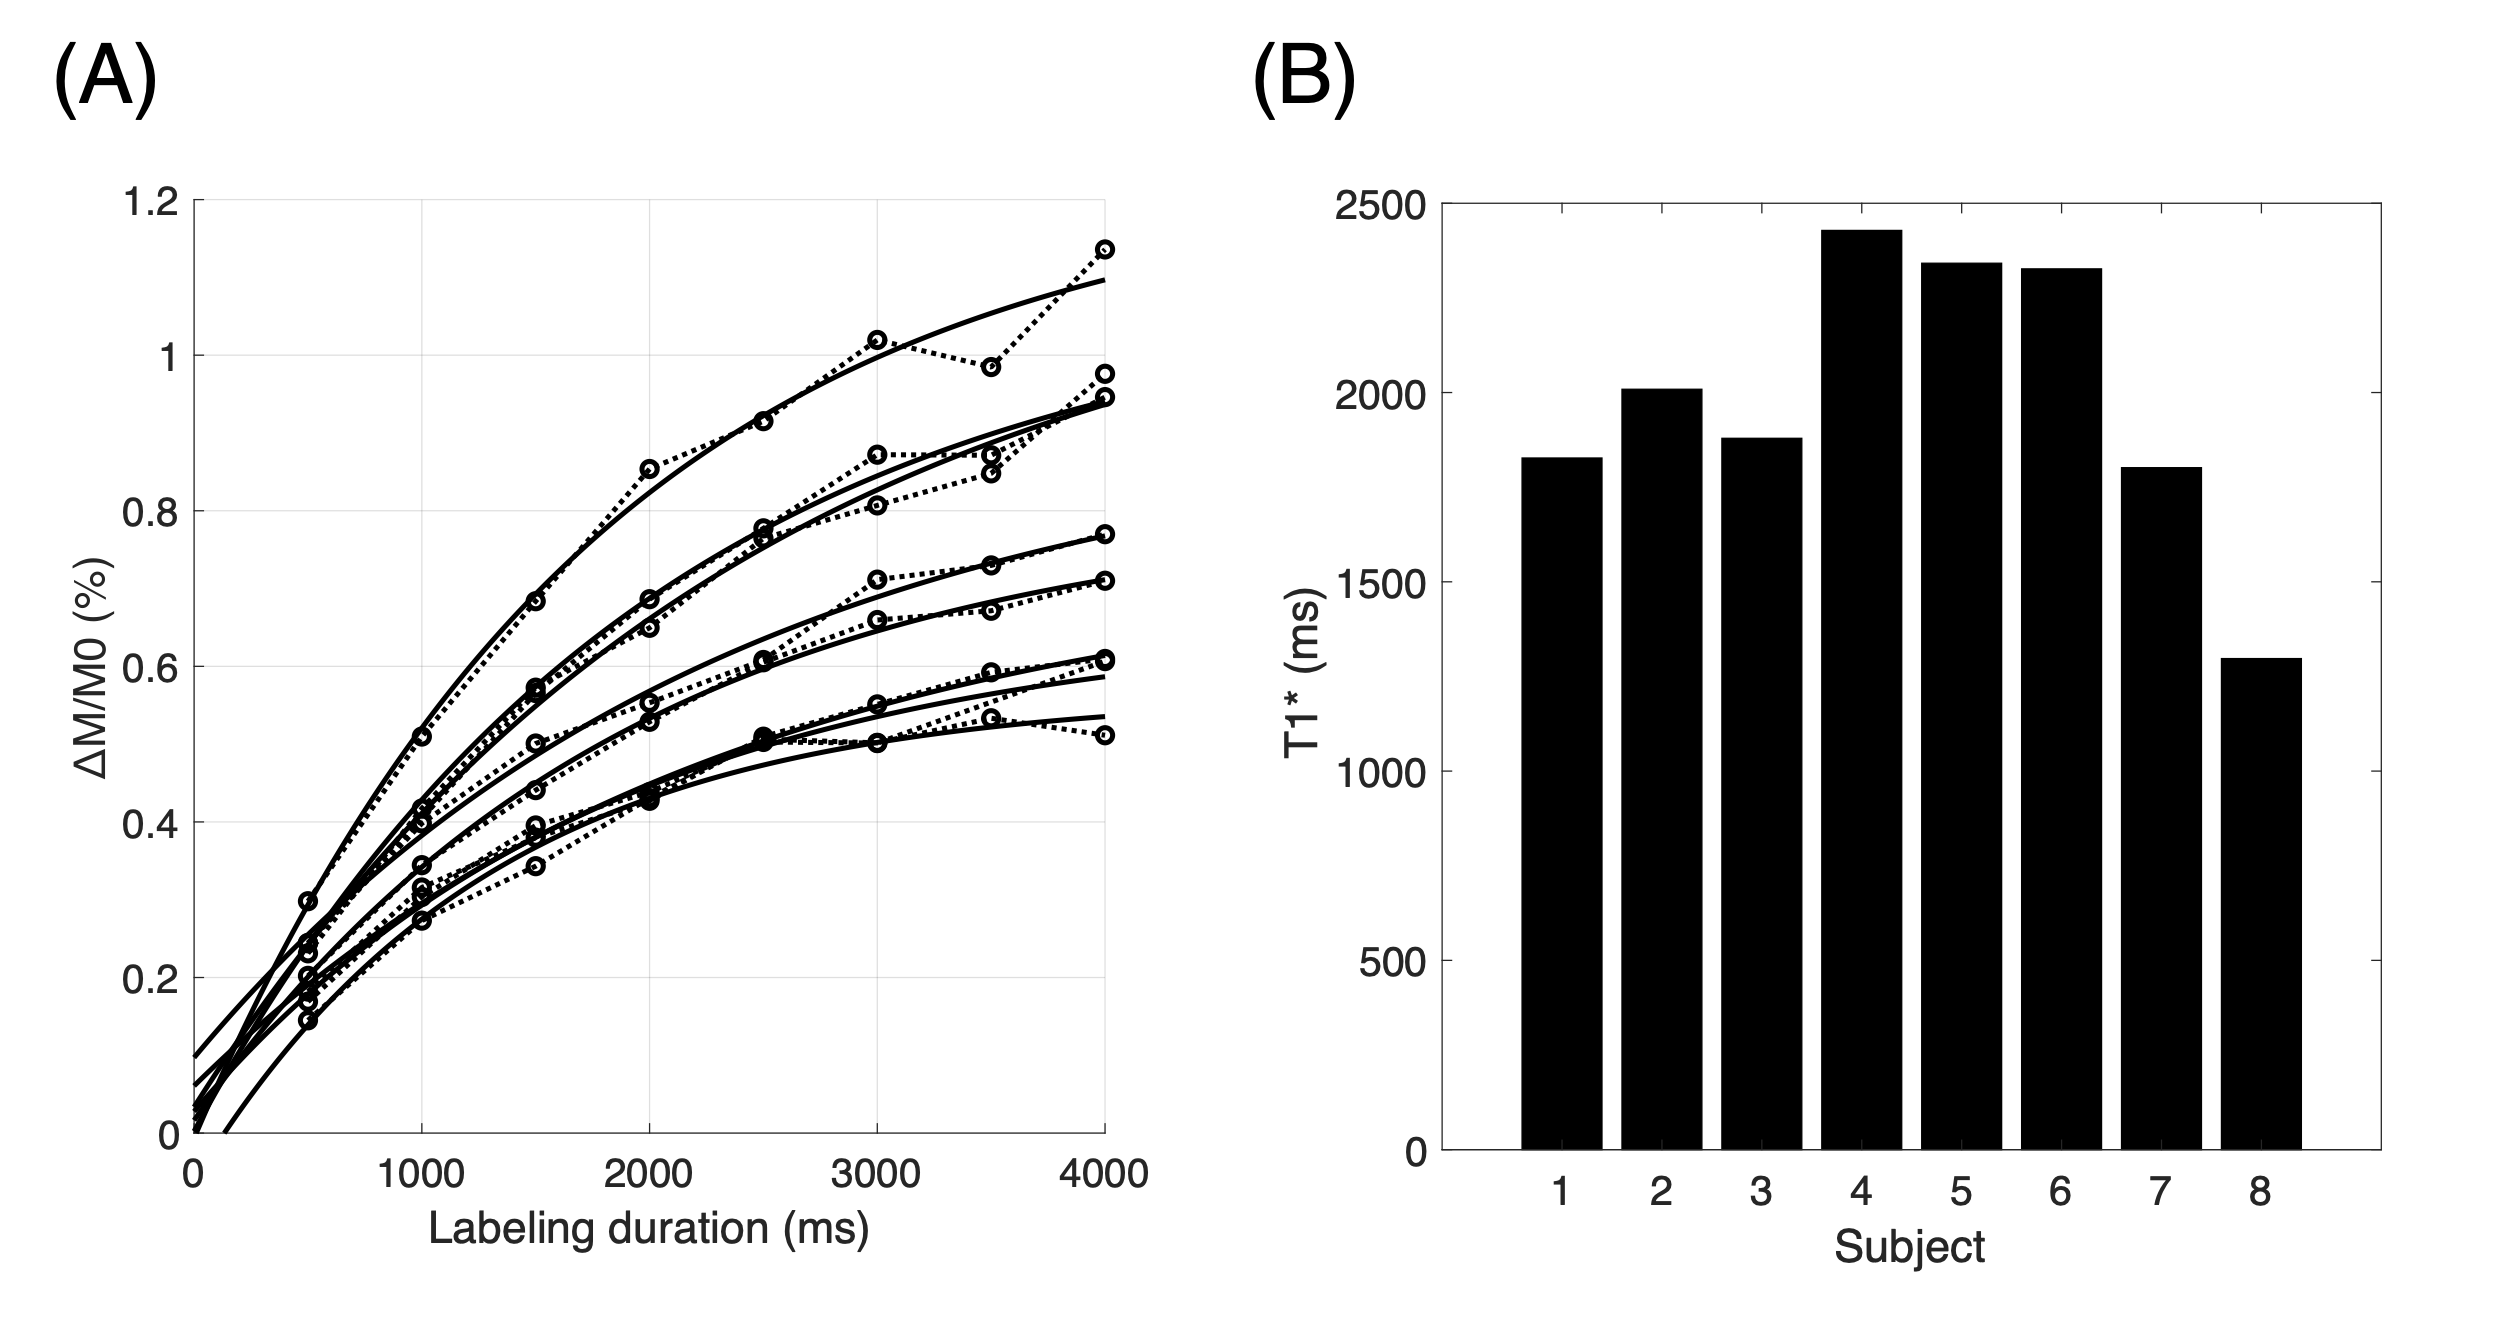
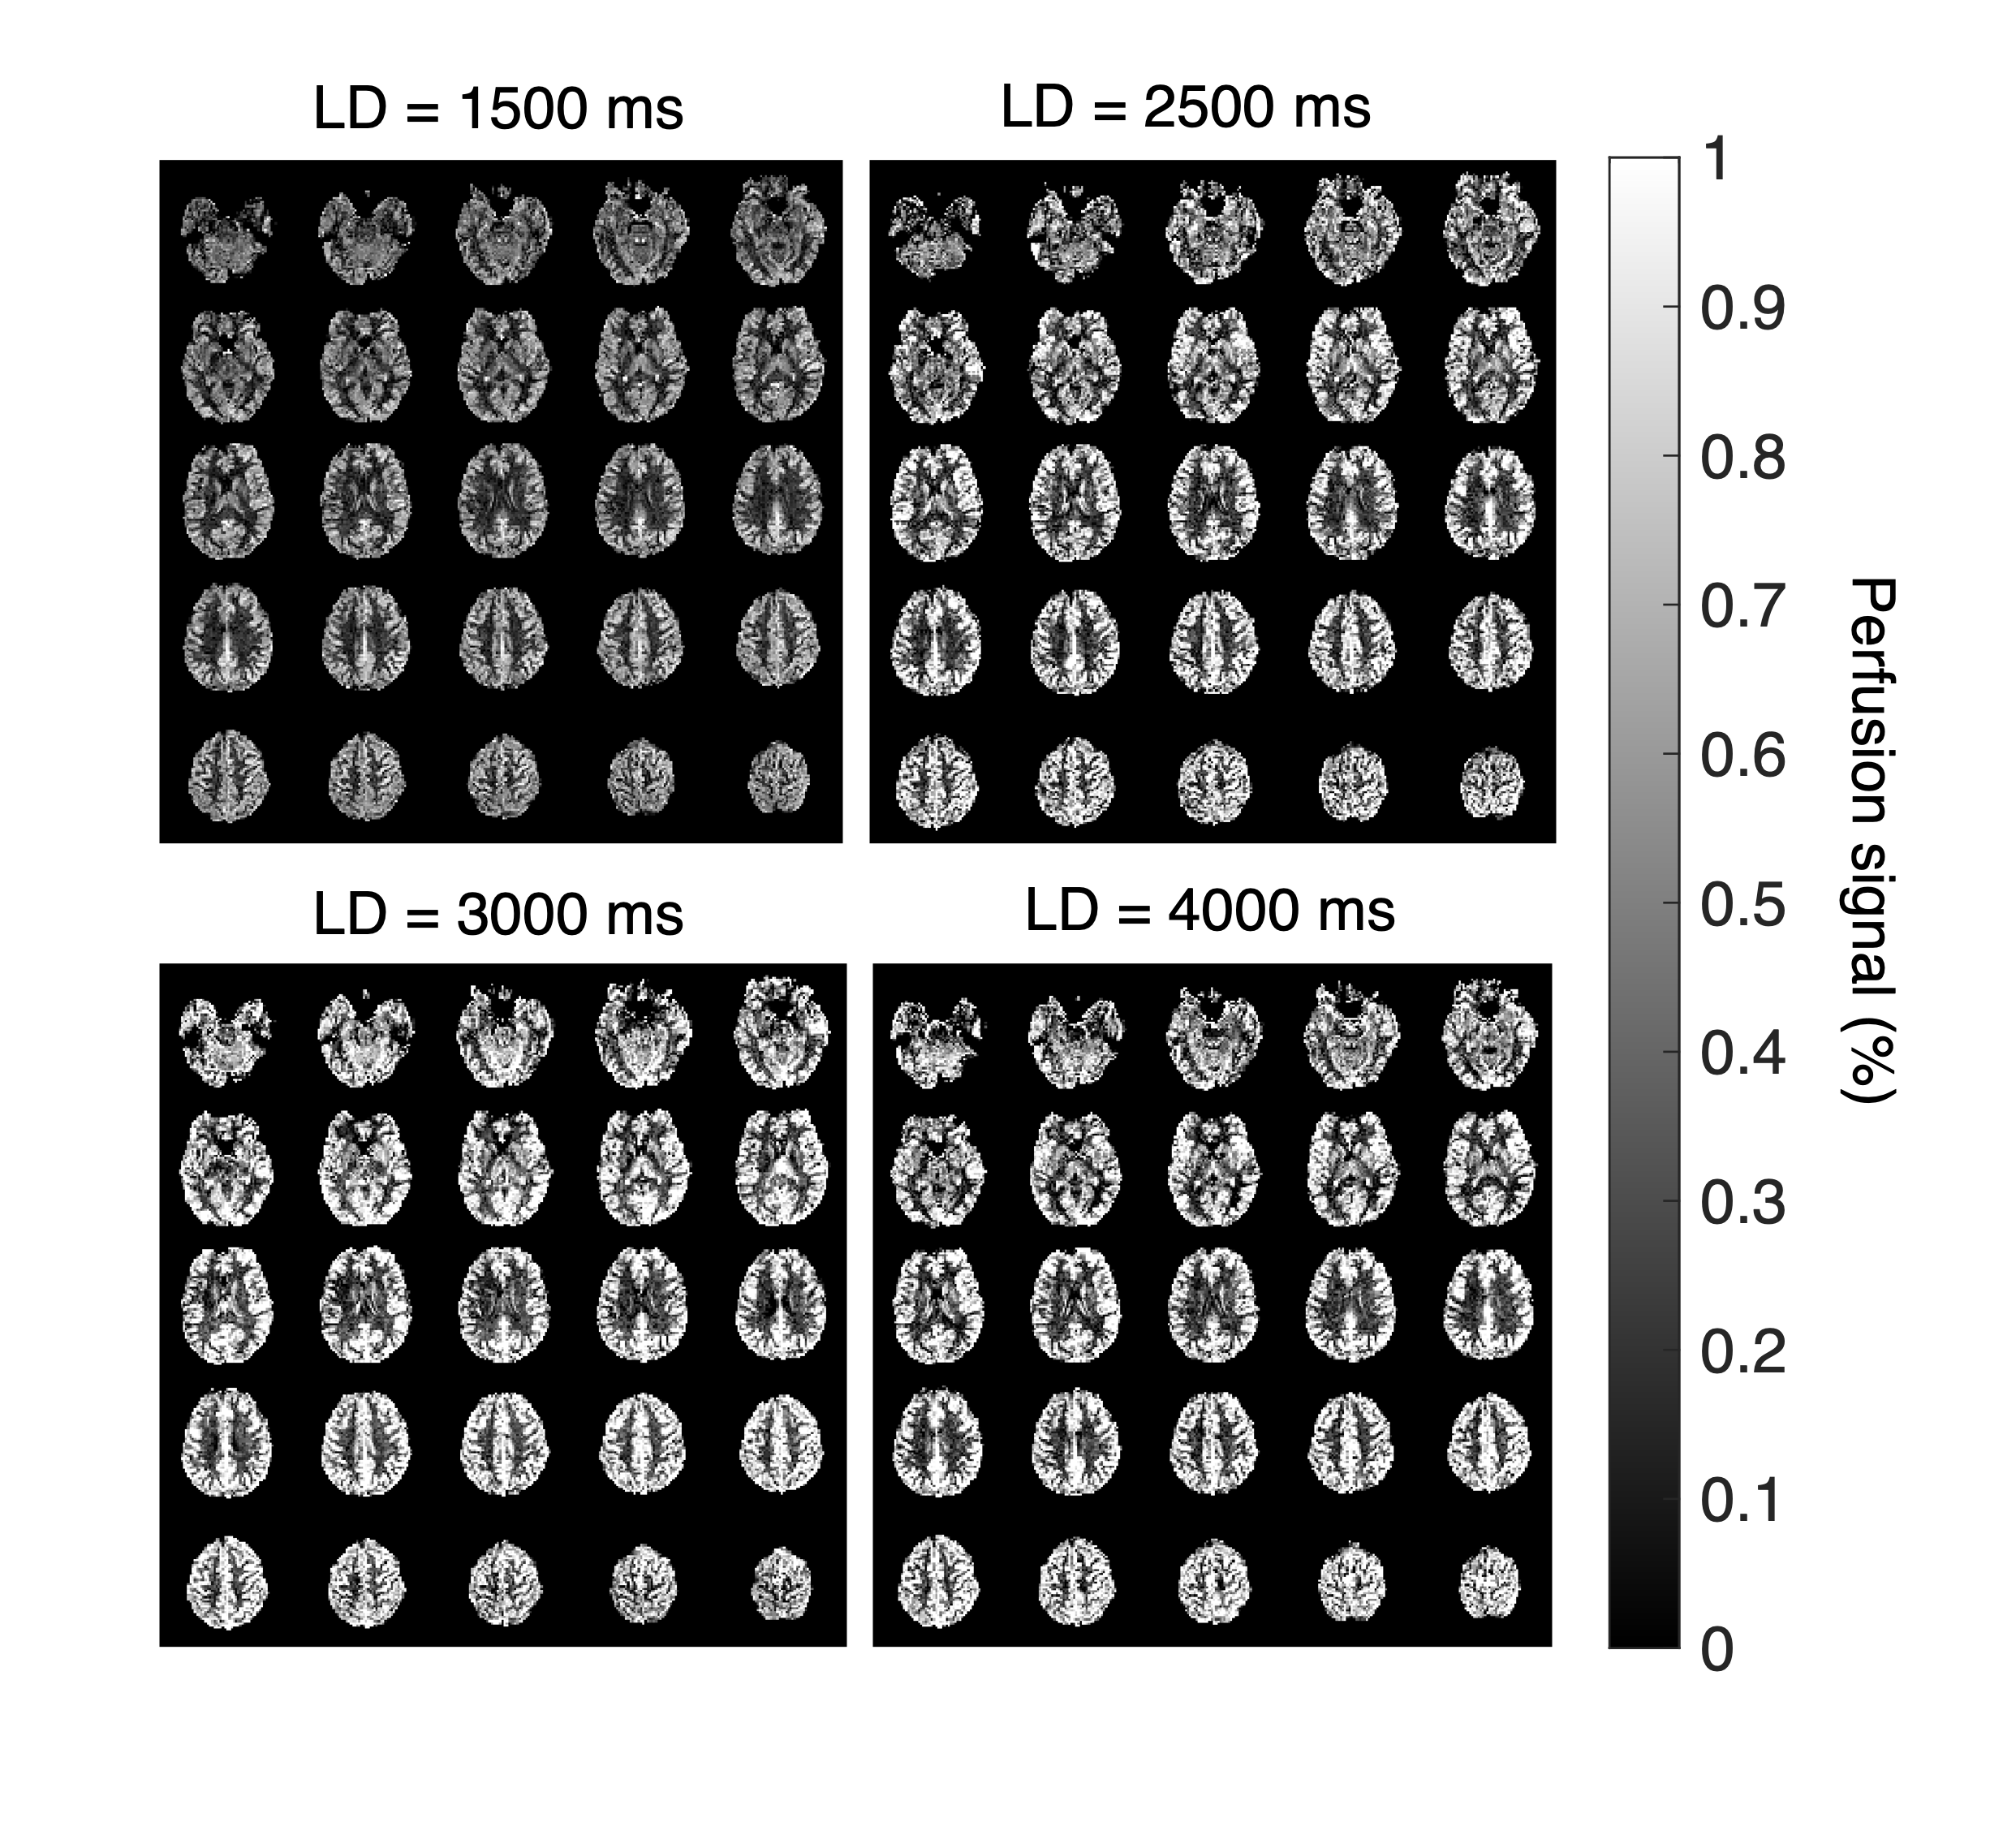
For LD > 1000 ms, TRseq was found to increase linearly with LD according to $$$TR_{seq} (ms) = 1148 + 2.6 \cdot LD$$$ corresponding to a ~33 % PCASL train duty cycle within the sequence (Figure 1C). Normalized GM perfusion signal increased with the labeling duration for all subjects (Figure 2A). As expected, the inter subject variation of the perfusion signal was more prominent at longer LDs. Mean T1* was found to be 1989±375 ms with a range of ~1297-2428 ms (Figure 2B). Figure 3 shows perfusion images from representative subject acquired at different labeling durations. SNReff was found to maximize at a LD of ~2.5-3 s (Figure 4).Discussion
This work shows that the 7T PCASL SNReff can be maximized by employing a labeling duration of ~3 s. Although longer labeling durations affords a larger perfusion signal, the SNReff was reduced due to the increased sequence dead time required to maintain the required SAR level. LD for best SNReff is longer than the value reported previously and closer to the theoretical prediction6. The SNR efficiency can be further improved by using labeling and imaging segments with lower RF power requirements. Average T1* was found to be close to the T1 relaxation time (2.1 s) of GM at 7T7 but the variability of the measurements suggests potential differences in blood transit time to tissue among individuals. Differences in the effective labeling efficiency may have contributed to the large inter subject variation of the perfusion signal and, thus, SNReff. Further investigation is necessecary to assess the different factors contributing to the perfusion signal variations across subjects.Acknowledgements
No acknowledgement found.References
1. Alsop D C, Detre J A, Golay X et al., Recommended implementation of arterial spin-labeled perfusion MRI for clinical applications: A consensus of the ISMRM perfusion study group and the European consortium for ASL in dementia: Recommended Implementation of ASL for Clinical Applications, Magn. Reson. Med., 73:102–116 (2015).
2. Dai W, Gacia D, de Bazelaire C et. al., Continuous flow-driven inversion for arterial spin labeling using pulsed radio frequency and gradient fields: Pulsed Continuous Arterial Spin Labeling, Magn. Reson. Med., 60:1488–1497 (2008).
3. Saib G, Koretsky A, and Talagala S L, Optimization of Pseudo-Continuous Arterial Spin Labeling using Off-resonance Compensation Strategies at 7T, Magn. Reson. Med., 87:1720-1730 (2022).
4. Zhao C, Shao X, Shou Q et. al., Whole-cerebrum distortion free threedimensional pseudo-continuous arterial spin labeling at 7T, Neuroimage, 227:120251 (2023).
5. Gai N D, Talagala S L, Butman J A. Whole-brain cerebral blood flow mapping using 3D echo planar imaging and pulsed arterial tagging, J Magn. Reson. Imag., 33:287-295 (2011).
6. Ghariq E, Teeuwisse W M, Webb A G et. al., Feasibility of pseudocontinuous arterial spin labeling at 7T with whole brain coverage, MAGMA., 25:83-93 (2012).
7. Rooney W D, Johnson G, Li X et al., Magnetic field and tissue dependencies of human brain longitudinal 1H2O relaxation in vivo, Magn. Reson. Med., 57:308–318 (2007).
Figures