2000
Unveiling asymmetric magnetization transfer effects for BBB-ASL quantification in MCAO model rats1Research Institute for Brain and Blood Vessels Akita, Akita, Japan
Synopsis
Keywords: Arterial Spin Labelling, Arterial spin labelling, Asymmetric magnetization transfer
Motivation: This study explores the asymmetric magnetization transfer (MT) effects on recently developed blood-brain barrier integrity (BBB-ASL) technique, with a focus on different neck labeling gradient polarities.
Goal(s): Validation of the asymmetric MT effect in BBB-ASL.
Approach: BBB-ASL parameters of arrival transit time (ATT), intra-voxel transit time (ITT), exchange time (Tex) and CBF were estimated by our custom MATLAB program based on a two-compartment model.
Results: Asymmetric MT effect changes not only depending on physical factors but also on the severity of the tissue. The difference might be related to changes in ITT and ATT.
Impact: This study explores the asymmetric magnetization transfer (MT) effects on BBB-ASL with MCAO model rats. Asymmetric MT effect changes not only depending on physical factors such as magnetic field inhomogeneity but also on the severity of the tissue.
Introduction
In arterial spin tagging approaches of the continuous arterial spin labeling (CASL), cerebral blood flow (CBF) quantification differed between polarities of neck labeling gradient1. The CBF difference was caused by asymmetric magnetization transfer (MT) effect especially in a single radio-frequency coil. Several papers described the MT effect was negligible in a two-coil system consists of a small labeling coil in neck position2,3. However in our experience, the asymmetric MT effect was observed even in a two-coil system and the effect was differ in transient ischemic tissue1. Recently developed non-invasive MRI techniques to probe the blood brain barrier (BBB) integrity (BBB-ASL), BBB water exchange by separating the ASL signal fractions in the intra- and extravascular compartments based on their differences in transversal relaxation time4. Assuming the parameters estimated by BBB-ASL might be influenced by the asymmetric MT effect, we verified the effect in BBB-ASL for transient ischemic tissue of middle cerebral artery occlusion (MCAO) model rats.Materials & Methods
Four male Sprague-Dawley rats were used. Sixty minutes of transient ischemia was induced by occluding the left MCAO with embolic thread. The rats were set in the 4.7-T MRI spectrometer (Unity Inova; Agilent, USA) in 24, 48, 72 hours after reperfusion and pre-surgical operation. CASL was performed using a two-coil system with labeling neck coil and quadrature brain surface coil (Rapid Biomedical, Germany). CASL image was acquired with a gradient echo sequence (TR/TE =50/4,10 ms, post label delay;PLD = 200,400, 600 800 ms ). Asymmetric ratio is defined as (Mlabel+ - Mref+)/(Mlabel- - Mref-), where Mlabel is the brain tissue signal acquired after inversion RF irradiation at a labeling position and Mref is the signal with the RF irradiation of control position. Superscripts of + and – indicate the presence of labeling gradient of 1 and –1 Gauss/cm at RF irradiation, respectively. CASL image of plus and minus labeling gradient was measured by averaging five times. BBB-ASL was estimated using a custom program implemented on MATLAB based on the two-compartment model4. The program uses the Nelder-Mead simplex method to estimate four positive value parameters of arrival transit time (ATT), intra-voxel transit time (ITT), exchange time (Tex) and CBF based on data obtained from two different TEs and four different PLD times. Each value was calculated for each voxel. ROI of left ischemic caudate-putamen (I-Cpu) and healthy right Cpu (N-Cpu) were selected manually and the mean and standard error in each ROI were evaluated.Results
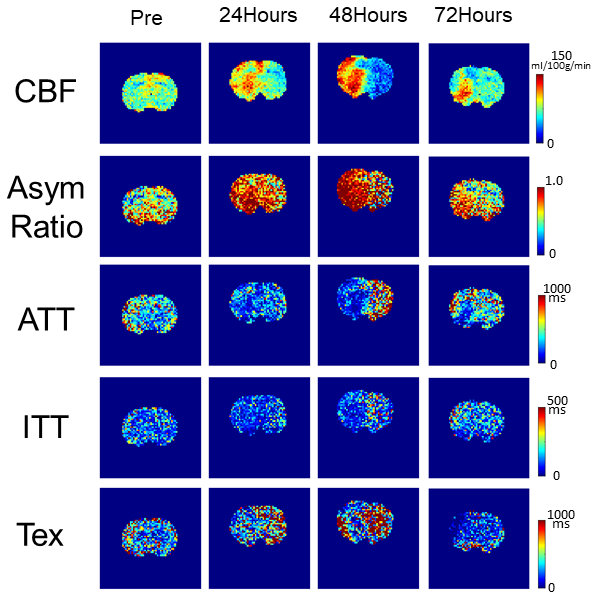
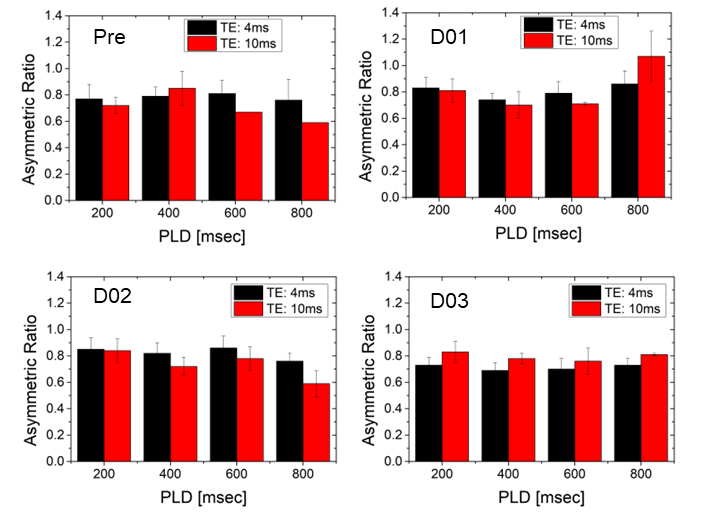
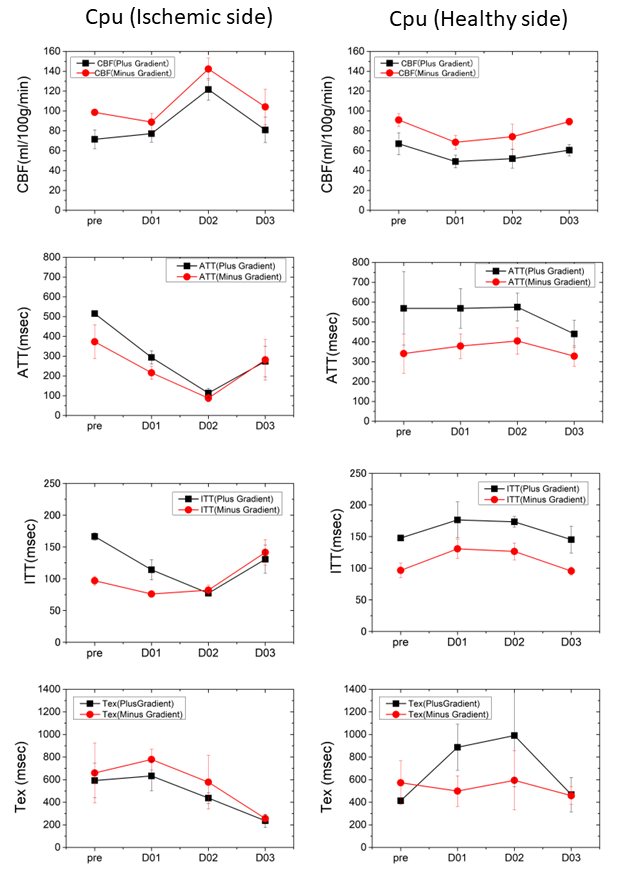
Typical images change in 24, 48 and 72 hours after reperfusion and pre-surgical time point were shown in figure 1. Asymmetric ratio of I-Cpu were higher than those of N-Cpu. On the other hand, the I-Cpu values of ATT, ITT, and Tex were lower than those of N-Cpu. The dependence of asymmetric ratio in I-Cpu on PLD and TE in each time points were shown in figure 2. The value of asymmetric ratio differed depending on the PLD and TE values. Temporal changes of estimated parameters from each labeling gradient after reperfusion were shown in figure 3. Although the parameters changed in the same way for plus and minus labeling gradients, the values of ATT and ITT showed almost the same values for plus and minus labeling gradients 48 hours after reperfusion.Discussion
BBB-ASL parameters were affected by asymmetric MT effect and the effect differed in ischemic and healthy tissue. This systemically difference in each labeling gradient may be the results of asymmetric frequency response of the RF coil or imperfection in the gradient. The estimated parameter difference between I-Cpu and N-Cpu in BBB-ASL might be the result of macro molecular difference in ischemic tissue. The asymmetric ratio difference in ischemic tissue is thought to be due to changes in ITT and ATT.Acknowledgements
No acknowledgement found.References
1. Nakamura et al, Proc ISMRM 2014;22:1866
2. J Pekar et al., MRM 1996; 35: 70 – 79
3. Shen et al., JCBFM 2011 ; 31 : 2076-2085
4. A Mahroo et al., Front Neurosci 15; 2021: 719676
Figures