1999
Image quality assessment model for 3D ASL in children1College of Biomedical Engineering & Instrument Science, Zhejiang University, Hangzhou, China, 2Department of Radiology, Children's Hospital, Zhejiang University School of Medicine, National Clinical Research Center for Child Health, Hangzhou, China, 3Department of Radiology, University of Pennsylvania, Philadelphia, PA, United States, 4State Key Laboratory of Cognitive Neuroscience and Learning, Beijing Normal University, Beijing, China
Synopsis
Keywords: Arterial Spin Labelling, Arterial spin labelling
Motivation: Arterial spin labeling (ASL) is vulnerable to motion and off-resonance, which may result in unstable image quality, particularly in children.
Goal(s): To propose an automatic image quality assessment model for 3D ASL in children.
Approach: The proposed model was trained and validated on 51 3D ASL scans from children, and was compared to a previously developed reference method. The performance was evaluated using AUC and 5-fold cross-validation tests.
Results: The proposed model yielded 8%-11% higher AUC, accuracy, and F1 score compared to the reference method.
Impact: The proposed model for assessing image quality in children's ASL may offer a valuable tool for clinics and studies on brain development with a large cohort.
Introduction
Arterial spin labeling (ASL) is a non-radiation and non-invasive method for quantifying regional cerebral blood flow (CBF), which can be used to investigate brain development and diseases in a large cohort. However, because of its sensitivity to motion and suboptimal parameters determined from adult imaging, ASL in children suffers from image artifacts. Although a few methods have been designed to assess ASL image quality1-4, most were designed for adult and 2D ASL. ASL image quality in children is still evaluated manually, which is inefficient and introduces subjective bias. In this work, an automatic ASL image Quality Assessment model of Children (QAC) was proposed, which was evaluated on 51 ASL scans from children and compared to the reference method (QEI)1.Method
51 ASL scans (4.34±4.08 years old) were acquired from infants and children using 3D pseudo-continuous ASL (pCASL) on a 3T Philips Achieva scanner. The ASL scan parameters were as follows: TR 4096ms, TE 10.7ms, resolution 3.75mm x 3.75mm, slice thickness 6mm, labeling duration 1.8s, and post label delay 1.8s. T1-weighted images were acquired using the eT1W_FFE sequence with TR 213ms, TE 2.25ms, and slice thickness 6mm. Grey matter (GM) mask and white matter (WM) mask were segmented from the T1W image using SPM12. The quality of the ASL images was independently graded by three experts: L.Z. (scientist with 10 years ASL imaging experience), Q.Y. (a radiologist with 4 years experience), and R.L. (one year ASL quality assessment experience). The ASL images were graded into two groups: acceptable (1) and unacceptable (0). Inter-rater reliability was assessed using Fleiss’ kappa and the final grade was determined based on the majority decision among the three experts.Quality Assessment Feature
1 Perfusion ratio
The ratio between the mean GM signal and the mean WM signal. A lower deviation from the ideal ratio of 2.5:11 may suggest higher quality.
2 GM Connectivity
The number of the connected binary regions in GM mask, when the ASL image was thresholded at pixel intensity 15 empirically.
3 Coefficient of variation
The standard deviation in GM divided by the mean GM signal, which detected the bright edges or variability from head motion in ASL images.
4 Coefficient of Joint Variation
Division between the sum of the standard deviation in GM and WM and the difference between the mean GM and WM signal.
5 Abnormal pixel
Percentage of abnormal pixels that were outside 3 sigma in GM and WM.
6 Contrast-to-noise ratio
Division between the difference between mean GM and WM signal and their global variance.
7 Structural similarity
A synthetic ASL image was constructed by assigning constant pixel values of GM:WM=2.5:1. The structural similarity (SSIM) index5 measuring the similarity between the original and the synthetic ASL image.
Quality Assessment Model
The proposed model was developed by combining the above features in a logistic regression model. As a benchmark, the QEI model was retrained on the children ASL data with two major modifications. First, 2D features were expanded to 3D images. Second, instead of the feature negative GM CBF, the number of pixels with zero values in the GM was counted because ASL images were reconstructed online, resulted in no negative pixels. The models were trained using 51 ASL images and manual labeling. To evaluate performance, 5-fold cross-validation was performed.
Results
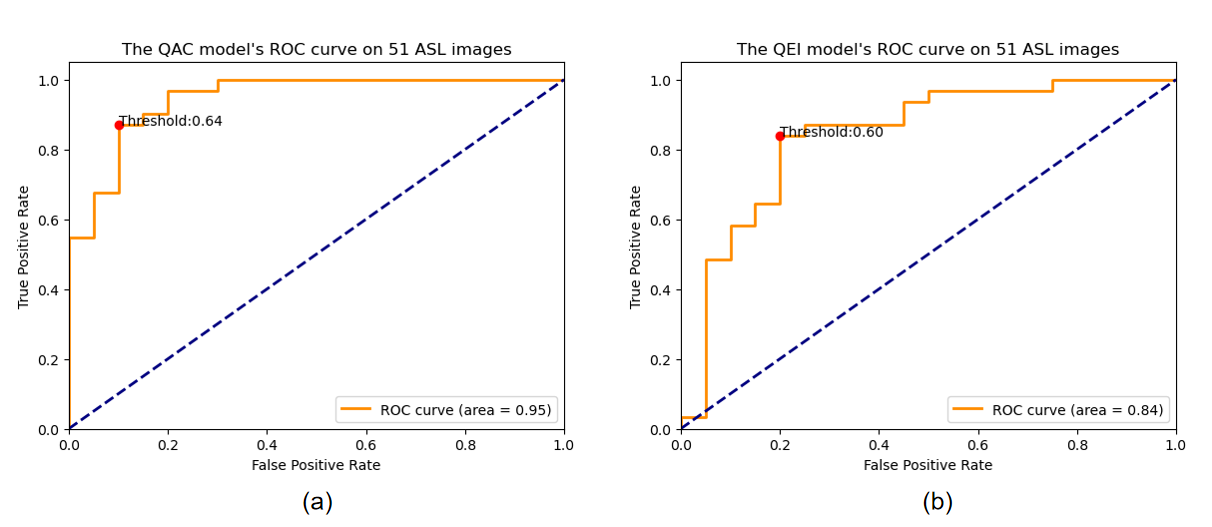
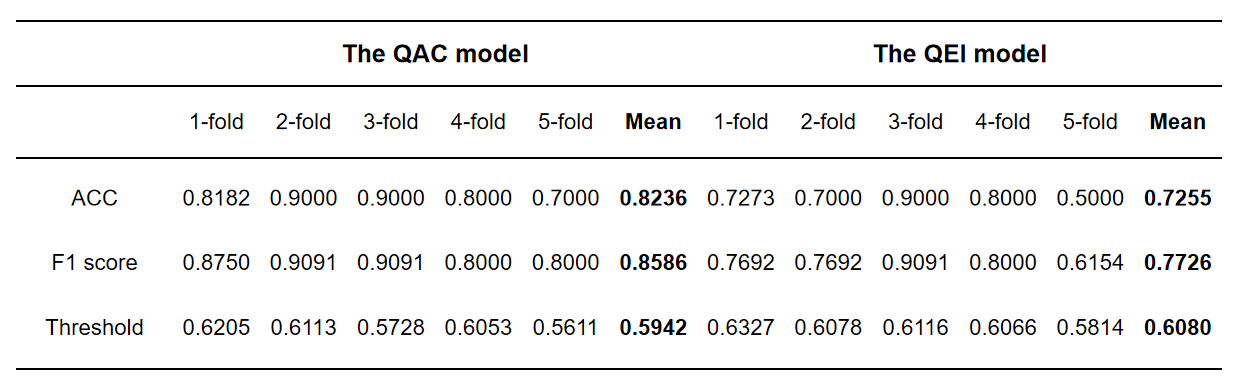
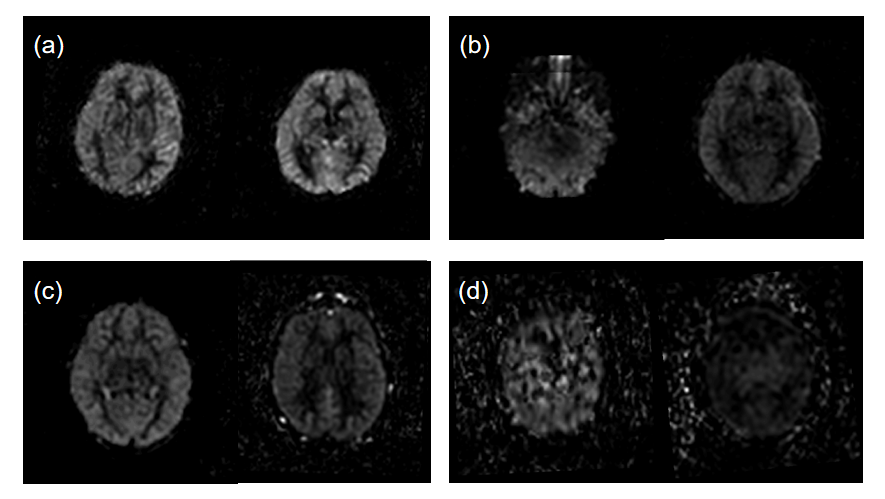
The manual labeling showed medium inter-rater variance (Fleiss’ kappa = 0.537). The proposed model yielded a higher AUC (0.95, Figure 1a) compared to the QEI (0.84, Figure 1b). The proposed model also provided superior accuracy (82.36%) and F1 score (0.8586) than the QEI (72.55% and 0.7726) in the cross-validation tests (Table 1). Representative cases of the two models were shown in Figure 2. In cases that the two models resulted in mismatched decision (Figure 2b and 2c), models may be misled by artifacts and lesions. Images from 2 participants were shown for each category.Discussion
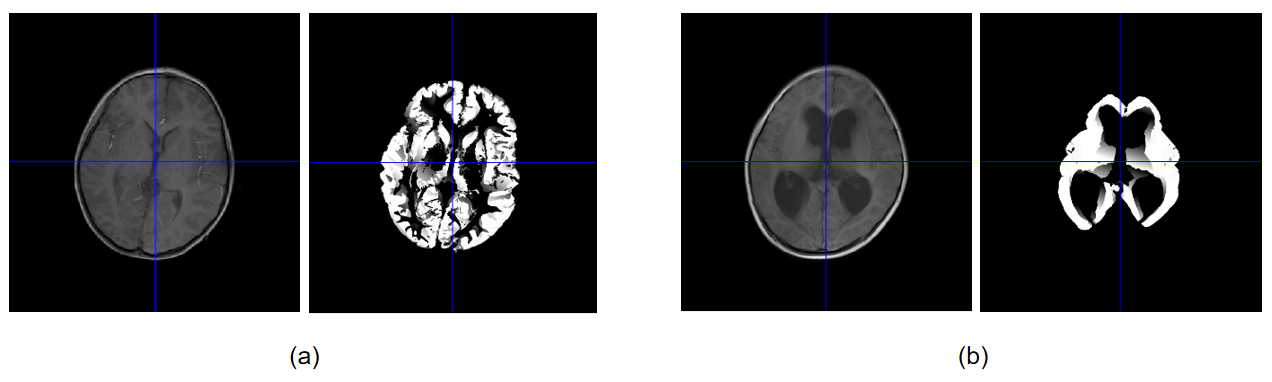
This work proposed an ASL image quality assessment model of children based on 7 features, which showed improved AUC, accuracy, and F1 score compared to the previous model. However, there are a few limitations. First, The proposed model depended on the accurate segmentation and coregistration of the strucutrual and ASL image. But GM and WM segmentation may fail when lesions were presented (Figure 3). The lesions also resulted in abnormal local ASL signals. These may introduce errors and mislead the model. Second, the data was labeled into high and low quality in this work, which was different from the QEI and could result in unreliable exponential fitting and unfair comparisons.Acknowledgements
This work is supported by the National Key R&D Program of China (2022ZD0118004), the Alzheimer's Association (AARF-18-566347), Zhejiang Provincial Natural Science Foundation of China (LGJ22H180004, 202006140, and 2022C03057), and the MOE Frontier Science Center for Brain Science & Brain-Machine Integration, Zhejiang University.References
1. Dolui S, Wolf R, Nabavizadeh S A, et al. Automated Quality Evaluation Index for 2D ASL CBF Maps[C]. International Society for Magnetic Resonance in Medicine, 2017.2. Adebimpe A, Bertolero M, Dolui S, et al. ASLPrep: a platform for processing of arterial spin labeled MRI and quantification of regional brain perfusion. Nat Methods. 2022 Jun 10;19(6):683–6.
3. Shirzadi Z, Stefanovic B, Chappell MA, et al. Enhancement of automated blood flow estimates (ENABLE) from arterial spin-labeled MRI. J Magn Reson Imaging. 2018 Mar;47(3):647–55.
4. Li Y, Liu P, Li Y, et al. ASLMRICloud: An online tool for the processing of ASL MRI data. NMR Biomed. 2019 Feb;32(2):e4051.
5. Z. Wang, A. C. Bovik, H. R. Sheikh, et al. Image quality assessment: From error visibility to structural similarity. IEEE Transactions on Image Processing, 13(4):600–612, 2004.
Figures