1997
Evaluation of multi-delay arterial spin labeling MRI-based measures of cerebral blood flow in a PET/MRI study of aging1Athinoula A. Martinos Center for Biomedical Imaging, Massachusetts General Hospital, Charlestown, MA, United States, 2Department of Radiology, Harvard Medical School, Boston, MA, United States, 3Department of Neurology, Massachusetts General Hospital, Charlestown, MA, United States, 4Department of Neurology, Harvard Medical School, Boston, MA, United States
Synopsis
Keywords: Arterial Spin Labelling, Perfusion, PET/MR
Motivation: Arterial spin labeling (ASL) MRI with a single post-labeling delay may not be appropriate for quantifying cerebral blood flow (CBF) in older participants or individuals with Alzheimer’s disease (AD).
Goal(s): To evaluate reliability of multi-delay versus single-delay ASL and their associations with [15O]water positron emission tomography (PET) using simultaneous PET/MRI in older adults.
Approach: We investigated 4-week test-retest reliability using intra-class correlation (ICC) and assessed Spearman’s correlations between ASL and PET in young and older controls (n=12) and AD patients (n=3).
Results: ICC values were similar between ASL approaches but exhibited regional differences. Multi-delay ASL-based CBF was correlated with PET in more regions-of-interest.
Impact: Multi-delay arterial spin labeling MRI provides CBF measures with good intermediate-term reliability that are strongly correlated with gold-standard [15O]water PET when studying older adults and AD patients.
Introduction
Positron emission tomography (PET) using [15O]water is the gold standard for measuring cerebral blood flow (CBF), but [15O]water PET requires an on-site cyclotron and intravenous radiotracer injection. Meanwhile, arterial spin labeling (ASL) MRI allows for noninvasive CBF quantification using arterial blood water as an endogenous contrast agent. ASL data acquired with one post-labeling delay (PLD) has been recommended when the PLD is longer than the arterial transit time (ATT).1 However, single-PLD may not be optimal for older participants in whom prolonged ATTs are observed and could result in CBF underestimation.2,3 Prior work has demonstrated that multi-PLD ASL may be more reliable in arterial steno-occlusive disease.4 Another study investigated short-term (15-minute) reliability and correlation between [15O]water and ASL in a group of younger cognitively normal controls.5 The purpose of this work was to evaluate the utility of multi-PLD versus single-PLD ASL in older adults (>60 years) and in Alzheimer’s disease (AD) patients using simultaneous PET/MRI and intermediate-term test-retest interval.Methods
Participants. A total of 15 individuals were included in this study: AD patients (n=3); older normal controls (oNC; n=8); and young normal controls (yNC; n=4).Acquisition. Imaging data was acquired on a simultaneous PET/MRI scanner (Siemens Biograph mMR). ASL data was acquired with a 2D EPI readout (TR/TE=4800/12 ms; in-plane spatial resolution=3.4×3.4 mm2; control/label pairs=40; slice thickness=5 mm) and a labeling duration=1780 ms, separately for four post-labeling delays (PLDs)=1800, 2000, 2200, and 2400 ms. A subset (n=11: 3 AD, 5 oNC, 3 yNC) of participants underwent [15O]water PET during the same session. Another subset (n=5: 4 oNC and 1 AD) was scanned with MRI twice in a 4-week period to assess intermediate-term reliability.
Processing. For ASL data, motion correction was performed6, and an equilibrium magnetization (M0) image was estimated using a scaling of the mean control image.1 CBF was calculated with FSL BASIL7 separately for the single-PLD and multi-PLD approaches. For single-PLD, ASL data acquired at PLD=1800 ms was used with a one-compartment model.1 For multi-PLD, data acquired at all four PLDs was used with a two-compartment model.7 For PET data, the [15O]water blood-brain barrier radioligand delivery index (K1; analogous measure to CBF) was estimated using a one-tissue compartmental model with image-derived input functions.
Analyses. First, we investigated the intermediate-term test-retest reliability of each ASL using Bland-Altman plots and intra-class correlation (ICC) analysis with a two-way model. Next, we assessed the correlation between CBF estimates from each ASL approach relative to [15O]water K1 using Spearman’s correlations. This assessment was performed using regions-of-interest (ROIs) delineated with anatomical segmentations and a vascular flow territory atlas.
Results
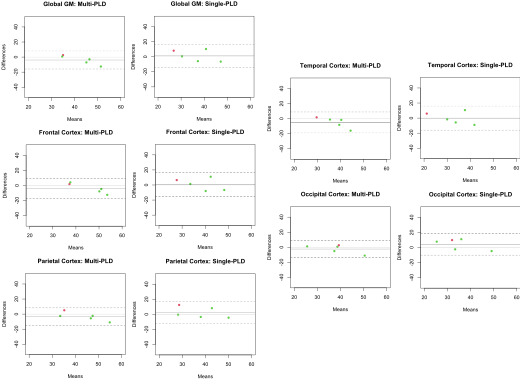
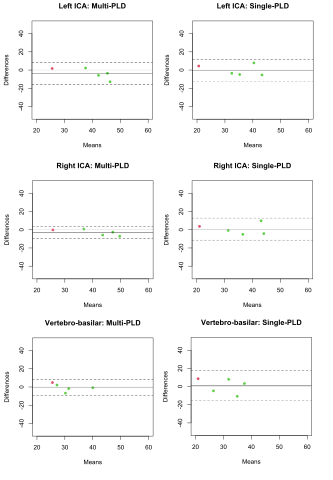
A summary of demographic and cognitive information is provided in Figure 1.Test-retest reliability. Overall, multi-PLD ASL produced similar reliability compared to single-PLD ASL across anatomical (ICC: 0.36 [temporal]-0.82 [occipital]) and vascular ROIs. However, the associated 95% confidence intervals for the ICC values were narrower for multi-PLD (range: -0.34-0.98) compared to single-PLD (range: -0.62-0.96) in all ROIs (Figure 2). Similarly, the Bland-Altman analyses suggested minimal bias for both approaches, but lower variability for multi-PLD (test-retest interquartile range: -8.3 to 1.8) than single-PLD (test-retest interquartile range: -6.7 to 9.8; Figure 3 and Figure 4).
Comparison with [15O]water-PET. Multi-PLD ASL CBF exhibited higher Spearman’s ρ in the frontal, parietal, and temporal lobes with [15O]water (ρ>0.66) compared to single-PLD (ρ>0.51, Figure 5). Weak correlations were observed in the occipital lobe for both approaches (ρ<0.1). In addition, multi-PLD CBF showed nominally higher associations with [15O]water in the left and right internal-carotid-artery territories (ρ>0.75) compared to single-PLD ASL (ρ>0.71). Weak correlations were observed in the vertebro-basilar territory for both approaches (ρ<0).
Discussion
We found that multi-PLD ASL showed significant intermediate-term reliability in global gray matter, three anatomically-defined cortical lobes, and vascular flow territories compared to single-PLD ASL over a period of approximately 4 weeks. In addition, multi-PLD ASL exhibited higher nominal correlation coefficients with [15O]water PET than those from single-PLD ASL in global gray matter, three anatomically-defined lobes, and two functionally-defined flow territories. Notably, we observed low correlation between ASL CBF values and [15O]water PET in the vertebro-basilar territory and occipital lobe and low test-retest reliability of ASL CBF values in the temporal lobe compared to other brain regions.Conclusion
Our findings are consistent with previous studies conducted in younger adults and in patients with steno-occlusive diseases that have reported on the benefit of multi- versus single-PLD ASL. Furthermore, our findings suggested a regional dependence on the reliability of ASL CBF values and their correlation with PET that could suggest that the benefit of multi-PLD ASL may be dependent on clinical application.Acknowledgements
The study is supported by the following funding sources from the National Institutes of Health (NIH)/National Institute on Aging (NIA): NIH/NIA R01AG050436; NIH/NIA K99AG081457; and NIH/NIA K01AG070318.References
1. Alsop DC, Detre JA, Golay X, Günther M, Hendrikse J, Hernandez-Garcia L, Lu H, MacIntosh BJ, Parkes LM, Smits M, et al. Recommended implementation of arterial spin-labeled perfusion MRI for clinical applications: A consensus of the ISMRM perfusion study group and the European consortium for ASL in dementia. Magn Reson Med. 2015;73:102-116. doi: 10.1002/mrm.25197
2. Juttukonda MR, Li B, Almaktoum R, Stephens KA, Yochim KM, Yacoub E, Buckner RL, Salat DH. Characterizing cerebral hemodynamics across the adult lifespan with arterial spin labeling MRI data from the Human Connectome Project-Aging. Neuroimage. 2021;230:117807. doi: 10.1016/j.neuroimage.2021.117807
3. Dai W, Fong T, Jones RN, Marcantonio E, Schmitt E, Inouye SK, Alsop DC. Effects of arterial transit delay on cerebral blood flow quantification using arterial spin labeling in an elderly cohort. J Magn Reson Imaging. 2017;45:472-481. doi: 10.1002/jmri.25367
4. Fan AP, Khalighi MM, Guo J, Ishii Y, Rosenberg J, Wardak M, Park JH, Shen B, Holley D, Gandhi H, et al. Identifying Hypoperfusion in Moyamoya Disease With Arterial Spin Labeling and an [Stroke. 2019;50:373-380. doi: 10.1161/STROKEAHA.118.023426
5. Dolui S, Fan AP, Zhao MY, Nasrallah IM, Zaharchuk G, Detre JA. Reliability of arterial spin labeling derived cerebral blood flow in periventricular white matter. Neuroimage Rep. 2021;1. doi: 10.1016/j.ynirp.2021.100063
6. Oakes TR, Johnstone T, Ores Walsh KS, Greischar LL, Alexander AL, Fox AS, Davidson RJ. Comparison of fMRI motion correction software tools. Neuroimage. 2005;28:529-543. doi: 10.1016/j.neuroimage.2005.05.058
7. MA C, AR G, B W, MV W. Variational Bayesian inference for a non-linear forward model. IEEE Transactions on Signal Processing. 2009;57:223-236.
Figures