1990
Reliability of Deep Learning-based MR Image Reconstruction for Cortical Segmentation, Thickness and Intracortical Myelin Mapping1Health Systems, Philips Healthcare, Seoul, Korea, Republic of, 2Department of Radiology, Yongin Severance Hospital, Yonsei University College of Medicine, Yongin, Korea, Republic of
Synopsis
Keywords: AI/ML Image Reconstruction, Validation
Motivation: SmartSpeed AI, deep learning-based MR image reconstruction method can be used for scan acceleration, but its clinical applicability for studying brain volumetry and/or cortical myelin has not been investigated.
Goal(s): This study was aimed to quantitatively evaluate the reliability for estimates of cortical thickness and myelin estimated from SmartSpeed AI reconstruction.
Approach: Segmentation performance was evaluated using Dice coefficient and Hausdorff distance and the reliability of estimation for cortical thickness and myelin was assessed using intraclass correlation coefficient.
Results: Comparable segmentation accuracy and reliable estimates of cortical thickness and myelin were obtained from relatively high acceleration factor with SmartSpeed AI reconstruction.
Impact: SmartSpeed AI reconstruction enabled accurate cortical segmentation, and the reliable estimation of cortical thickness and intracortical myelin, suggesting the validity of its clinical applicability with reduced scan time.
INTRODUCTION
Myelin is an essential component for healthy brain function. Its significant roles in the brain have been well recognized in the neuroimaging research community. However, less attention has been being paid to intracortical myelin content as cerebral cortex mostly contains neural cell body and/or dendrites. Given the fact of relatively low MR sensitivity, multi-echo T2 relaxometry-based myelin water imaging has limited applicability in detection of intracortical myelin. A novel and simple method for mapping intracortical myelin contents has been proposed, which is based on T1-weighted (T1w) and T2-weighted (T2w) MRI.1 And the resulting intracortical myelin maps are closely matched with histopathological cytoarchitectonic results.1 One of concerns for intracortical myelin mapping is the requirement of both high-resolution 3D T1w and 3D T2w data, which may take long scan time in clinical practice. Recently, SmartSpeed AI, a physics-driven type deep learning reconstruction method2 was introduced to enable substantial scan time reduction while maintaining image quality. Here we quantitatively evaluate the effects of SmartSpeed AI reconstruction on test-retest reliability of intracortical myelin mapping as well as cortical thickness (CTh) estimates.METHODS
Ten healthy volunteers (4 males) were included in this study. All participants were scanned using 3T MRI scanner (Elition X, Philips Healthcare). The 3D T1w images were acquired using FFE sequence with varying acceleration factor (TR/TE=4.5/2.0 msec; 1mm isotropic resolution; no acceleration (reference scan), accelerations factor: 2 and 4). A total of 5 datasets were reconstructed using vender-provided CS-SENSE (CS) or SmartSpeed AI (CS-AI) on the scanner. The 3D T2w images were acquired using TSE sequence with following parameters: TR/TE=2500/274 msec, CS:6, 1 mm isotropic resolution. The CTh and intracortical myelin were estimated using modified HCP processing pipeline.3 Overall image quality was evaluated using peak SNR (PSNR) and structural similarity index measure (SSIM). And the accuracy of cortical segmentation was assessed using Dice similarity coefficients (DSC) and average Hausdorff distance (HD). Lastly, CTh and myelin are evaluated using intraclass correlation coefficient (ICC) to assess both the degree of agreement between measurements.4 The DSC, HD and ICC values were calculated separately for each cortical structure based on Desikan-Killiany atlas.RESULTS
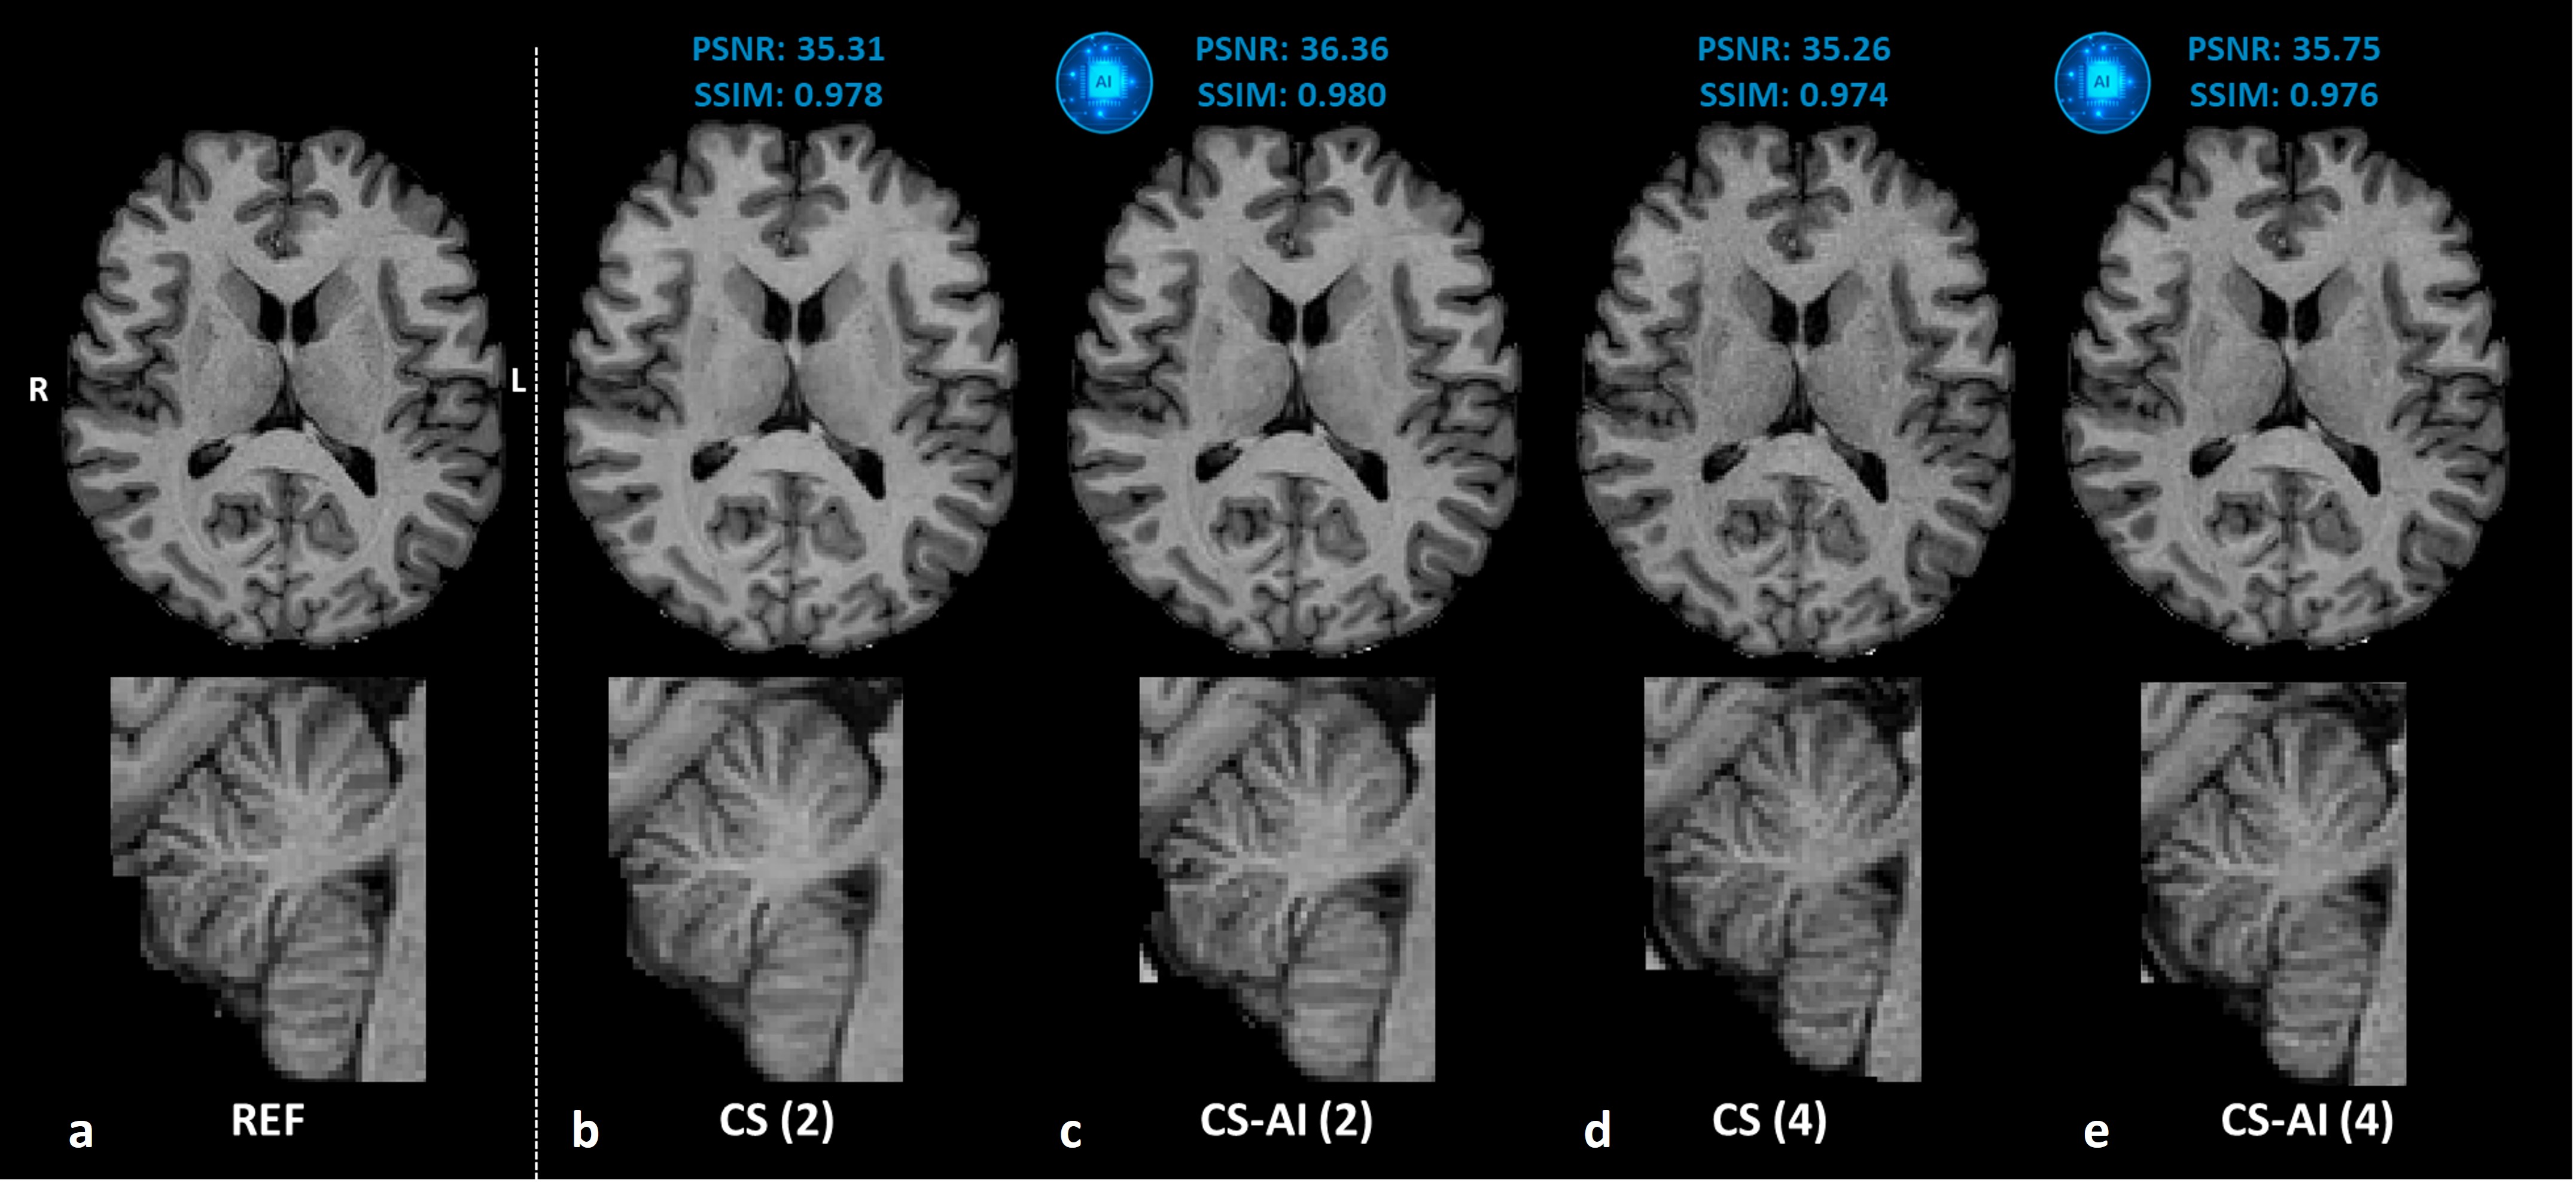
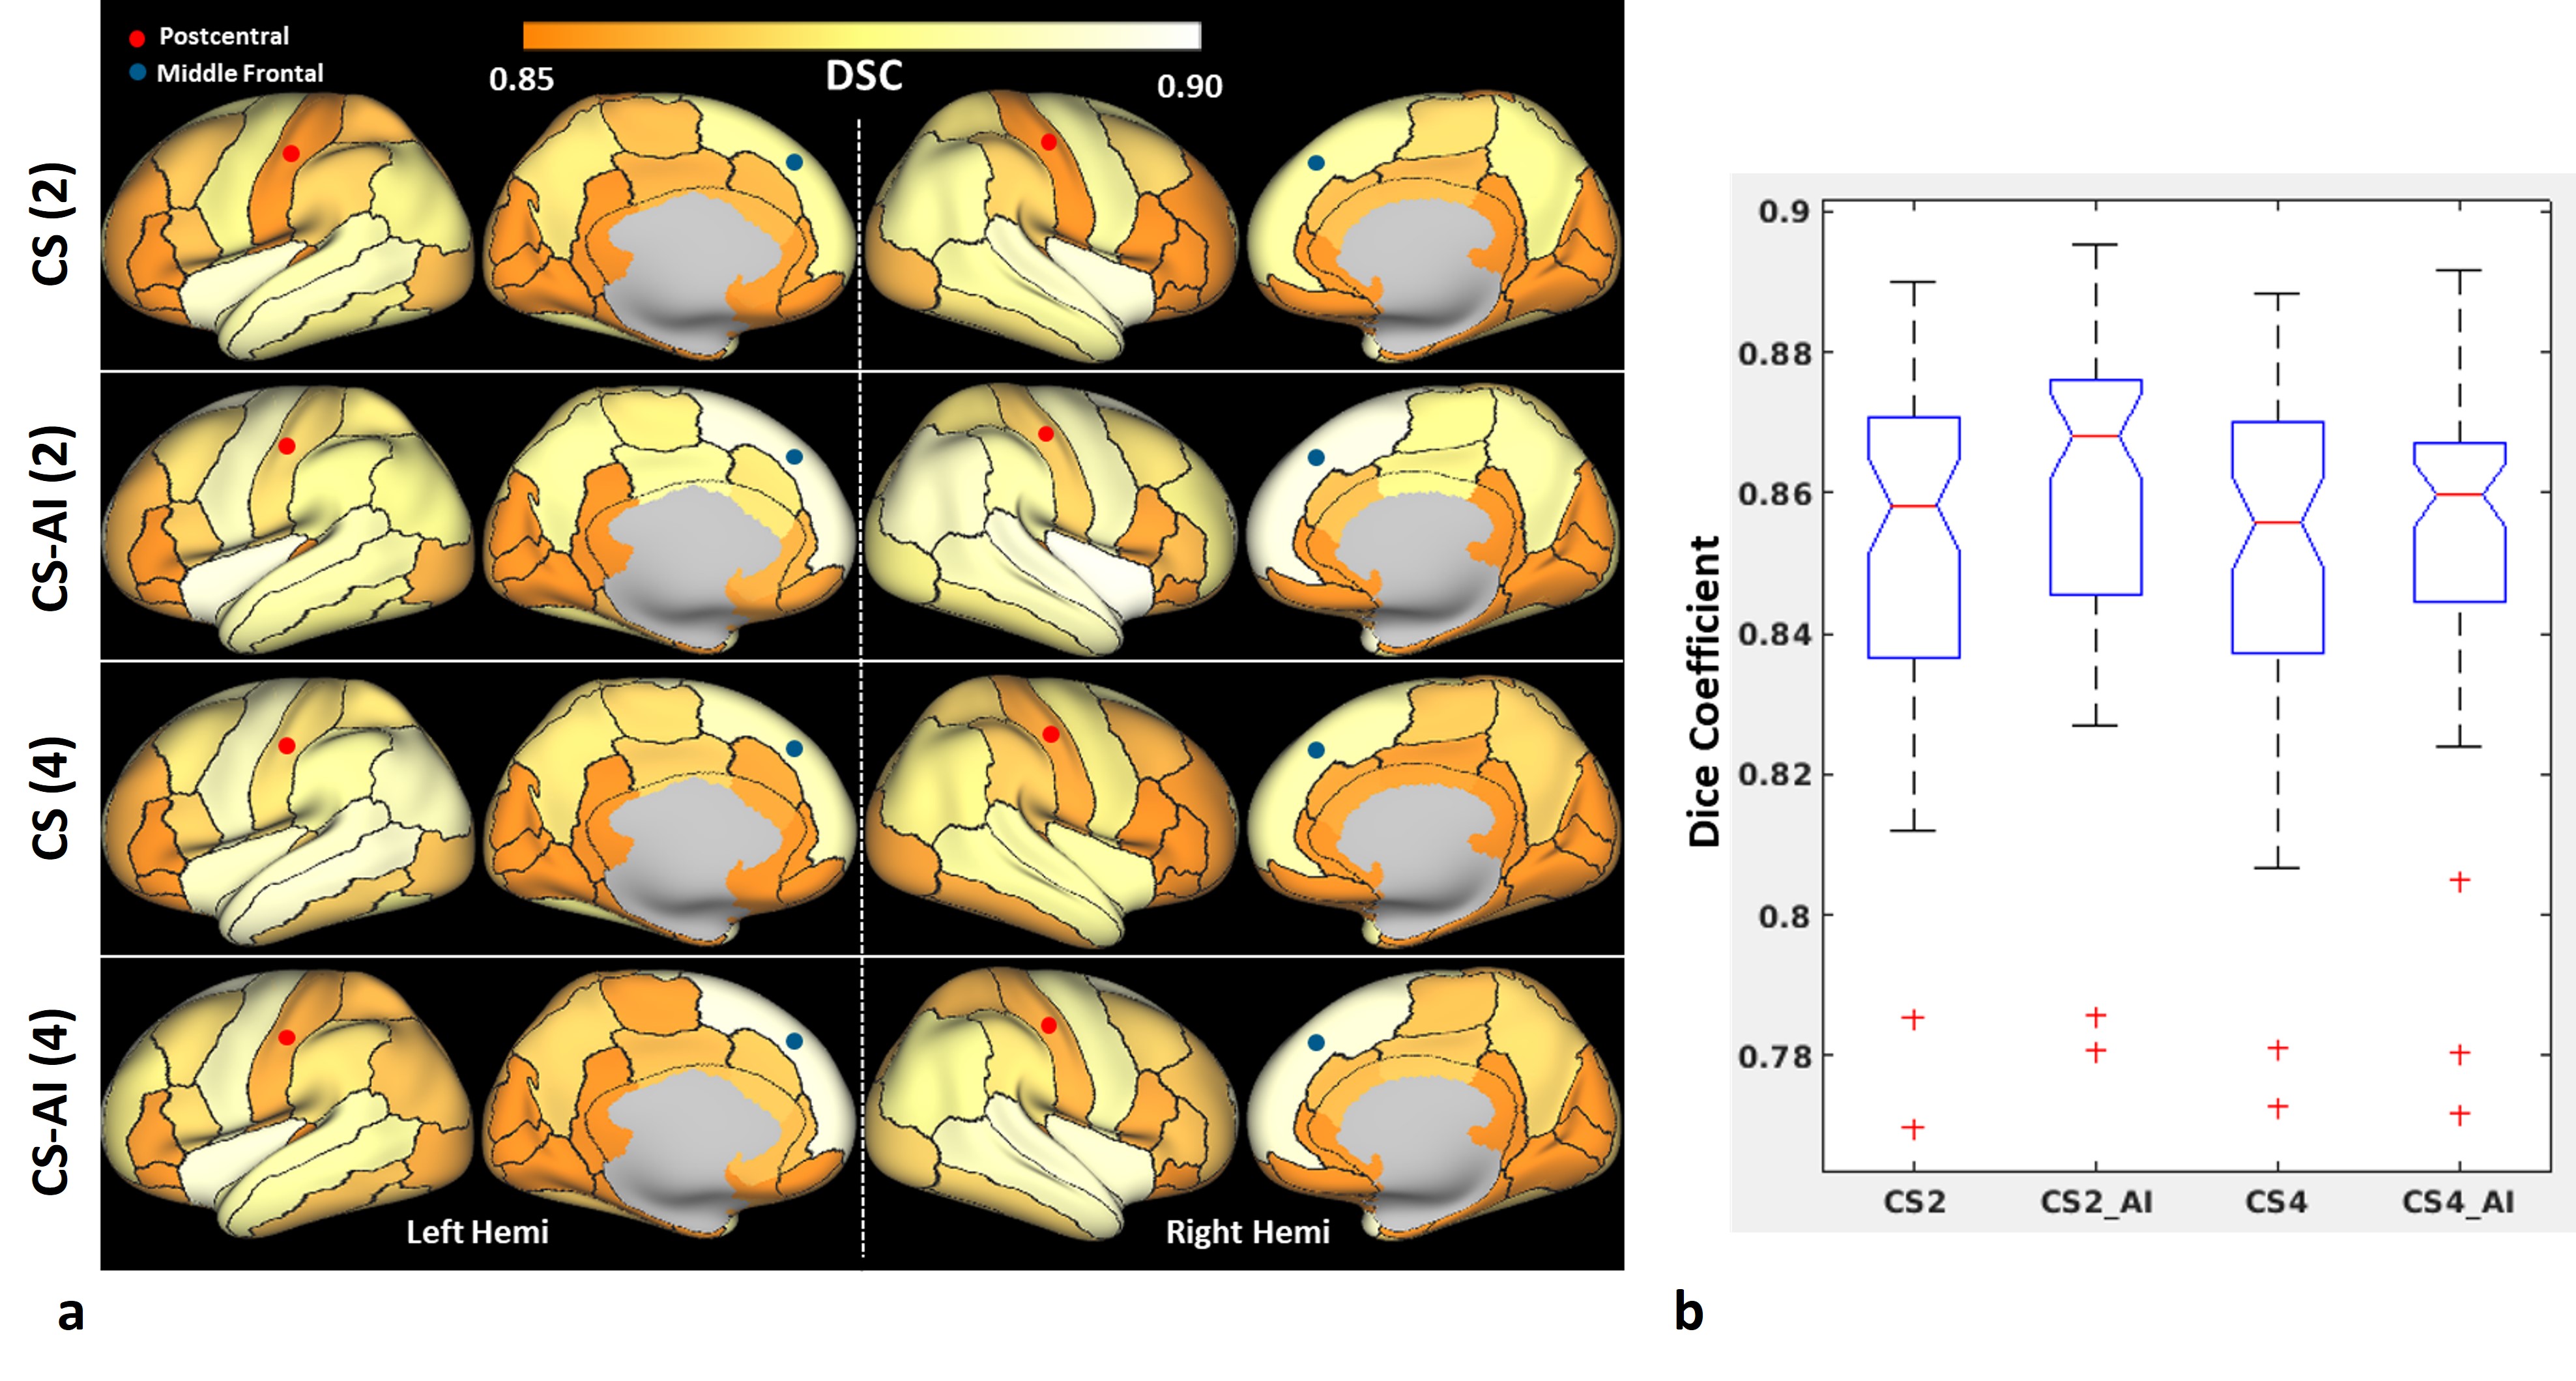
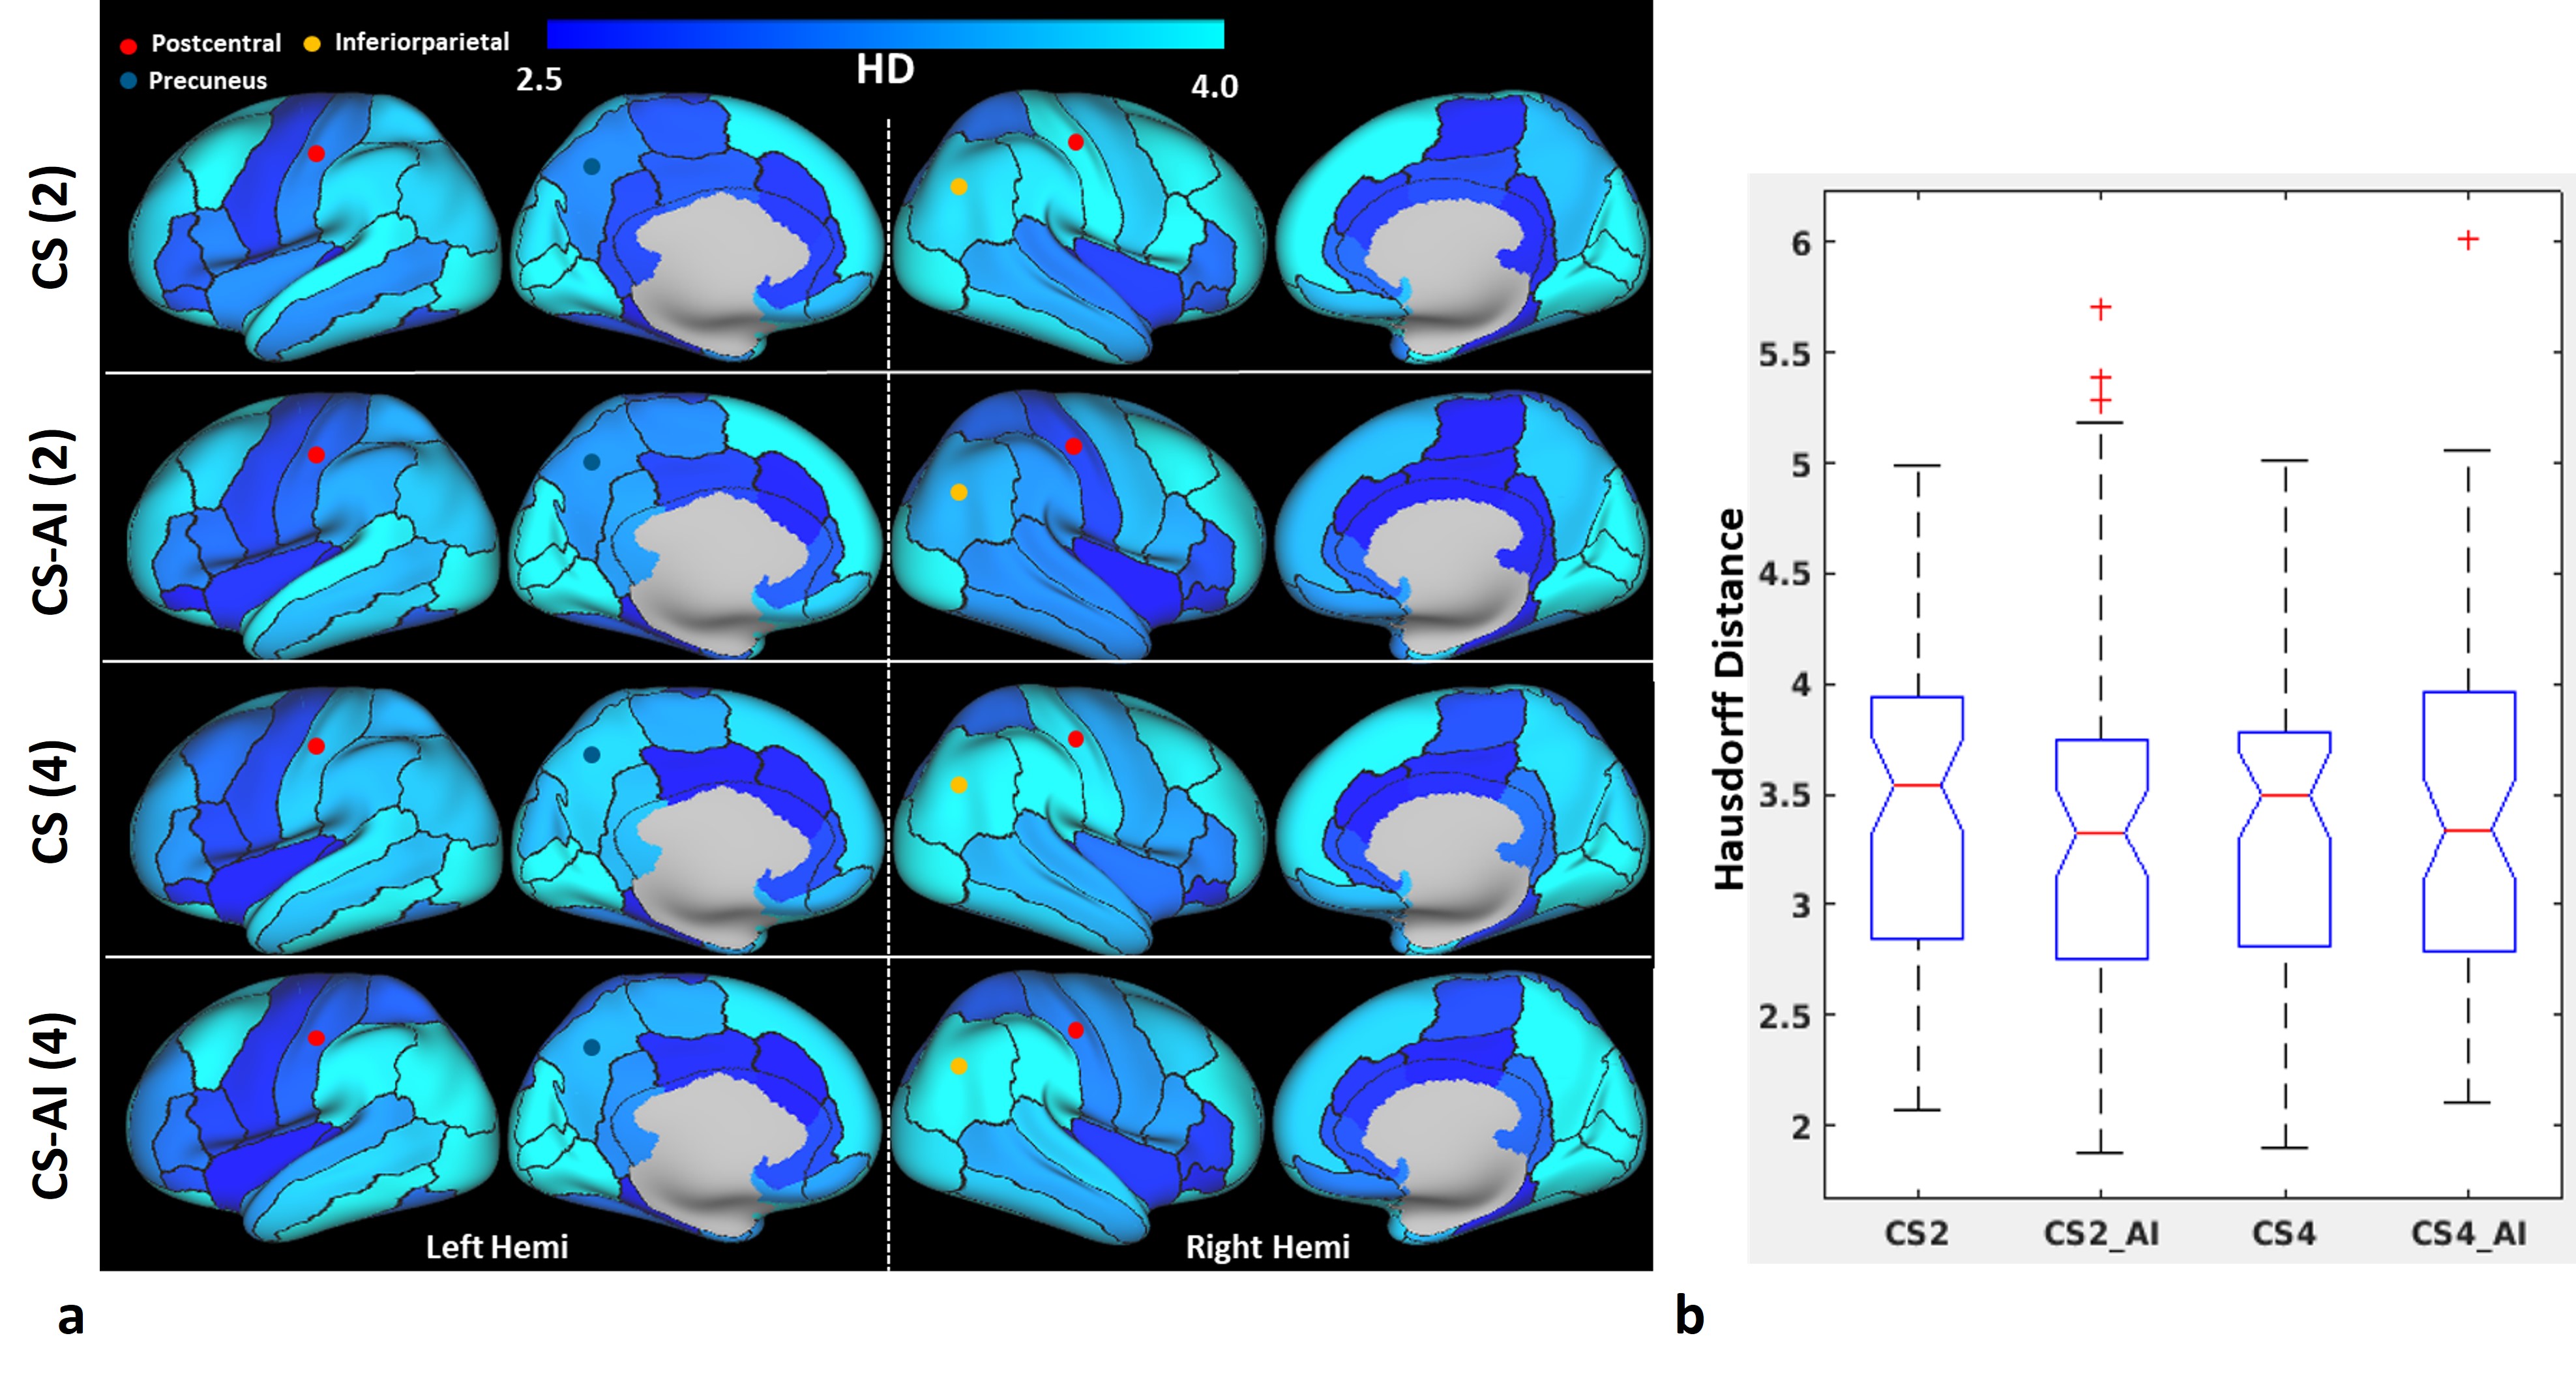
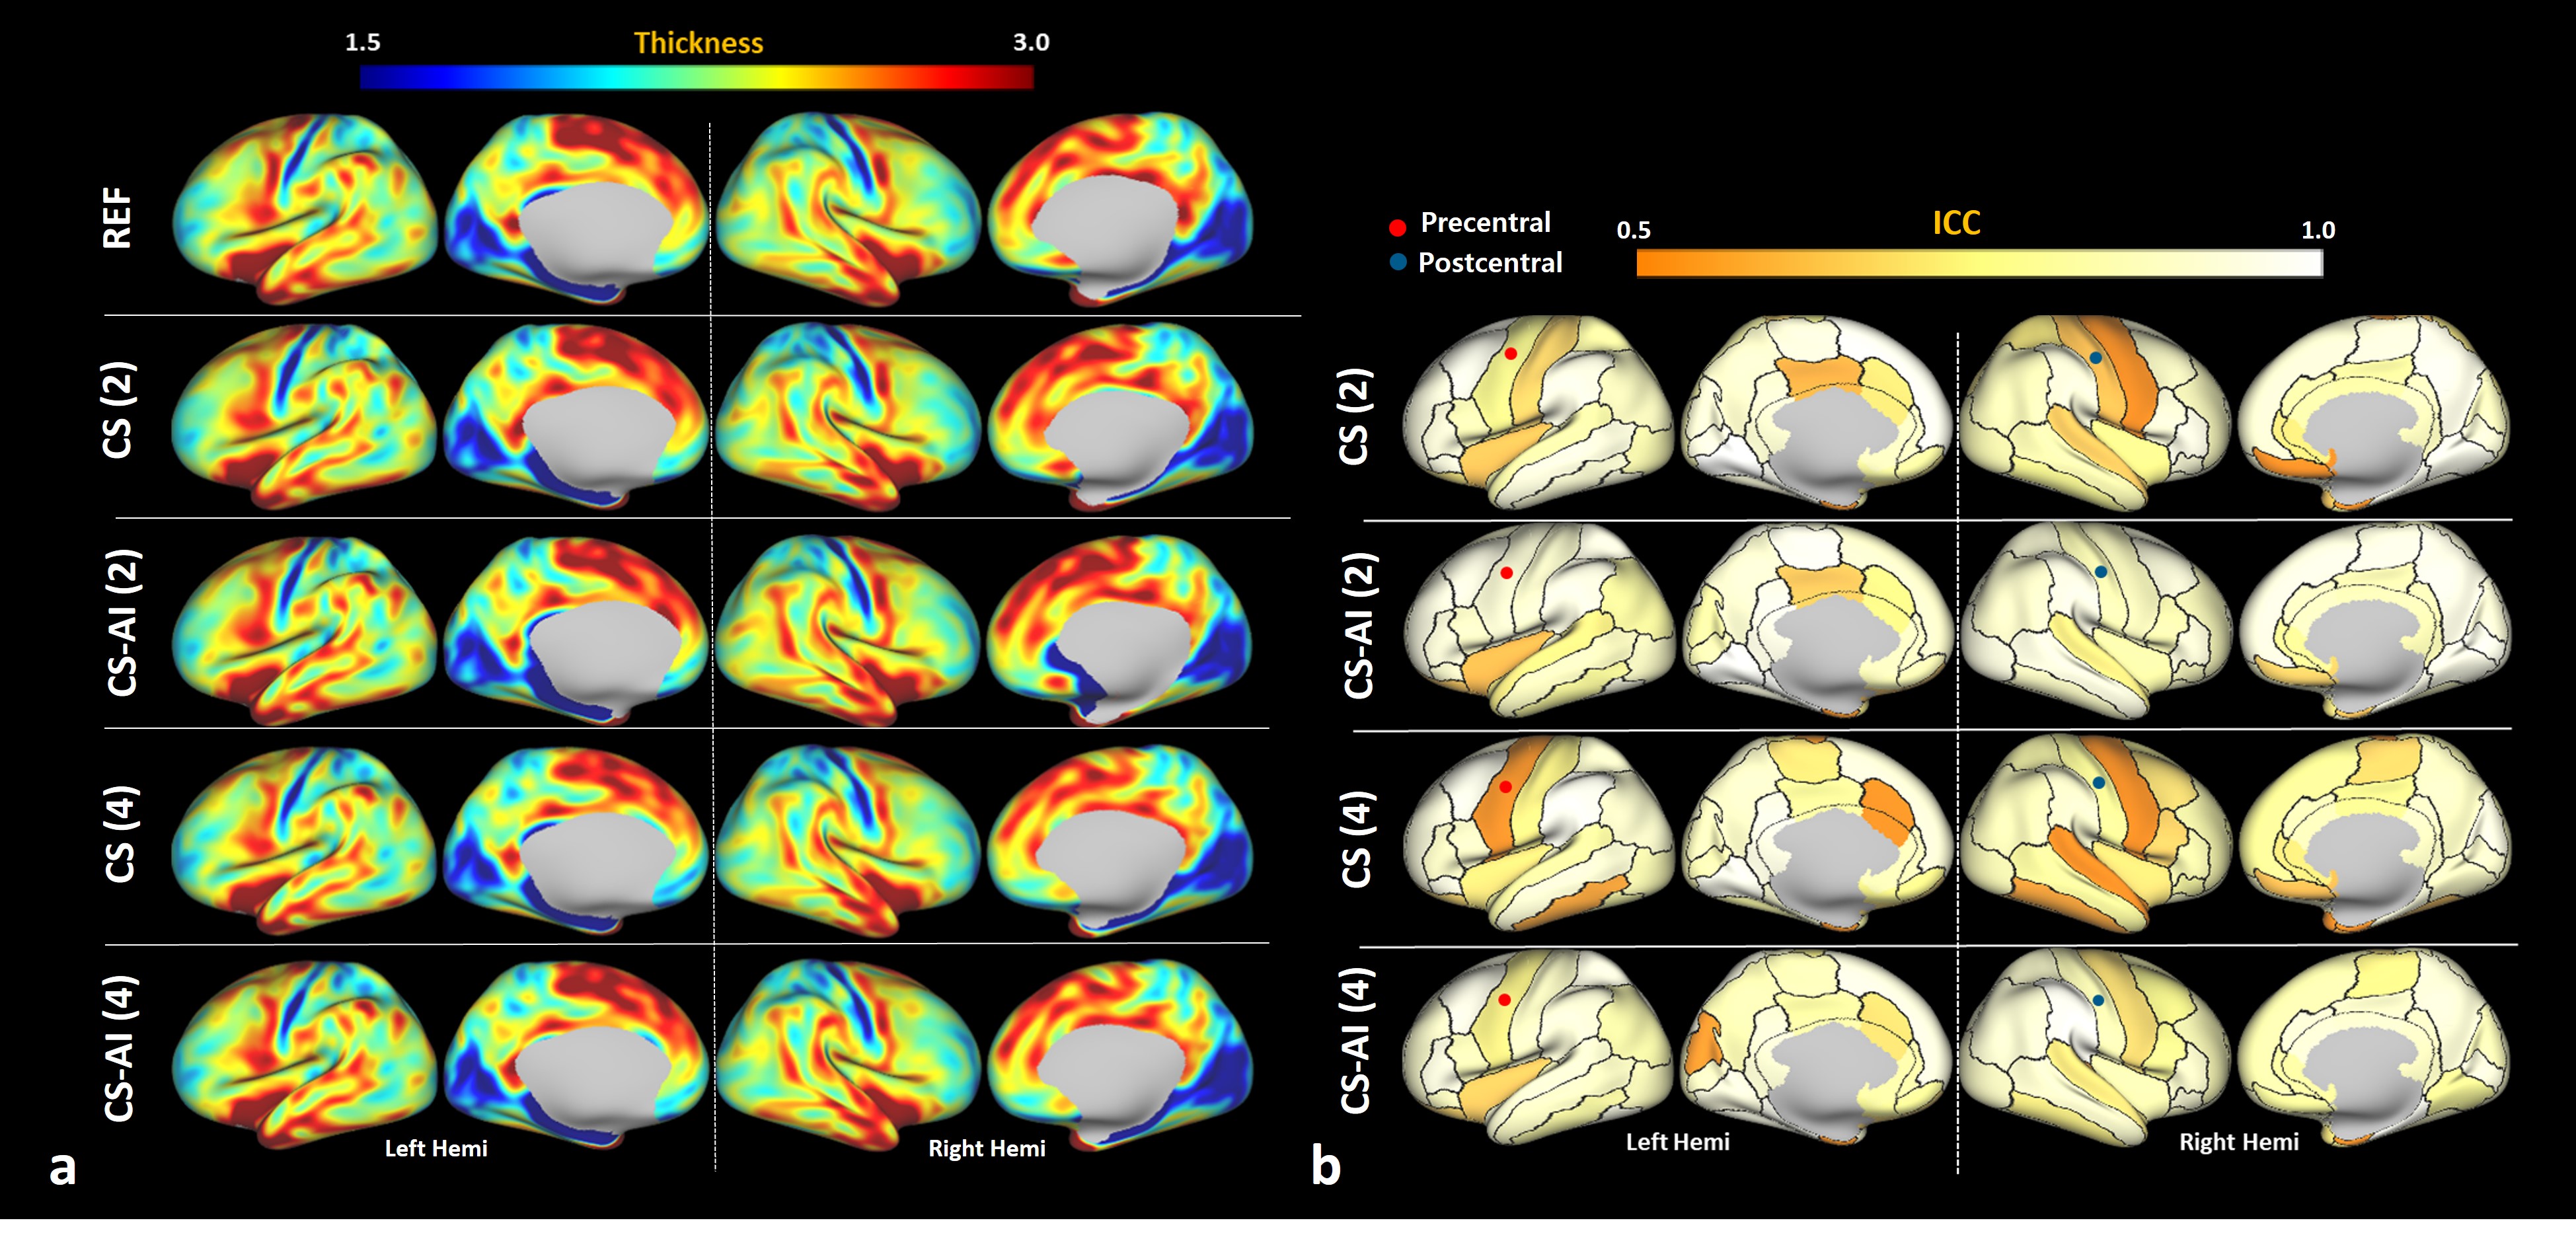
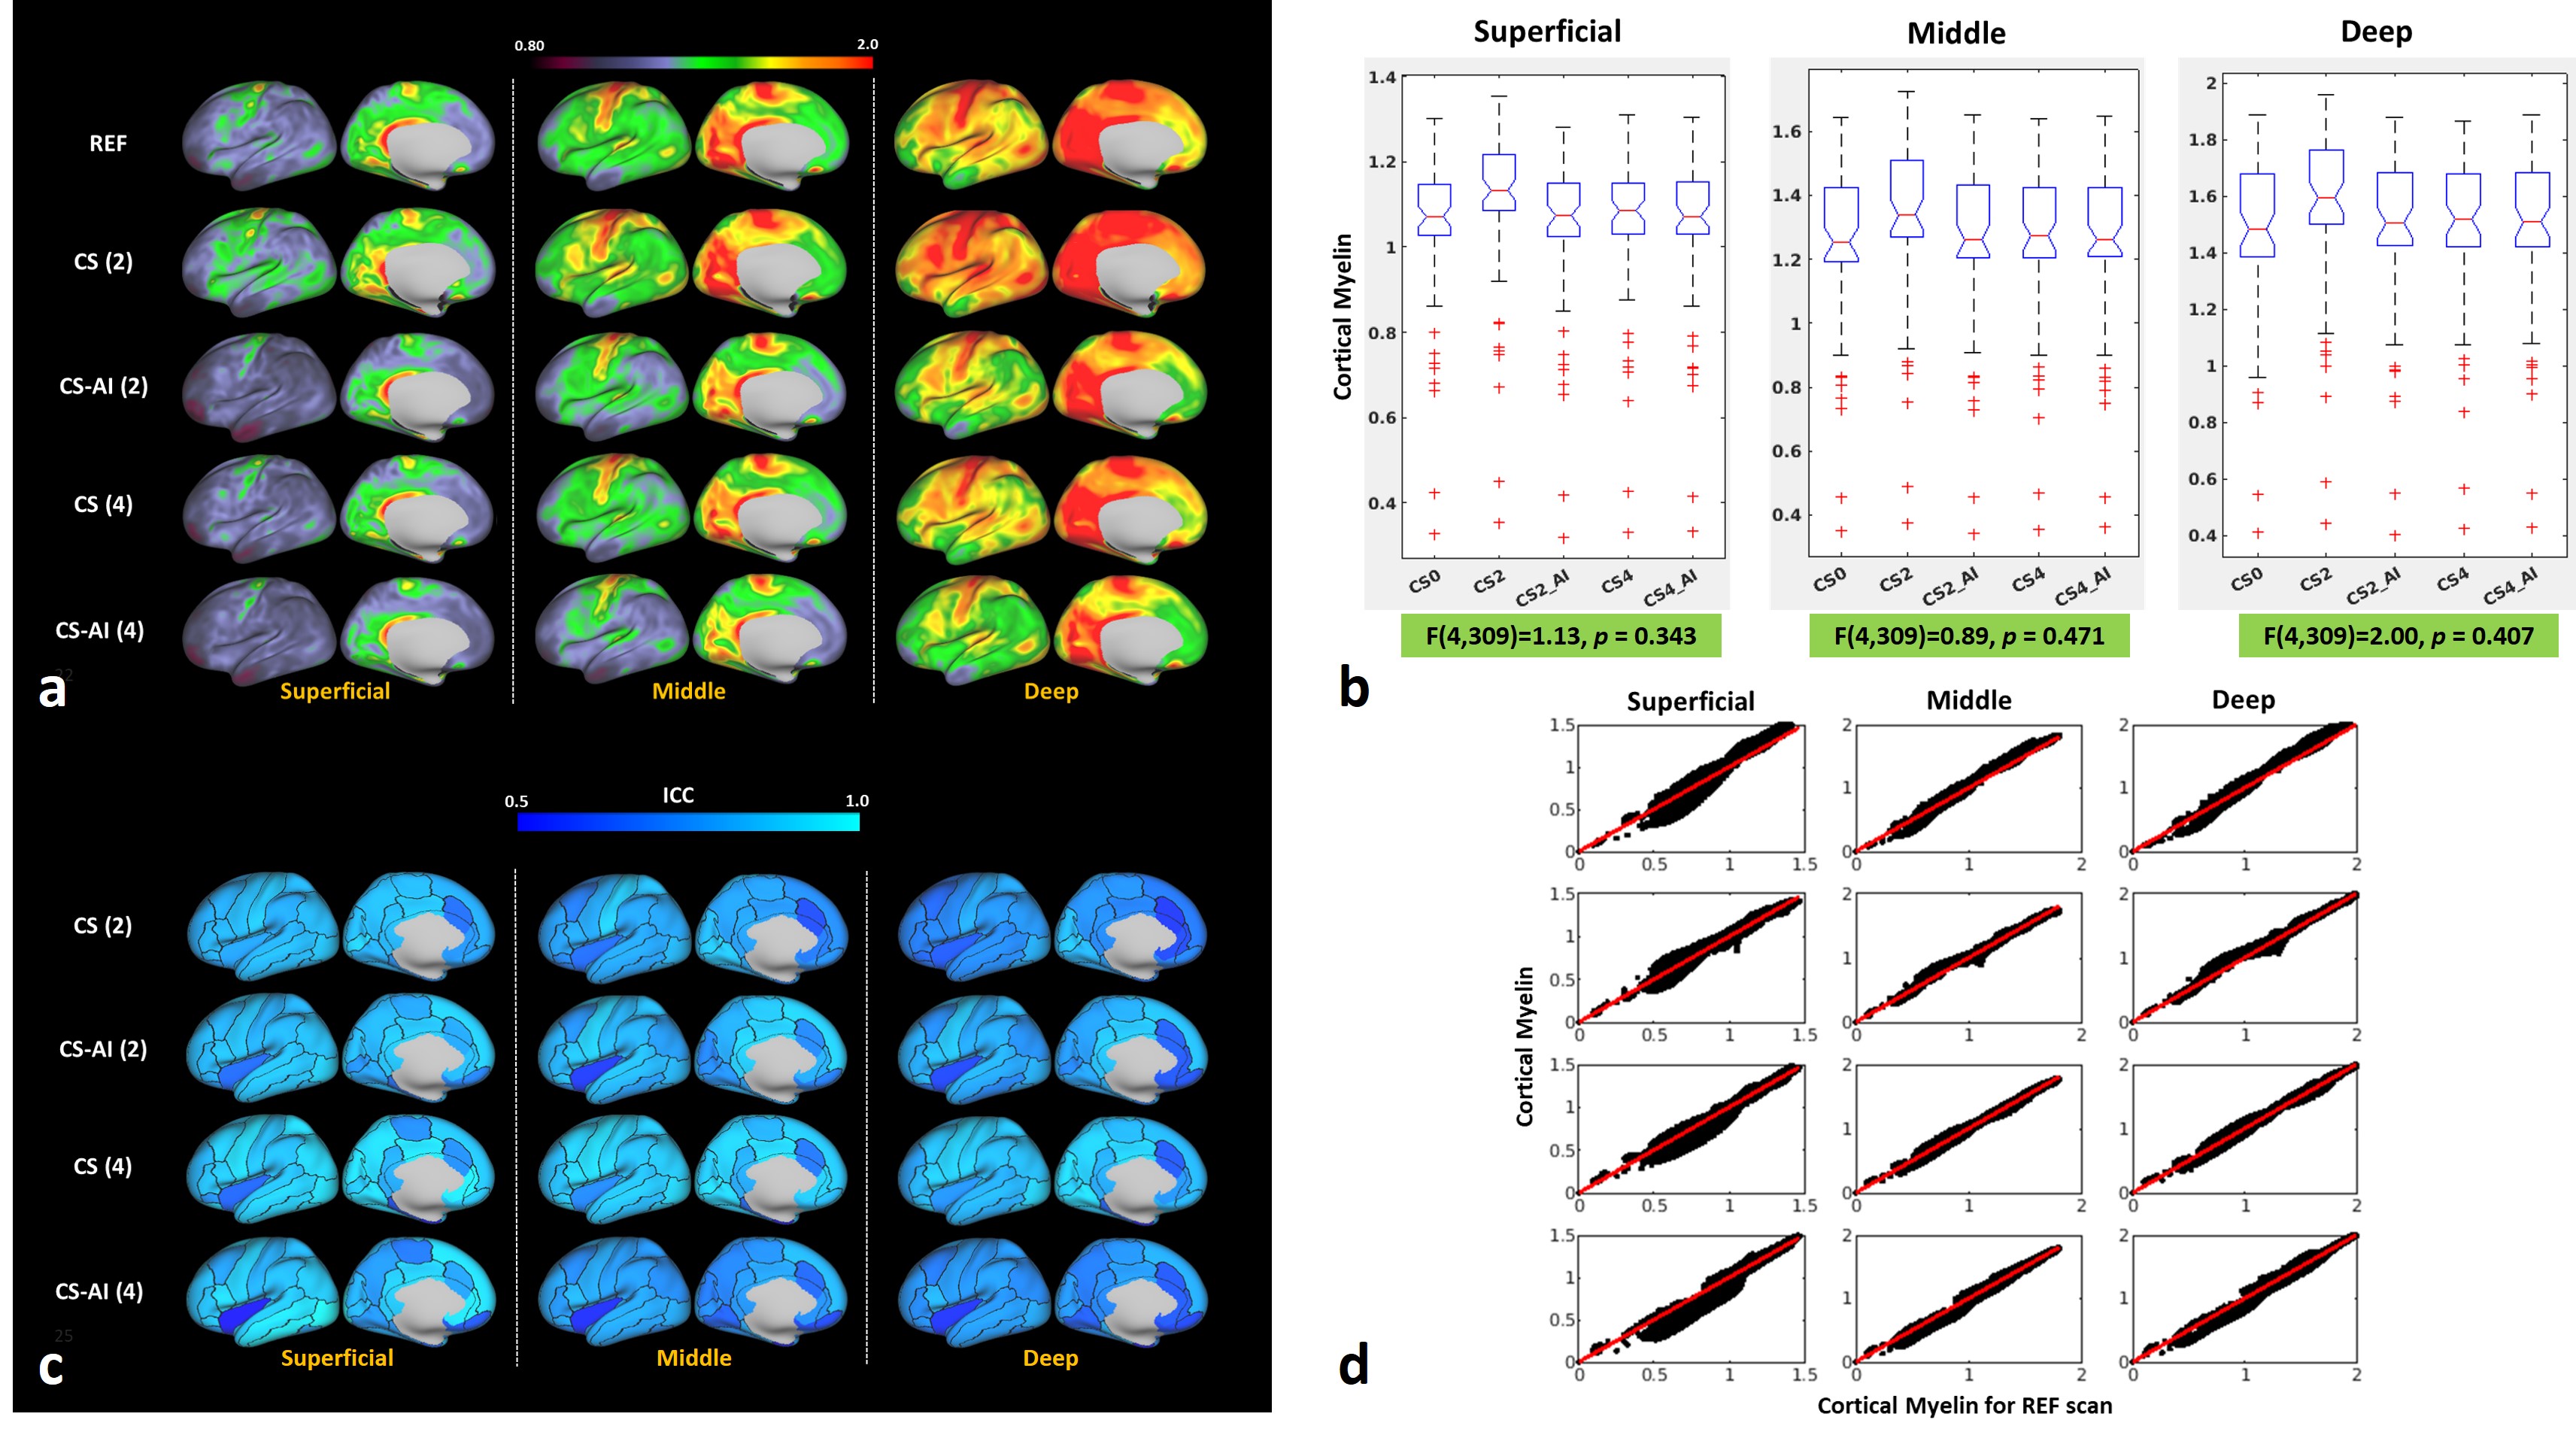
Figure 1 shows the representative T1w images obtained from a healthy volunteer using different accelerations and reconstruction methods. Quantitative evaluations using PSNR and SSIM values revealed no significant differences among the scans (data not shown). We further calculated average DSC and HD on 62 cortical regions (31 per hemisphere) and evaluated the segmentation accuracy of each scan against reference. For DSC, we found consistent segmentation performance for each ROI across the scans (Figure 2), and the average DSC values across subjects were not significantly different among the scans (One-way ANOVA test: F(3,247)=1.57, p=0.198). For evaluation of segmentation boundaries, average HD was computed for each cortical region. The overall lowest average HD values are observed in CS-AI(2) scan (Figure 3). However, there were no significant differences in average HD values across the subjects between the scans (F(3,247)=0.19, p = 0.905). Moreover, we assessed the degree of absolute agreement among the measurements for CTh and intracortical myelin. For visual inspection, representative CTh maps are shown in Figure 4. As expected, CS-AI(2) scan shows the overall highest ICC values (mean±SD: 0.85±0.12) while CS(4) scan has the overall lowest ICC values (0.77±0.16) on the estimates of CTh. It should be noted that the average ICC value for CS-AI(4) scan (0.82±0.14) is comparable to that of CS(2) scan (0.82±0.13). For intracortical myelin, we determined superficial, middle and deep cortical layers and estimated myelin contents in three cortical layers. Representative cortical layer-dependent myelin maps are shown in Figure 5-(a). The myelin contents computed from each cortical layer were not significantly different among the scans (Figure 5-b). The average ICC values are in similar ranges among the scans (Mean range: 0.65–0.85), but the overall highest ICC values are observed for superficial myelin (Figure 5-c). Interestingly, we found the strong correlations of myelin between reference and accelerated scans in all cortical layers (r>0.99, Figure 5-d).DISCUSSION AND CONCLUSION
We demonstrated the impacts of SmartSpeed AI reconstruction on the reliability of cortical segmentation, thickness and myelin contents using quantitative metrics. We found that PSNR, SSIM, DSC and HD values computed from CS-AI(4) scan were comparable to CS(2) scan, suggesting accurate cortical segmentation achievable with SmartSpeed AI reconstruction. We further validated it on the estimates of CTh and myelin using ICC, and found good-to-excellent agreement for CTh and moderate-to-good agreement for cortical myelin with CS-AI(4) scan. In conclusion, SmartSpeed AI reconstruction enables accurate cortical segmentation, and the estimation of CTh and intracortical myelin with reduced scan time.Acknowledgements
No acknowledgement found.References
1. Glasser MF and Van Essen DC. Mapping Human Cortical Areas In Vivo Based on Myelin Content as Revealed by T1- and T2-Weighted MRI. J Neurosci 2011; 31(32):11597-616.
2. Pezzotti N, Yousefi S, Elmahdy MS et al., An Adaptive Intelligence Algorithm for Undersampled Knee MRI Reconstruction. IEEE Access 2020;8: 204825-38.
3. Glasser MF, Sotiropoulos SN, Wilson JA et al., The minimal preprocessing pipelines for the Human Connectome Project. NeuroImage 2013;80:105-24.
4. McGraw KO, Wong SP. Forming inferences about some intraclass correlation coefficients. Psychol Methods. 1996;1:30–46.
Figures