1985
Application and Assessment of Deep Learning to Routine 2D T2 FLEX Spine Imaging at 1.5T1GE HealthCare, Boston, MA, United States, 2Department of Radiology, Harvard Medical School, Beth Israel Deaconess Medical Center, Harvard Medical School, Boston, MA, United States
Synopsis
Keywords: AI/ML Image Reconstruction, Image Reconstruction, 2D T2 FLEX, Spine
Motivation: Deep learning reconstruction in spine imaging has become widely available, but diagnostic quality and quantitative measurements still need to be verified in the clinical setting.
Goal(s): Our goal was to validate application of deep learning to 2D FLEX spine imaging at 1.5T via IQ assessment and noise characterization.
Approach: DL and conventionally reconstructed images were assessed by three radiologists. Noise characteristics were evaluated by calculation of total variation and number of detected edges. Fat fraction was also calculated.
Results: The radiologists preferred DL in majority of cases (79.5%), with noise noticeably lower in DL images. The fat fraction measurements were very similar.
Impact: The application of DL to routine 2D FLEX imaging in the spine provides enhanced diagnostic quality and decreased noise without sacrificing quantitative fidelity. Therefore, the application of DL can be confidently used at 1.5T in the clinic for patient care.
Introduction
2D T2 FSE is an essential part of routine spine MRI protocols, providing information on bone and soft tissue characteristics, inflammation, and fractures1–3. Fat Suppression is routinely utilized, with one option being a DIXON-type approach to get optimal water/fat separation1,4. Recently, a commercial deep learning (DL) reconstruction (AIR™ Recon DL, GE Healthcare) was released for 2D FLEX (GE HealthCare’s version of DIXON), which allowed for improved signal-to-noise ratio, reduced ringing, and increased sharpness5. While there has already been clinical adoption of the DL technology for this sequence in the clinic6, a more rigorous analysis would be helpful in increasing radiologist confidence of the DL enhanced images. The purpose of this study was to look at diagnostic image quality and quantitative metrics on DL vs. non-DL reconstructed spine 2D T2 FLEX images in the clinical setting at 1.5T.Methods
41 patients clinically indicated for cervical or lumbar spine MRI were scanned between May 2023-August 2023, and retrospectively included in this study under an IRB approved protocol. The retrospective data was gathered without sub-grouping into different disease types. All exams were performed on a 1.5T Voyager MR system (GE HealthCare, WI, USA). 2D T2 Flex was acquired as part of a routine spine (C-/T-/L-) protocol, with the following parameters: sagittal, FOV=18x27cm, matrix size=200x240, slice thickness/spacing=3/0.3mm, # of slices=28, TR/TE=4276/102ms, ETL=23, FA=160 degrees, averages=2. The commercial DL reconstruction, which is based on a Convolutional Neural Network (CNN), was applied at the end of the scan, with noise reduction set to 75%5. The raw data was saved and used to reconstruct non-DL images for comparison.Qualitative Assessment: 3 Readers (1 CAQ certified Neuroradiologist with 11 years’ experience, 1 PGY-6 neuroradiology fellow, and 1 PGY-2 diagnostic radiology resident) assessed the diagnostic confidence of DL reconstructed compared to non-DL reconstructed images for 39 of these subjects (2 could not be reviewed due to technical issues with the viewing environment). The DL and non DL images for the different phases of FLEX images (Water, In Phase, Fat) were reviewed and scored as: 0–non DL preferred, 1-DL preferred, 2–Equivalent.
Rating agreement was calculated using Fleiss’ Kappa.
Quantitative Assessment: For both DL and non-DL reconstructions, the signal-to-noise ratio (SNR), global Total Variation (TV), global number of edges, and fat fraction (FF) were calculated. TV and number of edges were chosen as representations of successful image denoising from application of DL since lower TV and fewer detected edges correlate with less image noise7–9. FF was chosen for assessment since we would hypothesize this metric should not change even after application of DL, i.e. DL should not distort such quantitative measures. While FF is not routinely used in the clinic for spine MRI, some recent publications have looked at FF as a marker for multiple myeloma10,11.
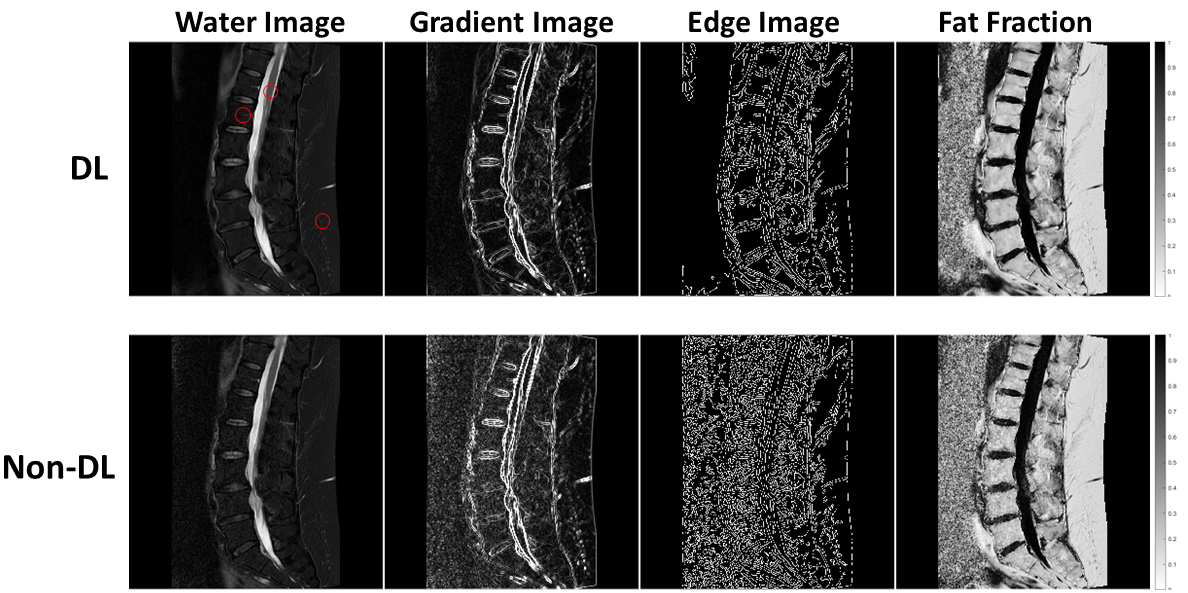
The global TV was determined by calculating the gradient across each 2D slice (imgradient function in MATLAB 2022b, MathWorks Inc., Natick, MA) and summing across all voxels. The global number of edges was calculated similarly by using the edge function in MATLAB. For each patient, a representative slice was chosen, and ROIs were drawn in a vertebral body, spinal cord, and subcutaneous fat, with fat fraction only calculated in vertebral body and subcutaneous fat due to low fat content in the spinal cord. Paired t-test was used for statistical analysis with p < 0.05 considered significant.
Results
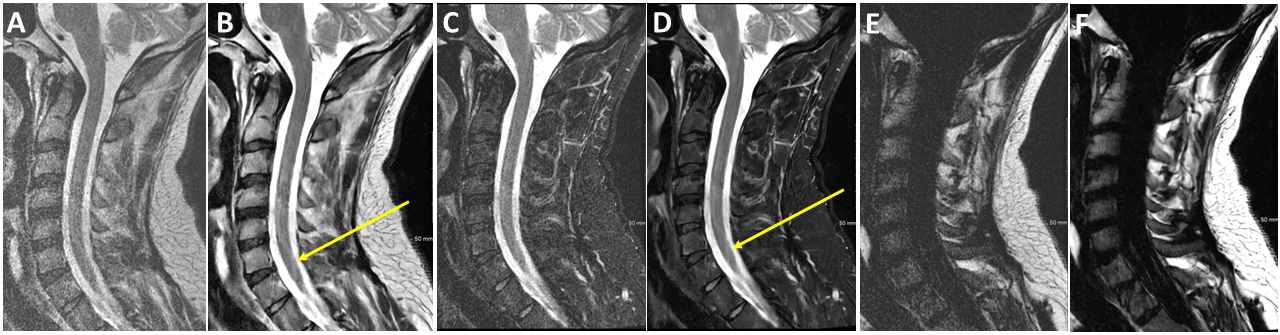
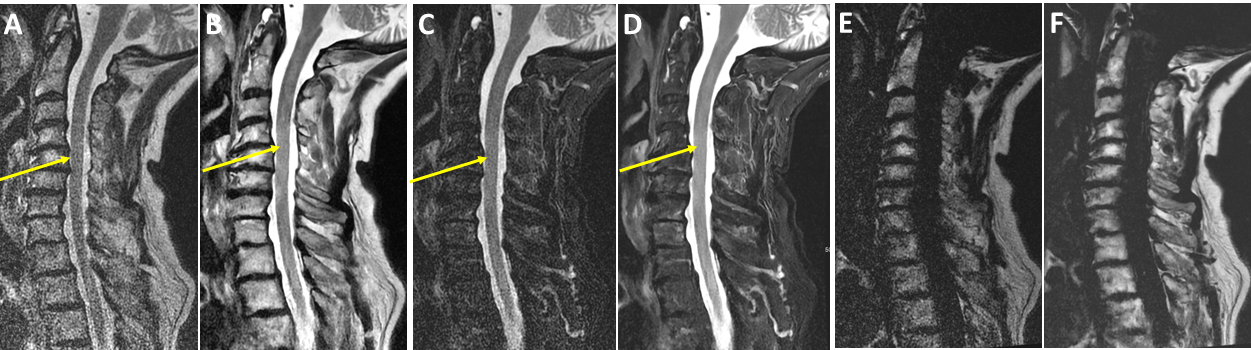
Qualitative: 79.5% of ratings found DL images to be preferred, 11% were equivalent, and 9.4% preferred the non-DL images, showing strong agreement with Fleiss’ Kappa of 0.99. See Figures 1 and 2 for example images.Quantitative: Figure 3 shows the water, gradient, edge, and fat fraction image for both DL and non-DL reconstruction from one patient. The SNR, TV, and number of edges were all significantly different (p < 0.001), with DL images having greater SNR, lower TV and fewer edges detected. FF was not statistically different in the subcutaneous fat (p = 0.25, percent difference of 2.8%), but statistically different in the vertebral body (p < 0.01), although the percent difference was only 1.4%.
Discussion and Conclusion
Qualitative analysis revealed considerable improvement in IQ with the DL reconstruction. Quantitative analysis revealed the decreased noise and improved sharpness from application of DL, leading to ~2-3x improved SNR, which is crucial at 1.5T. The mean FF across the patients were within 3%, providing confidence that quantitative measures are not altered with DL. These encouraging results warrant a continuation of the study, including increasing the cohort size, calculating CNR in cases of pathology, and exploring optimization of the protocol in terms of speed and spatial resolution.Acknowledgements
No acknowledgement found.References
1. Lee S, Choi DS, Shin HS, Baek HJ, Choi HC, Park SE. FSE T2-weighted two-point Dixon technique for fat suppression in the lumbar spine: comparison with SPAIR technique. Diagn Interv Radiol. 2018;24:175-180.2. Georgy BA, Hesselink JR. MR imaging of the spine: recent advances in pulse sequences and special techniques. American Journal of Roentgenology. 1994;162(4):923-933.
3. Vargas et al. MI. Advanced magnetic resonance imaging (MRI) techniques of the spine and spinal cord in children and adults. Insights into Imaging. 2018;9:549-557.
4. Tien RD, Olson EM, Zee CS. Diseases of the lumbar spine: findings on fat-suppression MR imaging. American Journal of Roentgenology. 1992;159:95-99.
5. Lebel RM. Performance characterization of a novel deep learning-based MR image reconstruction pipeline. August 2020. doi:10.48550/arXiv.2008.06559
6. Koch KM, Sherafati M, Arpinar VE, et al. Analysis and Evaluation of a Deep Learning Reconstruction Approach with Denoising for Orthopedic MRI. Radiology: Artificial Intelligence. 2021;3(6):e200278. doi:10.1148/ryai.2021200278
7. Rudin LI, Osher S, Fatemi E. Nonlinear total variation based noise removal algorithms ☆. Physica D: Nonlinear Phenomena. 60(1-4).
8. Block KT, Uecker M, Frahm J. Suppression of MRI Truncation Artifacts Using Total Variation Constrained Data Extrapolation. International Journal of Biomedical Imaging. 2008;2008.
9. Ruslau MFV, Pratama RA, Asmal S. Edge detection in noisy images with different edge types. IOP Conf Series: Earth and Environmental Science. 2019;343.
10. Pei XJ, Lian YF, Yan YC, et al. Fat fraction quantification of lumbar spine: comparison of T1- weighted two-point Dixon and single-voxel magnetic resonance spectroscopy in diagnosis of multiple myeloma. Diagn Interv Radiol. 2020;26:492-497.
11. Koutoulidis V, Terpos E, Papanikolaou N, et al. Comparison of MRI Features of Fat Fraction and ADC for Early Treatment Response Assessment in Participants with Multiple Myeloma. Radiology. 2022;304(1).
Figures