1983
Performance Metric for Assessment of Reconstructed Magnetic Resonance Image Phase1Biomedical Engineering, University of Calgary, Calgary, AB, Canada, 2Seaman Family MR Research Centre, Foothills Medical Centre, Calgary, AB, Canada, 3Hotchkiss Brain Institute, University of Calgary, Calgary, AB, Canada, 4O'Brien Centre for the Health Sciences, Cumming School of Medicine, Calgary, AB, Canada, 5Radiology and Clinical Neuroscience, University of Calgary, Calgary, AB, Canada, 6Electrical and Software Engineering, University of Calgary, Calgary, AB, Canada
Synopsis
Keywords: AI/ML Image Reconstruction, Data Analysis
Motivation: Many deep learning (DL) reconstruction models do not assess the reconstructed phase despite its importance in certain imaging techniques.
Goal(s): To develop a phase-specific metric and demonstrate its suitability for reconstruction assessment.
Approach: We used our developed metric to assess and analyze DL and non-DL reconstruction results in an experiment investigating the effect of coil overlap on DL reconstruction methods. The phase metric results were compared to magnitude metric results.
Results: The phase metric results were consistent with the magnitude metric results and provided useful insights into model performance.
Impact: We propose and test a phase-specific metric that can be used to assess and further the development of complex-valued DL reconstruction methods. This metric would allow for DL reconstruction methods to be applied to MR imaging techniques such as phase contrast imaging.
Introduction
Deep learning (DL) methods for MR image reconstruction have seen an increase in popularity over the last few years. Historically, focus has been on the reconstruction of magnitude images while the image phase is often not considered. Recently, complex-valued reconstructions are increasingly used,1,2 but their complete evaluation is limited by the absence of phase-specific metrics. Validating the accuracy of the reconstructed phase is important for techniques such as susceptibility-weighted and phase-contrast imaging. Common metrics such as mean squared error (MSE) and peak signal-to-noise ratio can be used to assess complex-valued reconstructions,3 but they do not specifically assess phase. Distinguishing between the magnitude and phase performance allows for a more precise understanding of strengths and weaknesses. Understanding these effects is particularly pertinent given that not all MR sequences value magnitude and phase equally. We introduce a new phase-specific metric, absolute phase disparity (APD), and illustrate its use in evaluating complex-valued DL reconstruction.Methods
The APD is defined as$$\text{APD} = \frac{ \sum |\textbf{x}|\, |\text{arg} (\textbf{x}_{pred}^* \textbf{x})|}{\sum |\textbf{x}|}$$
where x is the reference image, xpred is the predicted image, and * denotes the complex conjugate. This expression has several favorable characteristics: 1) It accounts for phase wrap because the argument x*predx is proportional to the relative phase difference despite potentially different principal arguments; 2) by weighting the APD by |x|, the the contribution of low signal regions where the phase is impacted by noise is reduced.
The APD can be modified to produce a map. For the ith pixel in the map,
$$\text{APD}_i = \frac{ |\textbf{x}_i|\, |\text{arg} (\textbf{x}_{pred,i}^* \textbf{x}_i)|}{\text{max} (|\textbf{v}|)}$$
The APD is similar in concept to the normalized absolute error (NAE), a magnitude-specific metric, which is defined as
$$ \text{NAE}_i = \frac{ N||\textbf{x}_{pred,i}| - |\textbf{x}_i||}{\sum|\textbf{x}|}$$
where N is the number of pixels, or voxels, in x. A single NAE value per image can be obtained by averaging over the map.
APD and NAE were used to assess reconstructed images in an experiment investigating the effect of coil overlap on deep learning-based reconstruction methods. NAE serves as a magnitude-specific comparison to help interpret findings. Eight-channel head coil data were synthesized in which coil element radii were increased in 1 cm increments from 8 cm to 12 cm. The Calgary-Campinas dataset4 was used to derive the synthesized data and contained 47/20/50 train/validation/test volumes from healthy subjects. Reconstruction was applied to 2D axial slices of which the central 100 were used for testing, and retrospective 2D uniform undersampling was used. The DL model architecture was a deep convolutional cascade5 adapted for multi-channel data and trained with MSE applied independently to the real and imaginary channels. The DL model was compared to conjugate gradient SENSE6 (CG-SENSE) at R = 6 and 8. The performance of each method as a function of increasing coil overlap was analyzed using the non-parametric Friedman test (α = 0.05). As appropriate, this test was followed by post-hoc one-tailed Wilcoxon signed-rank tests (α = 0.05) between adjacent levels of coil overlap. The Holm-Bonferroni method was used to correct for multiple comparisons.
Results
Table 1 summarizes performance results which are visualized in Figure 1. At R = 6, a larger NAE increase was observed in CG-SENSE compared to the DL model with increasing coil radius. Both methods show a similar, small decrease in APD. At R = 8, there was a greater divergence in method performance. CG-SENSE APD (Figure 2) and NAE (Figure 3) maps showed increased noise amplification compared to the DL model, although the DL model still shows phase and magnitude errors at the noise amplification boundaries.Discussion
The APD and NAE maps show similar patterns suggesting the phase and magnitude assessments are consistent. The patterns suggest the DL model is more reliant on the anatomy being reconstructed than CG-SENSE. The APD map intensity ranges indicate that generally, the accuracy of the reconstructed phase is highly sensitive to spatial aliasing artifacts. As expected, map values are lower in regions with low signal. Despite training the DL model on independent real and imaginary channels, APD values suggest this is an effective strategy for reconstructing phase. As many modern DL models use loss functions applied to only the magnitude image, such as the structural similarity index measure (SSIM), a question is whether this allows for accurate phase reconstruction.Conclusion
APD is an effective phase- metric that allows for the quantification and interpretation of phase reconstruction performance. APD results were consistent with the magnitude-metric, NAE, suggesting that the metric provides a reasonable phase assessment. APD has the potential to be effective in developing fully complex DL reconstruction methods.Acknowledgements
ND is supported by a Natural Sciences and Engineering Research Council (NSERC) BRAIN CREATE award, an NSERC Canada Graduate Scholarship (CGS-M), and an Alberta Graduate Excellence Scholarship (AGES). RS and RF thank NSERC for ongoing operating support for this project (RGPIN/2021-02858 and RGPIN/2021-02867). RS also acknowledges operational support from the NSERC Alliance–Alberta Innovates Advance Program.References
1 Vasudeva B, Deora P, Bhattacharya S, Pradhan P. Compressed sensing MRI reconstruction with Co-VeGAN: Complex-valued generative adversarial network. In: 2022 IEEE/CVF Conference on Applications of Computer Vision (CVPR):1779-1788; 2022.
2 Küstner T, Fuin N, Hammernik K. et al. CINENet: Deep learning-based 3D cardiac CINE MRI reconstruction with multi-coil complex-valued 4D spatio-temporal convolutions. Sci Rep. 2020;10(13710).
3 Cole E, Cheng J, Pauly J, Vasanawala S. Analysis of deep complex-valued convolutional neural networks for MRI reconstruction and phase-focused applications. Magn Reson Med. 2020;86(2):1093-1109.
4 Souza R, Lucena O, Garrafa J, et al. An open, multi-vendor, multi-field-strength brain MR dataset and analysis of publicly available skull stripping methods agreement. NeuroImage. 2018;170:482-494.
5 Schlemper J, Caballero J, Hajnal JV, Price AN, Rueckert D. A deep cascade of convolutional neural networks for dynamic MR image reconstruction. IEEE Trans Med Imaging. 2018;37(2):491-503.
6 Pruessmann KP, Weiger M, Börnert P, Boesiger P. Advances in sensitivity encoding with arbitrary k-space trajectories. Magn Reson Med. 2001;46(4):638-651.
Figures
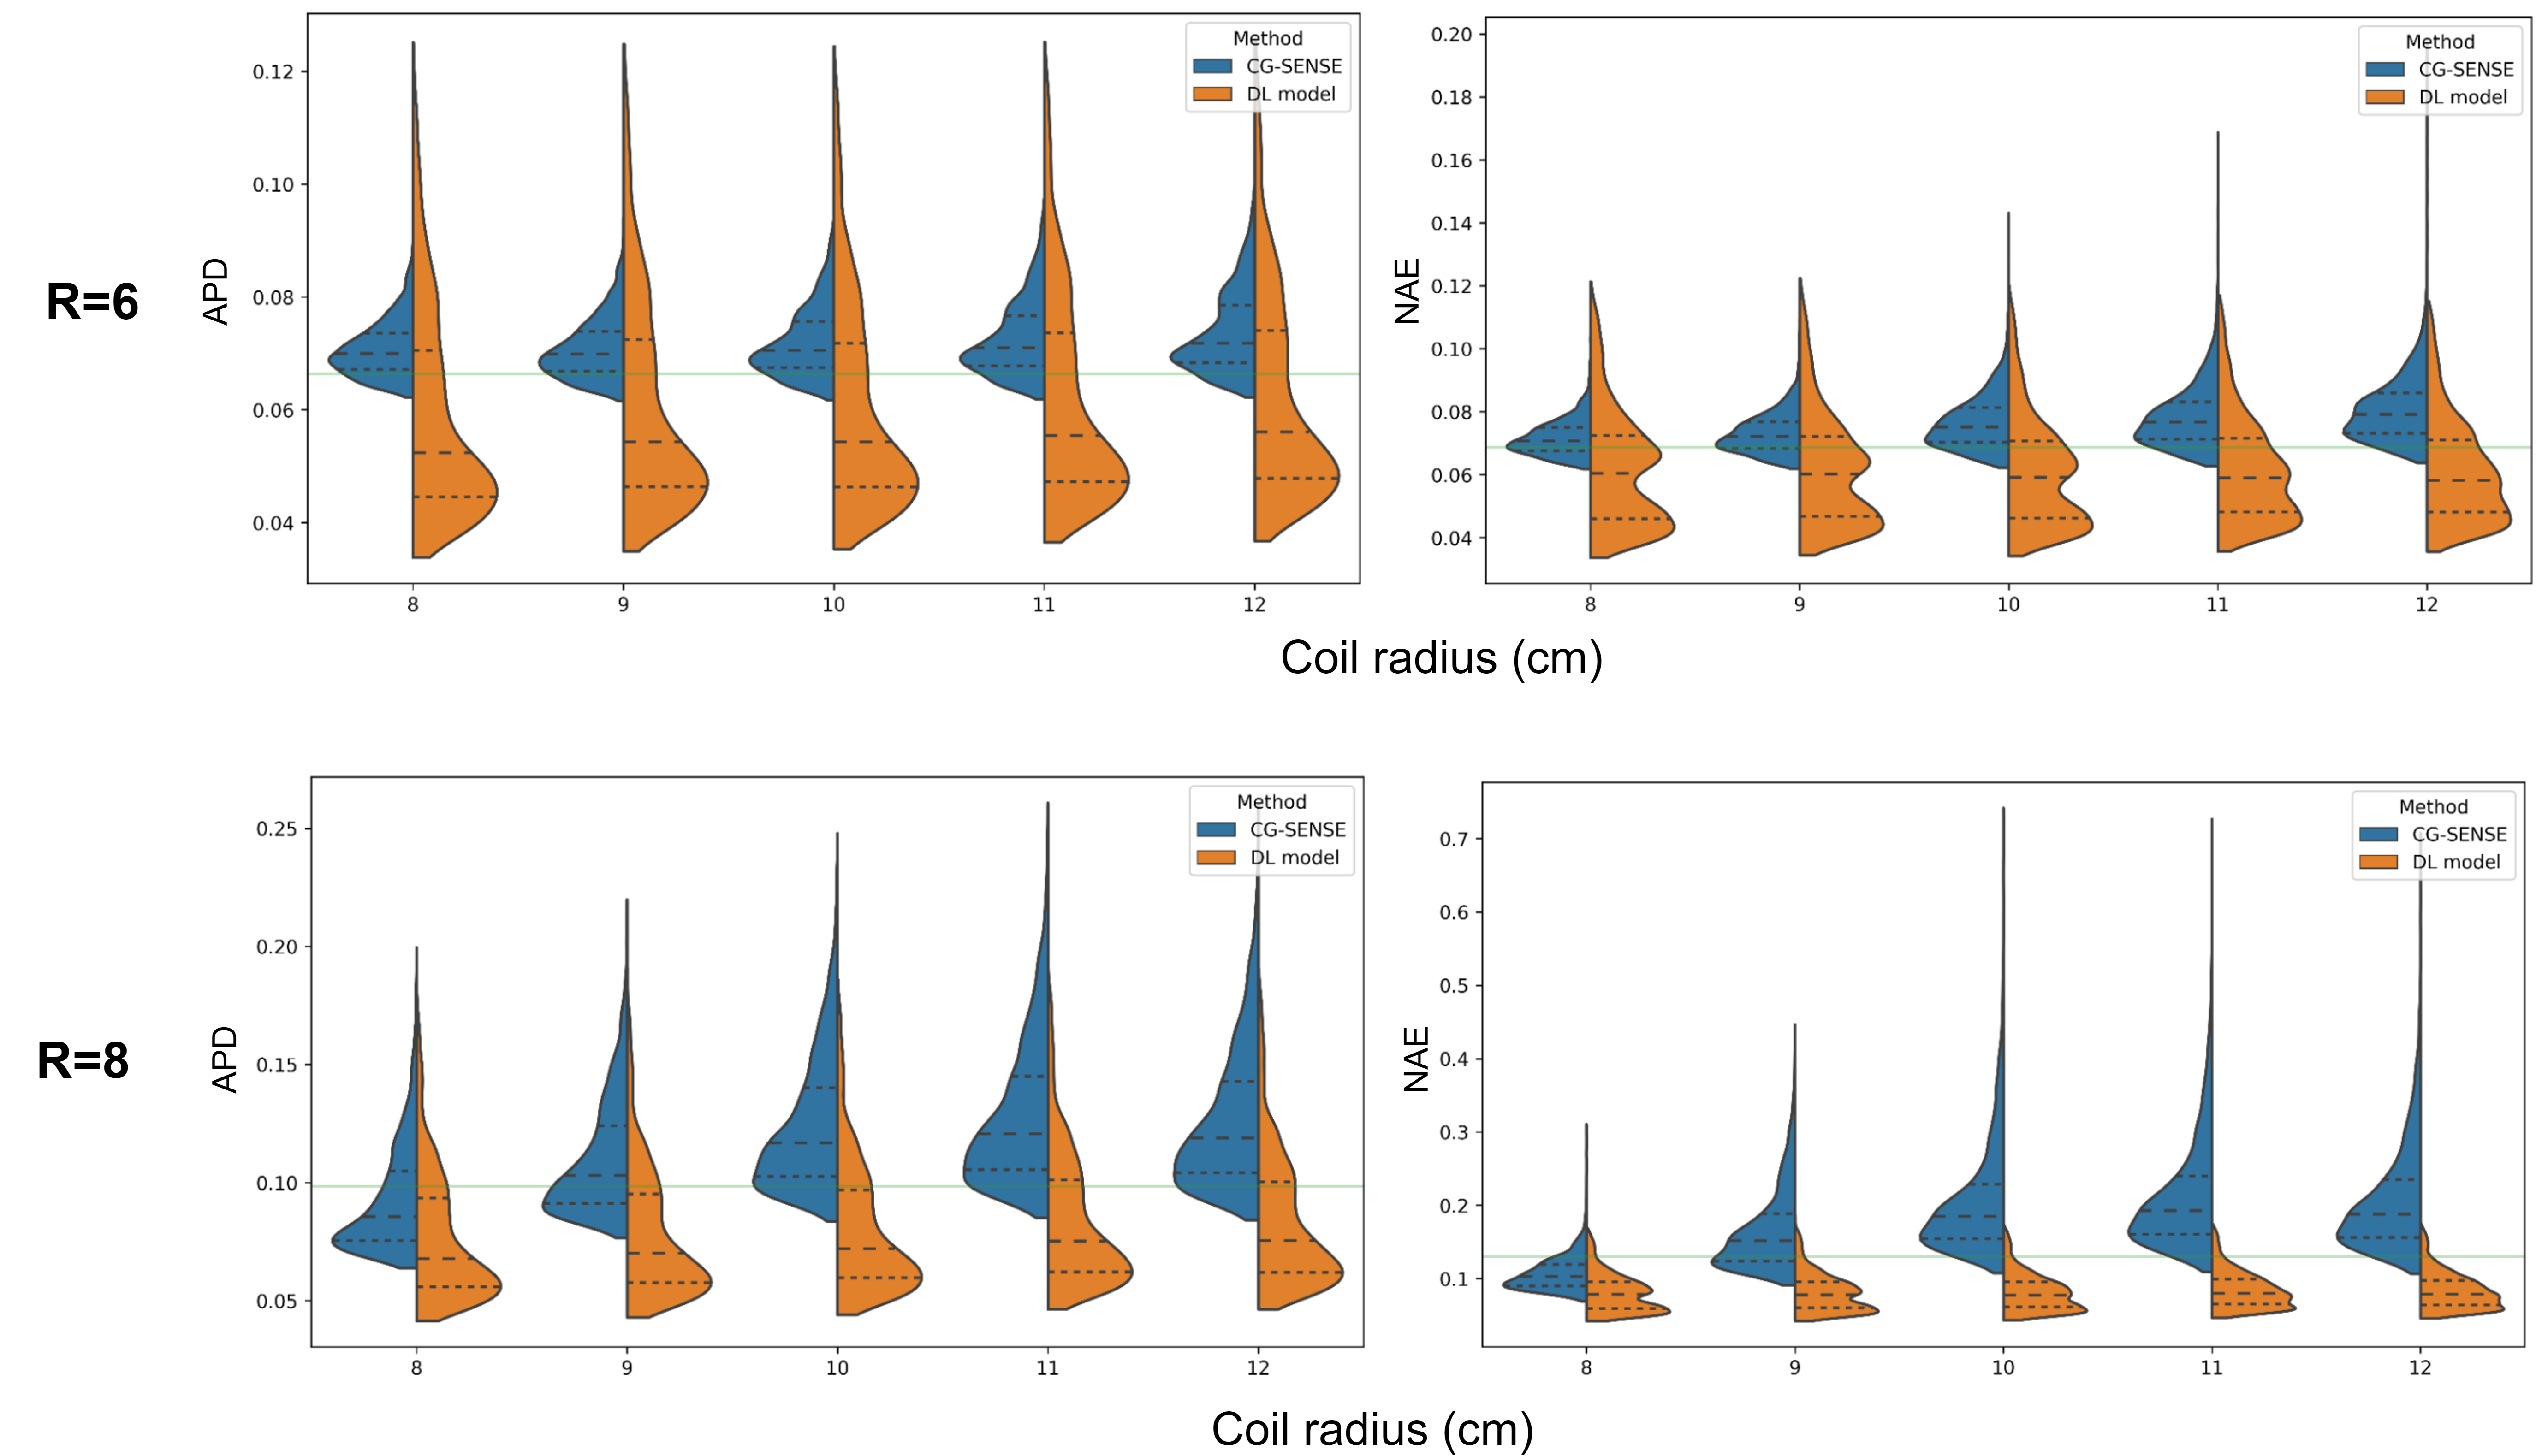
Figure 1: Violin plots presenting distributions of performance metrics (APD [left], NAE [right], defined in text) across all slices as a function of coil radius when using eight channel head coil profiles at R = 6 and R = 8. Violins are scaled to have equal width; the density of samples is not shown in the violin area. The dotted lines within the violins represent the median, first quartile and third quartile values. The horizontal green line represents the grand median. The trends in APD and NAE are consistent across R = 6 and 8.
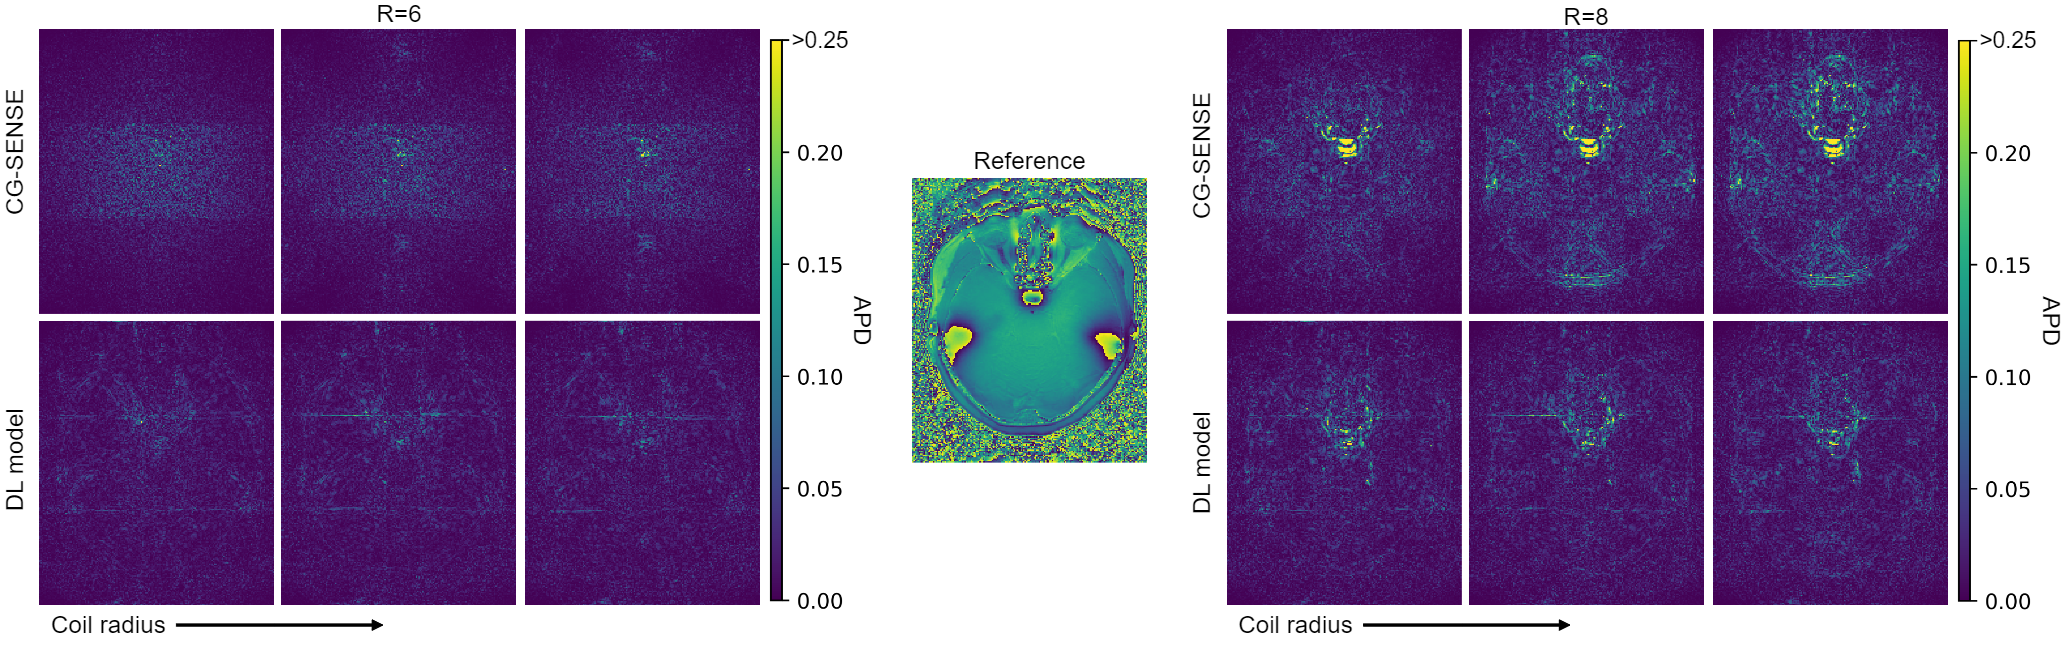
Figure 2: APD maps (defined in text) of the CG-SENSE (top) and DL (bottom) reconstructions using the head coil configuration at coil radii of 8 cm, 10 cm, and 12 cm at R = 6 [left] and 8 [right]. The DL model APD maps tend to follow phase boundaries more closely than CG-SENSE where the patterns resemble g-factor maps. With both methods, the reconstructed phase is highly sensitive to spatial aliasing artifacts.
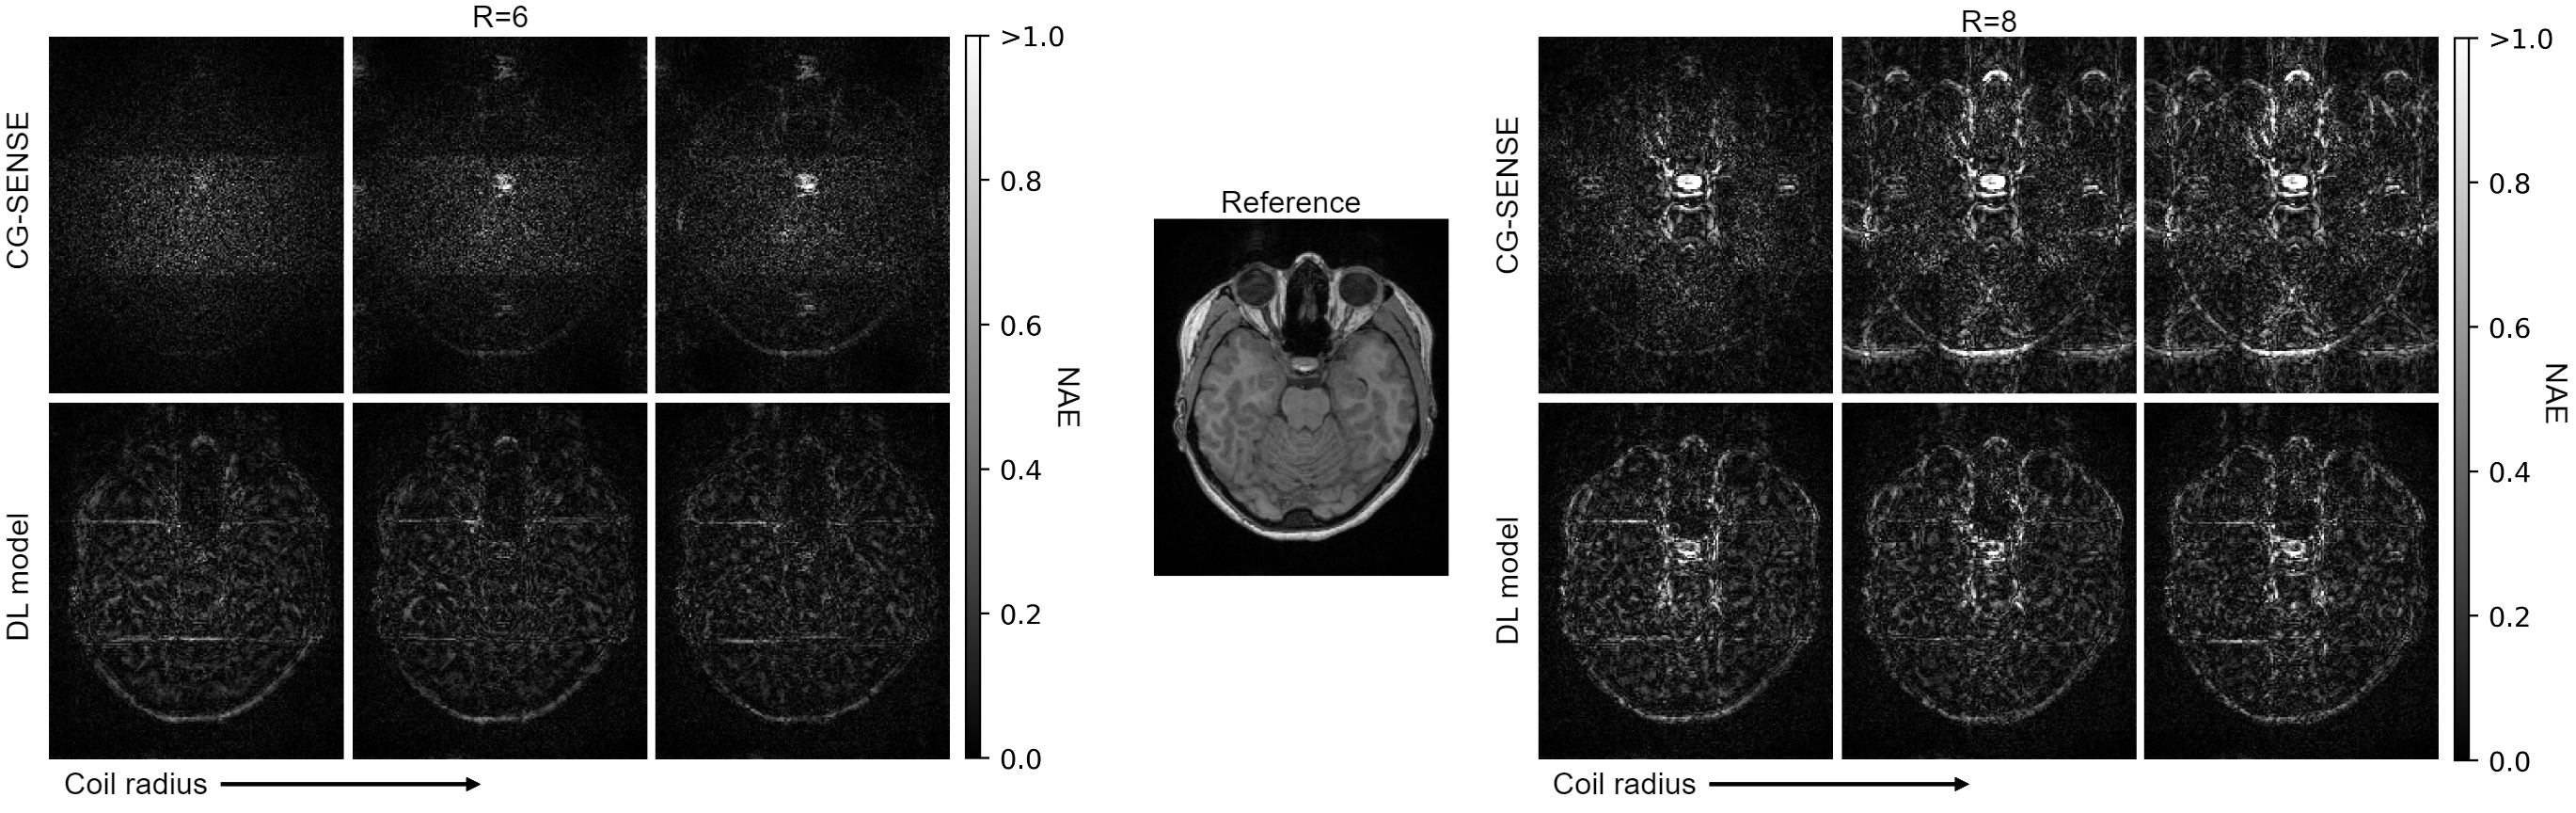
Figure 3: NAE maps (defined in text) maps of the CG-SENSE (top) and DL (bottom) reconstructions using the head coil configuration at coil radii of 8 cm, 10 cm, and 12 cm at R = 6 [left] and 8 [right]. g-factor-like patterns are seen for CG-SENSE NAE maps while the DL model more closely follows the anatomy. As compared to CG-SENSE, the DL model removes nearly all spatial aliasing outside the anatomy and removes most, but not all, spatial aliasing within the anatomy.
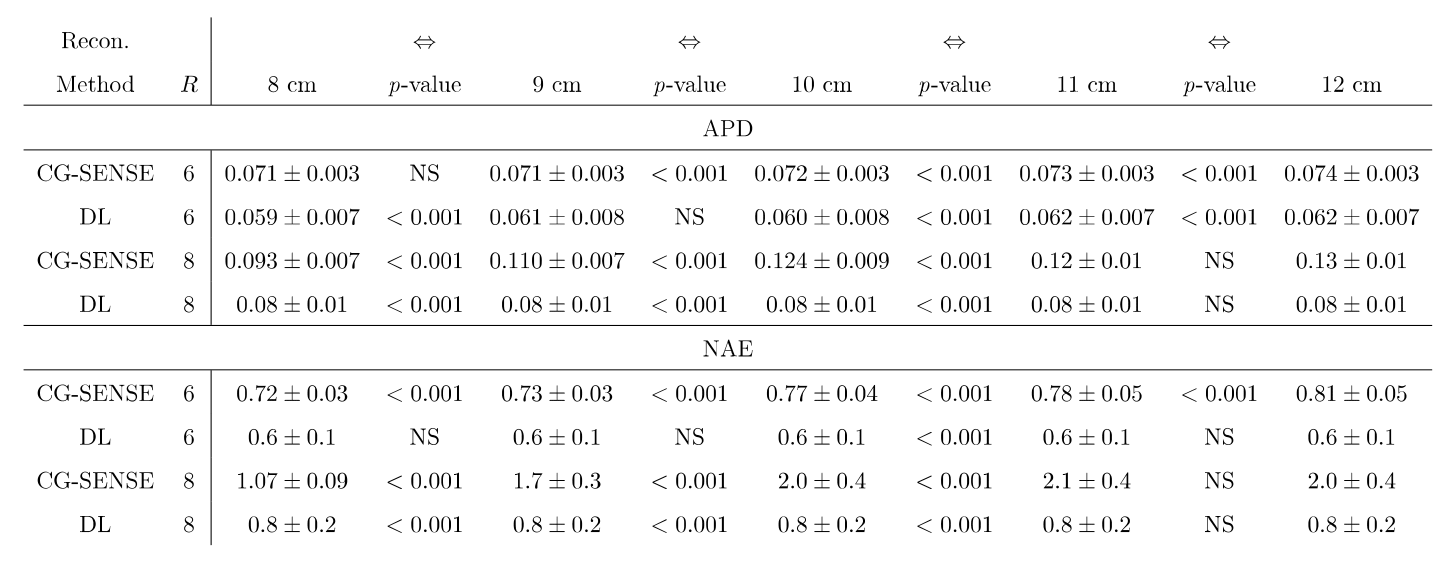
Table 1: Phase and magnitude error measures (mean ± standard deviation) for CG-SENSE and DL reconstruction methods by coil radius. Statistical significance between pairs of adjacent coil radii in the table are indicated. APD = intensity weighted absolute phase disparity; NAE = normalized absolute error, NS = not significant (p > 0.05).