1976
To SSIM, or to not SSIM: Investigating the impact of image artifacts and motion on image quality metrics1Department of Radiotherapy, UMC Utrecht, Utrecht, Netherlands, 2Computational Imaging Group for MR diagnostics & therapy, UMC Utrecht, Utrecht, Netherlands
Synopsis
Keywords: Analysis/Processing, Data Analysis
Motivation: When quantifying MRI image quality, image similarity metrics must be able to detect image artifacts.
Goal(s): To investigate the sensitivity of image similarity metrics to common distortion sources in MRI.
Approach: Distorted MRI is simulated using blurring, noise, inter-scan and intra-scan motion. Regression forests are trained to estimate the distortion parameters based on the image similarity metrics. The regression forests' feature importance quantifies the image metric sensitivity.
Results: Not all image similarity metrics are equally sensitive to every distortion source, and the best metric depends on the distortion source. The appropriate metric must be used to quantify the image quality.
Impact: Typically, standard image similarity metrics such as SSIM are chosen to estimate whether a particular method outperforms another method for all tasks. However, this research can help scientists use the appropriate metric when evaluating MRI reconstruction and processing methods.
Introduction
High-quality MRI can be distorted by various sources, such as noise, blurring, Gibbs ringing, motion artifacts, or flow artifacts. Moreover, MRI is often undersampled to accelerate the acquisition, and model-based reconstruction aims to obtain high-quality MRI. Ideally, we could evaluate whether the distorted MRI has sufficient clinical value, but this is difficult and time-consuming for radiologists. Instead, the quality of the obtained MRI is assured by comparing it to distortion-free high-quality MRI and computing surrogate metrics that describe image quality, such as the PSNR or SSIM[1]. However, while these metrics are commonly used, they only provide a general description of image quality. Therefore, they are not necessarily equally sensitive to every type of MRI distortion, such as blurring or motion. In this work, we evaluate the sensitivity of well-known image quality metrics to different types of distortions present in MRI.Materials and methods
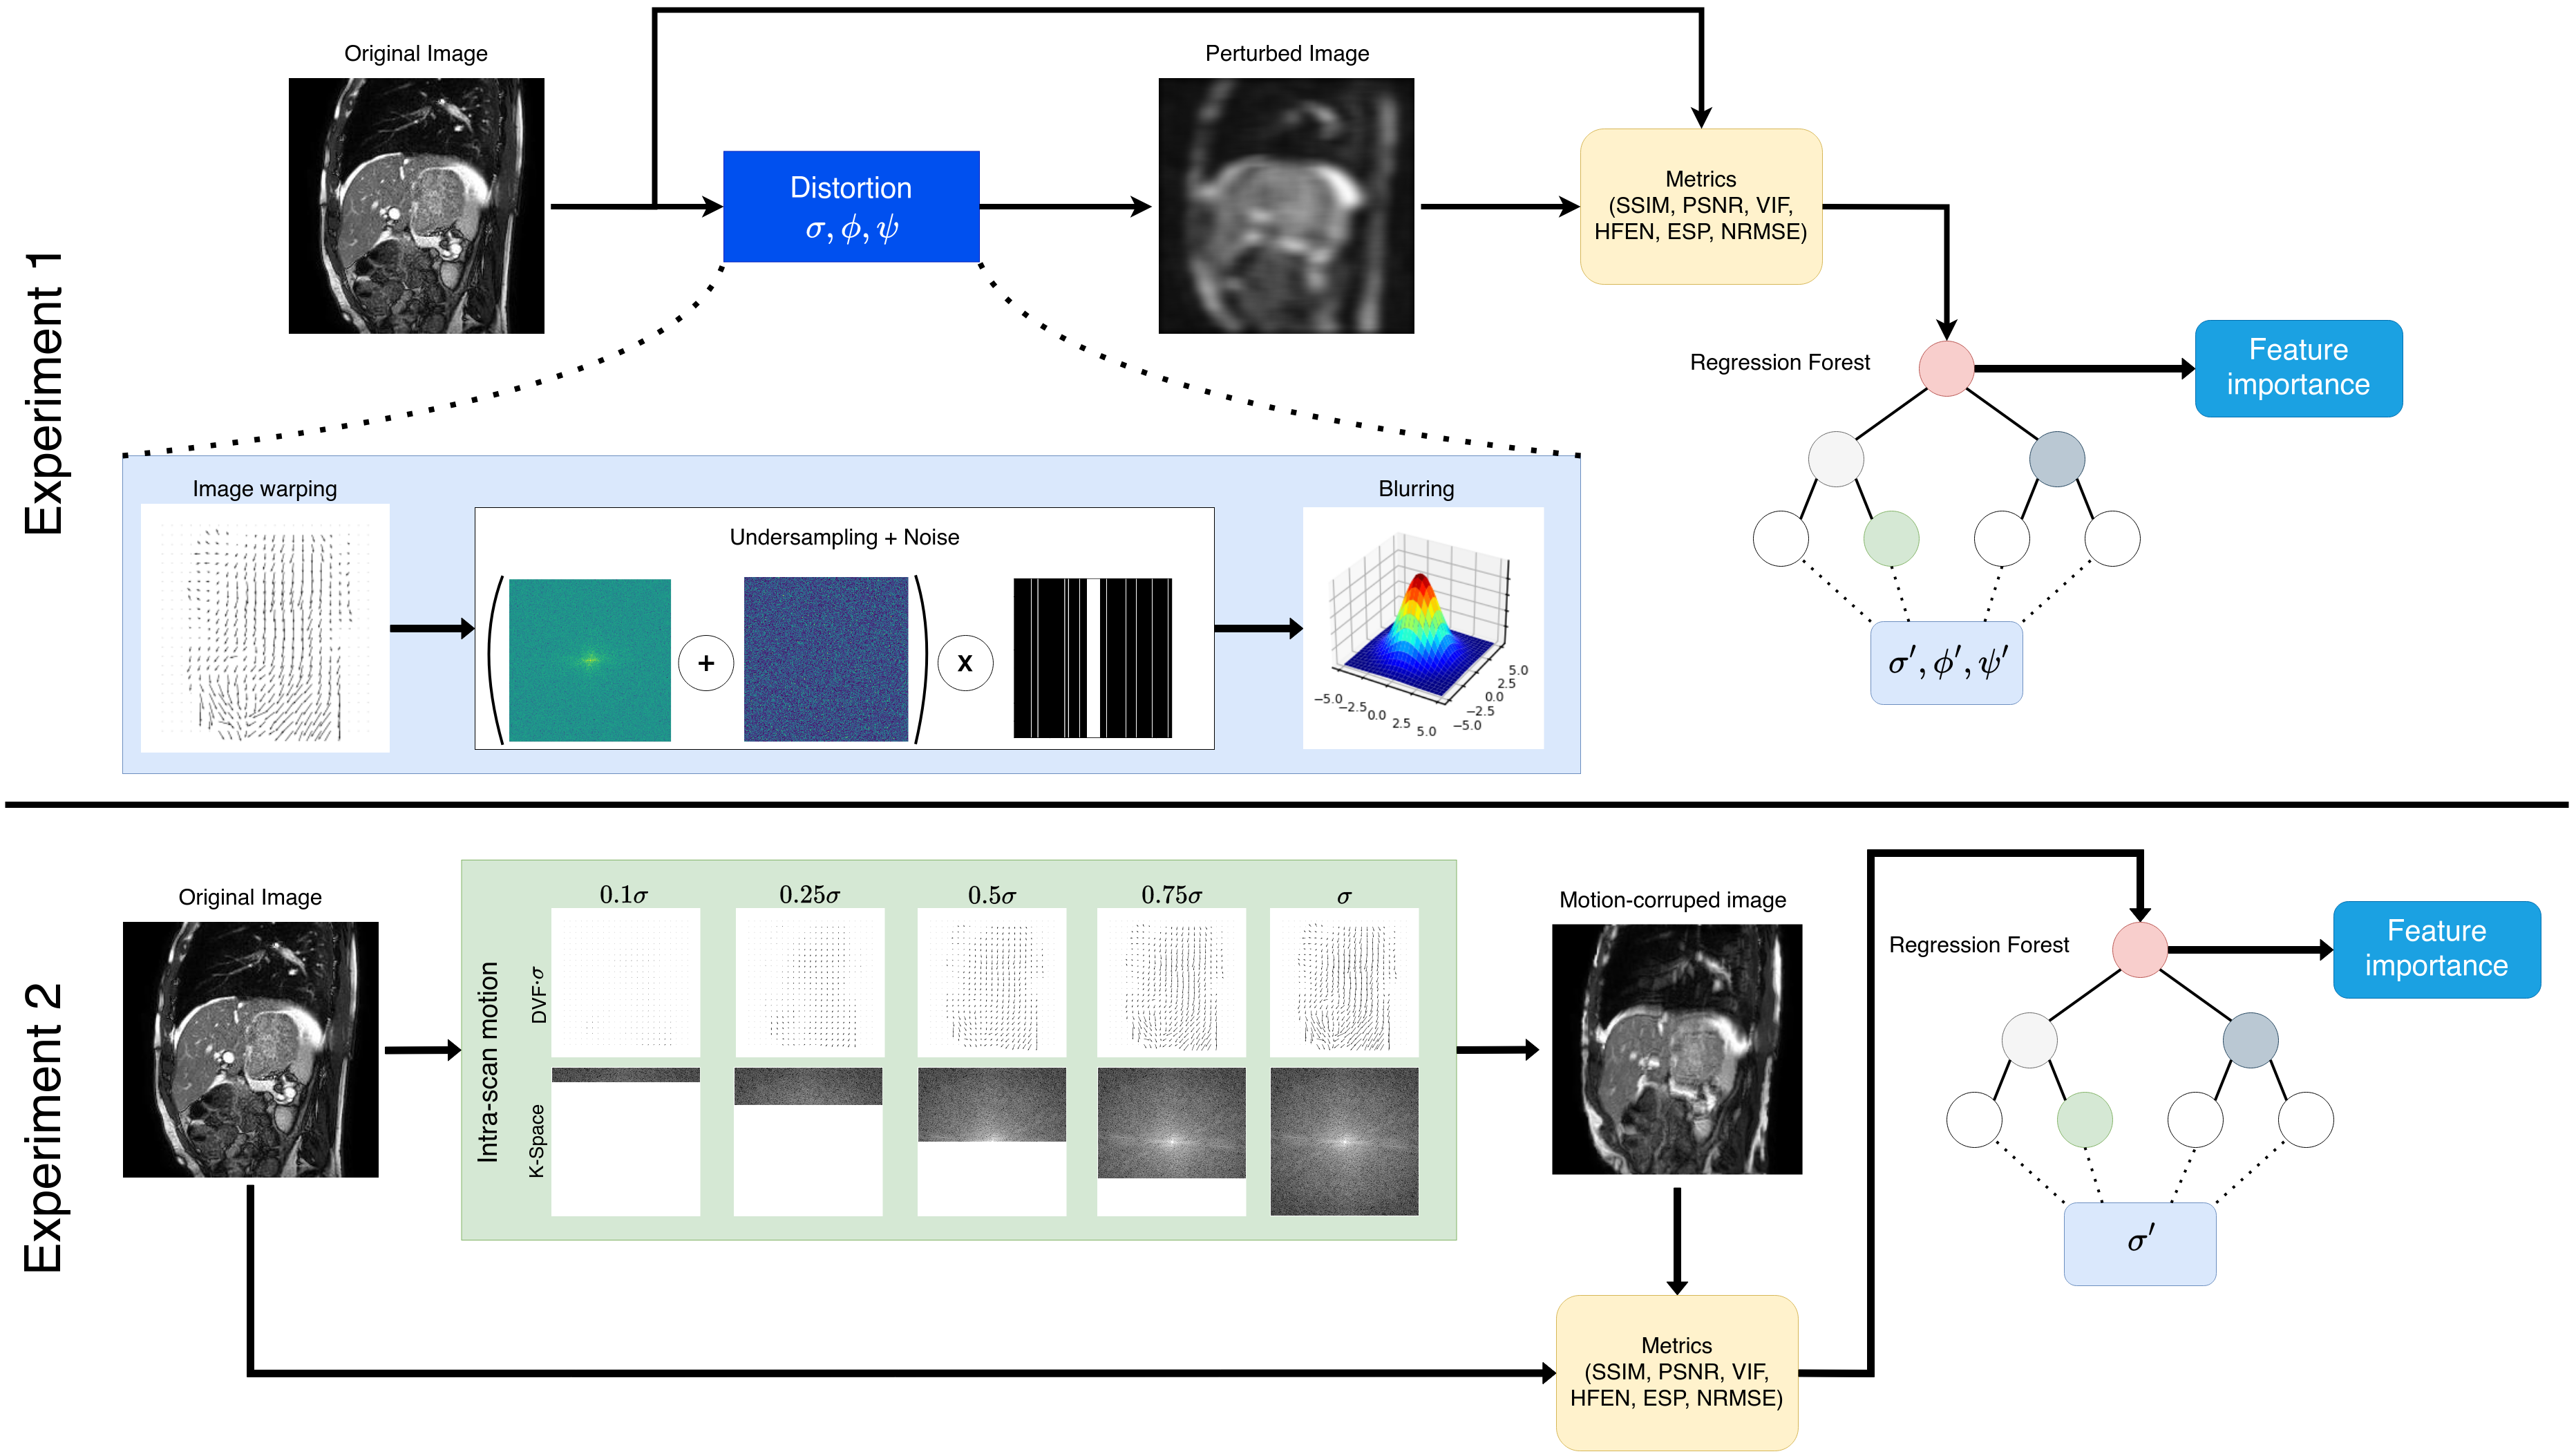
2D abdominal free-breathing cine MRI of 81 patients were used in this study. The MRI were obtained using a balanced steady-state free precession (bSSFP) acquisition (TE/TR = 1.4/2.8 ms, FA=50°) with a resolution of 1.42mm2. The magnitude MRI was normalized to [0, 1] by clipping the images after dividing by the 99th percentile of the cine sequence. The cine sequence was registered to random reference frame to obtain deformation vector fields (DVFs) representing respiratory motion, retaining the frame with the largest mean DVF magnitude.Distorted MRI was created by selecting a random image and introducing random noise, blurring, motion, and undersampling (Figure 1). First, motion was introduced by warping the image with the corresponding DVF multiplied by a random scaling factor $$$\sigma\in\mathcal{U}(0,1.5)$$$. Next, this image was undersampled using a random factor $$$R\in[1,2,4,8]$$$. Cartesian undersampling was used by retaining the 18 central lines and selecting random peripheral lines until the desired undersampling factor was reached. To this undersampled k-space, randomly generated Gaussian noise $$$z\sim\mathcal{N}(0, \phi),\phi\in\mathcal{U}(0, 0.25)$$$ was added. Finally, this k-space was reconstructed using an FFT and Gaussian blurred using an 11x11 kernel. This kernel had a randomly chosen standard deviation $$$\phi\in[0,10]$$$.
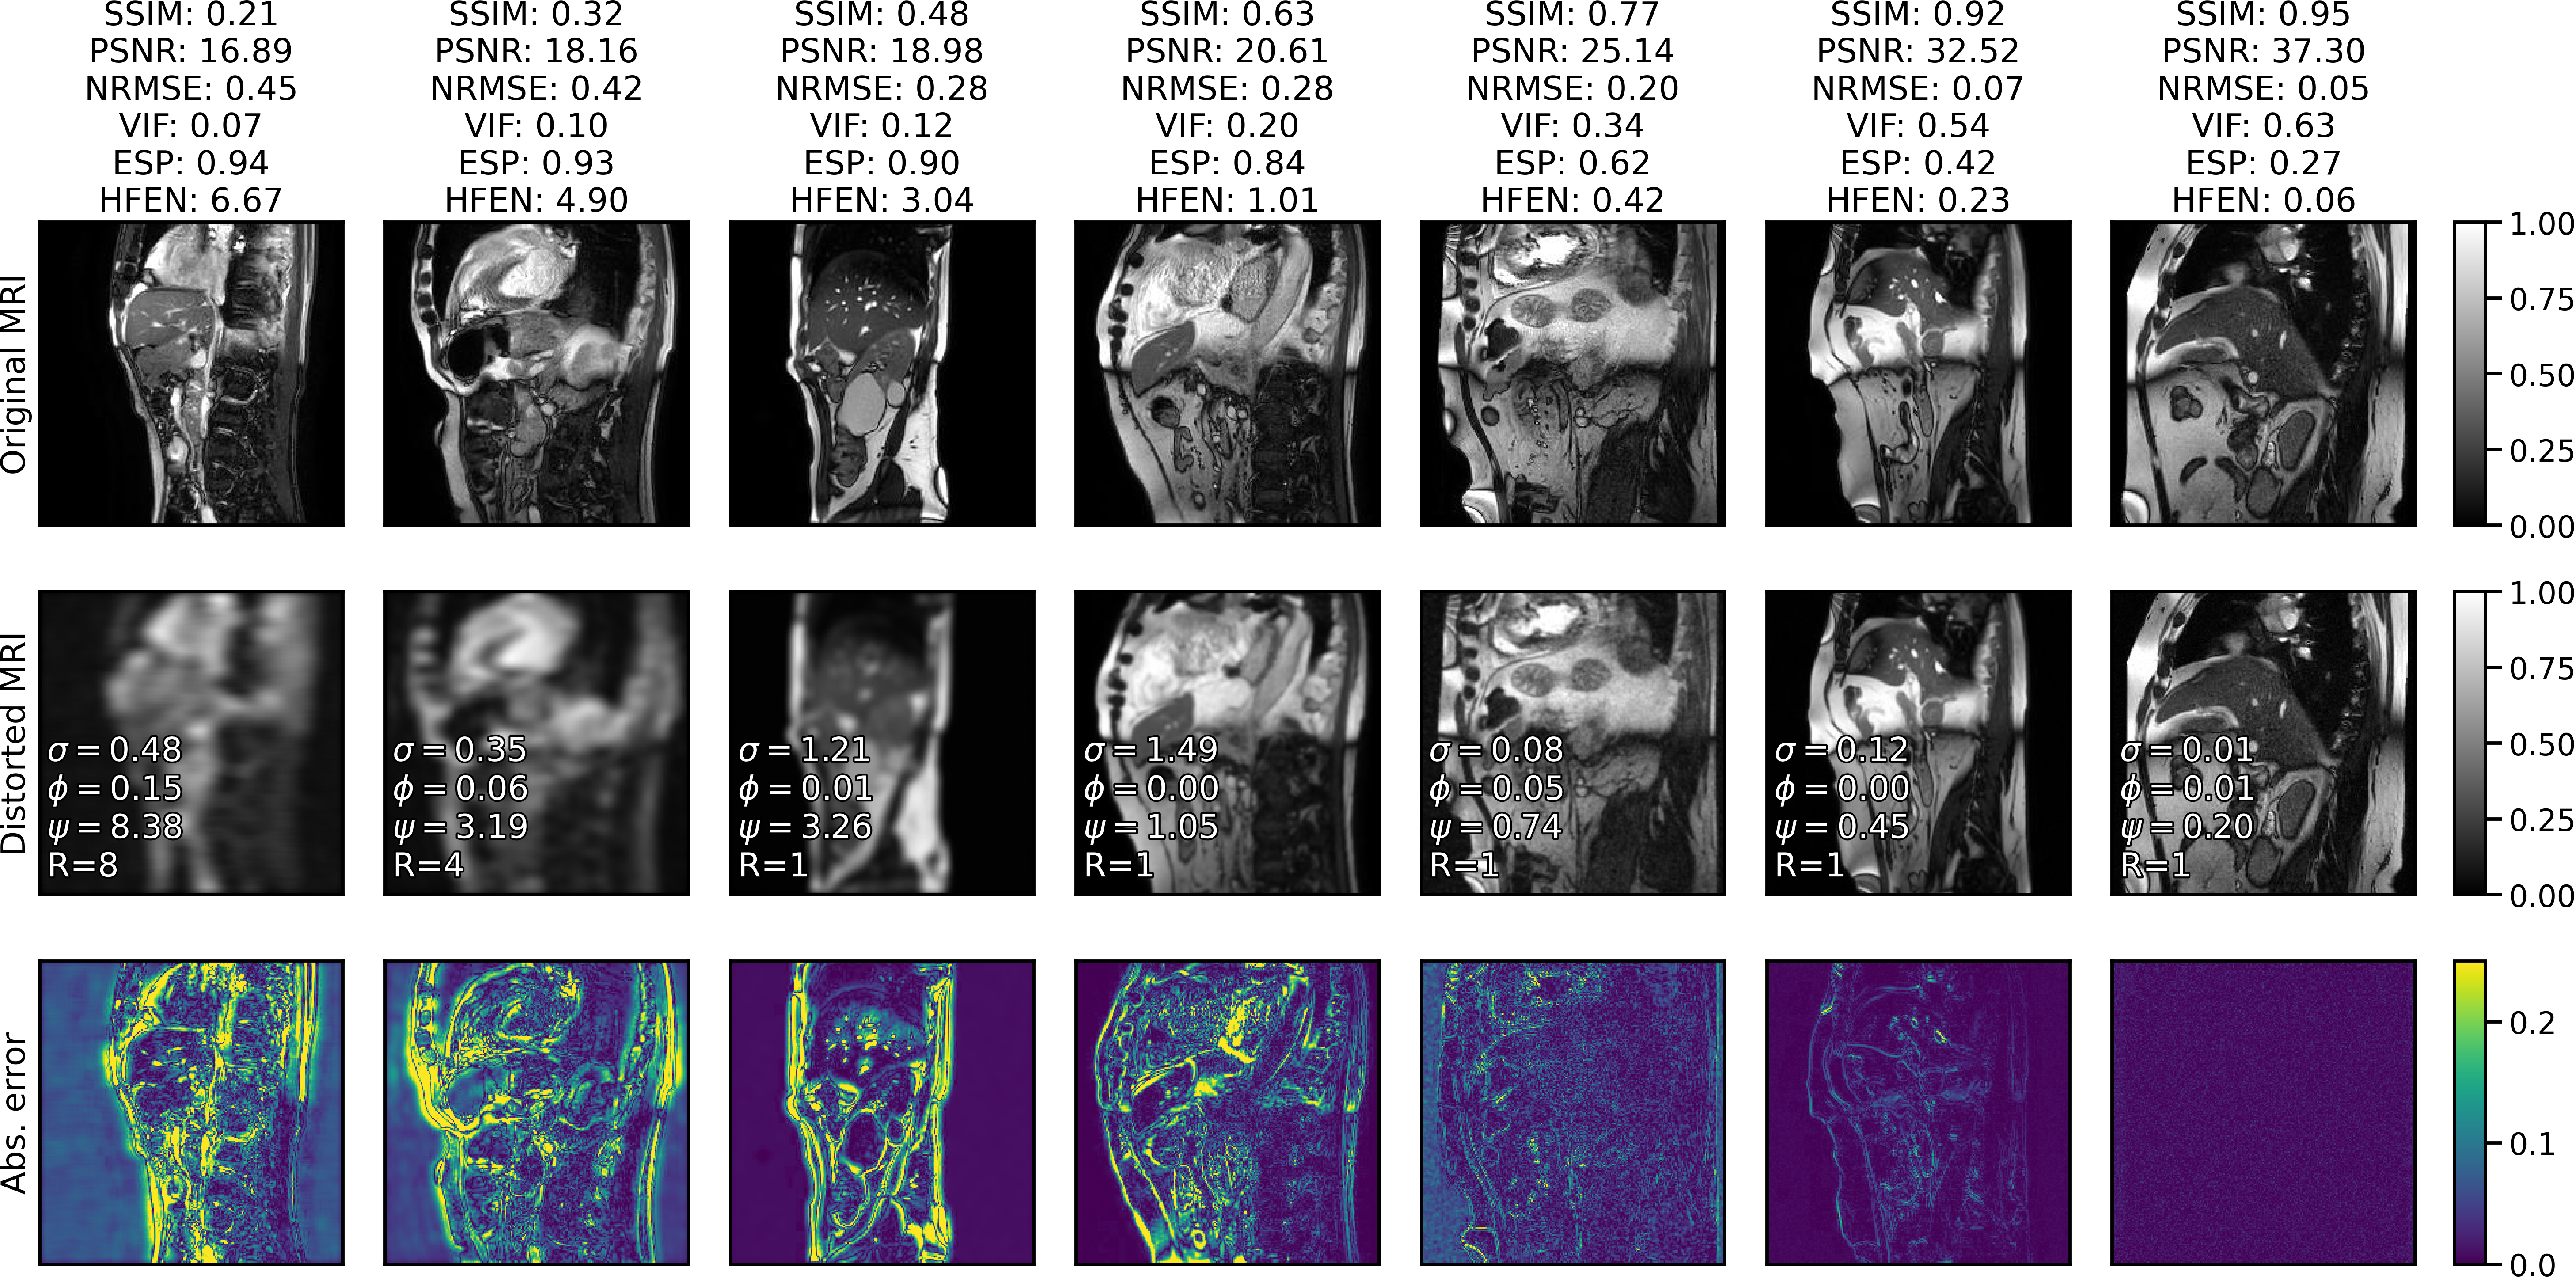
In total, 1000,000 random distorted images were generated using this procedure (Figure 2). Besides this set, we have created a secondary set to investigate the impact of intra-scan motion, simulating a linear motion scaling of the DVF between 0 and $$$\sigma$$$, depending on the phase-encode index of k-space (Figure 1).
Finally, several metrics were used to estimate the similarity between the distorted and non-distorted image-pairs. These metrics include the peak signal-to-noise ratio (PSNR), structural similarity (SSIM)[2], visual information fidelity (VIF)[3], summed error spectrum plot (ESP)[4], high-frequency error norm (HFEN)[5], and normalized root-mean-square error (NRMSE).
Image metric impact evaluation
A random regression forest[6] was trained to predict the distortion parameters $$$\phi,\psi$$$, and $$$\sigma$$$ based on all image similarity metrics. The forests were trained using five-fold cross-validation, using 80% of the samples for training and validation, and 20% for testing. The sensitivity of the metrics to a distortion source was estimated by computing the softmax of the permutation feature importance method, measuring the mean-squared error increase when the relation between feature and target is broken by random feature shuffling[6].Results
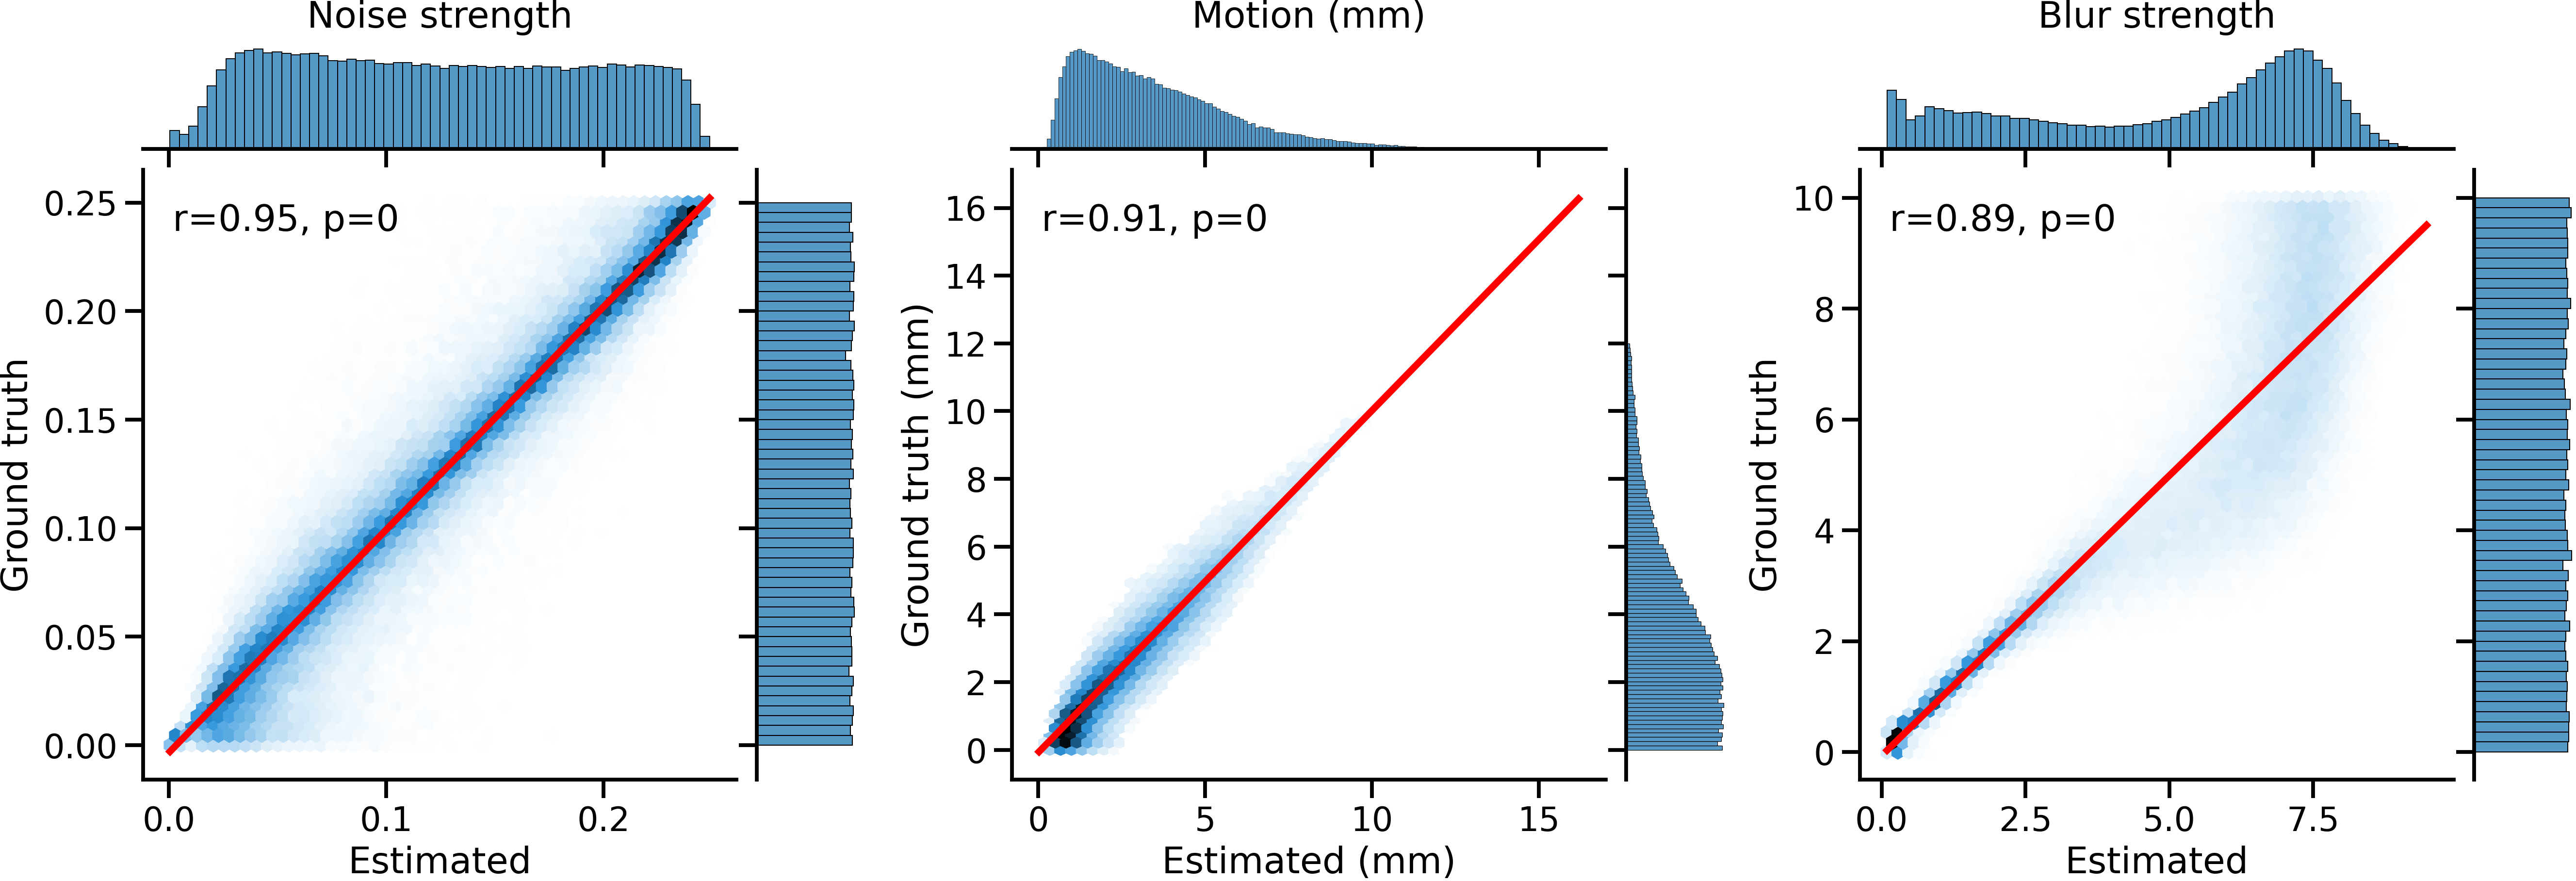
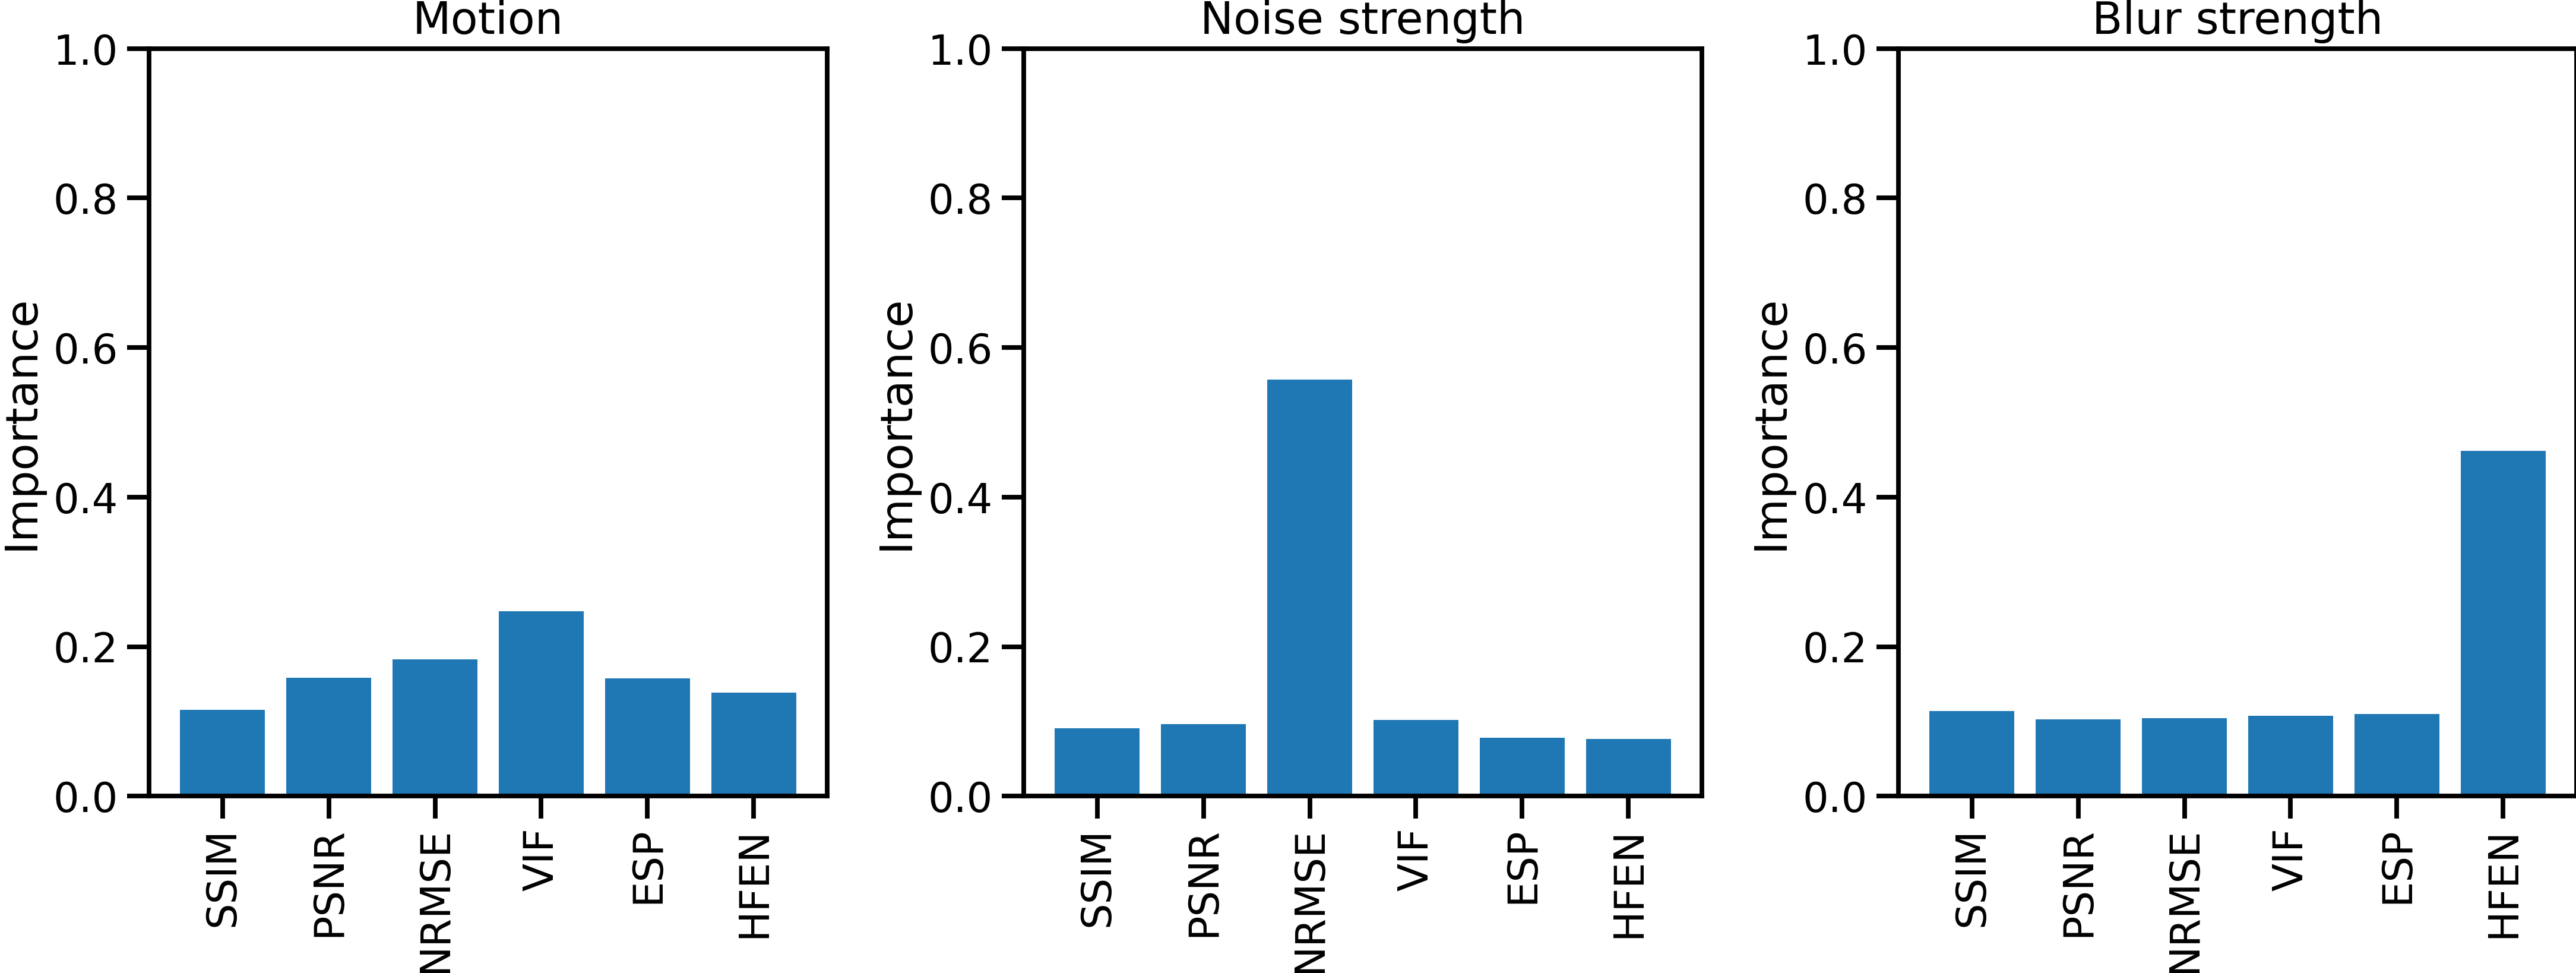
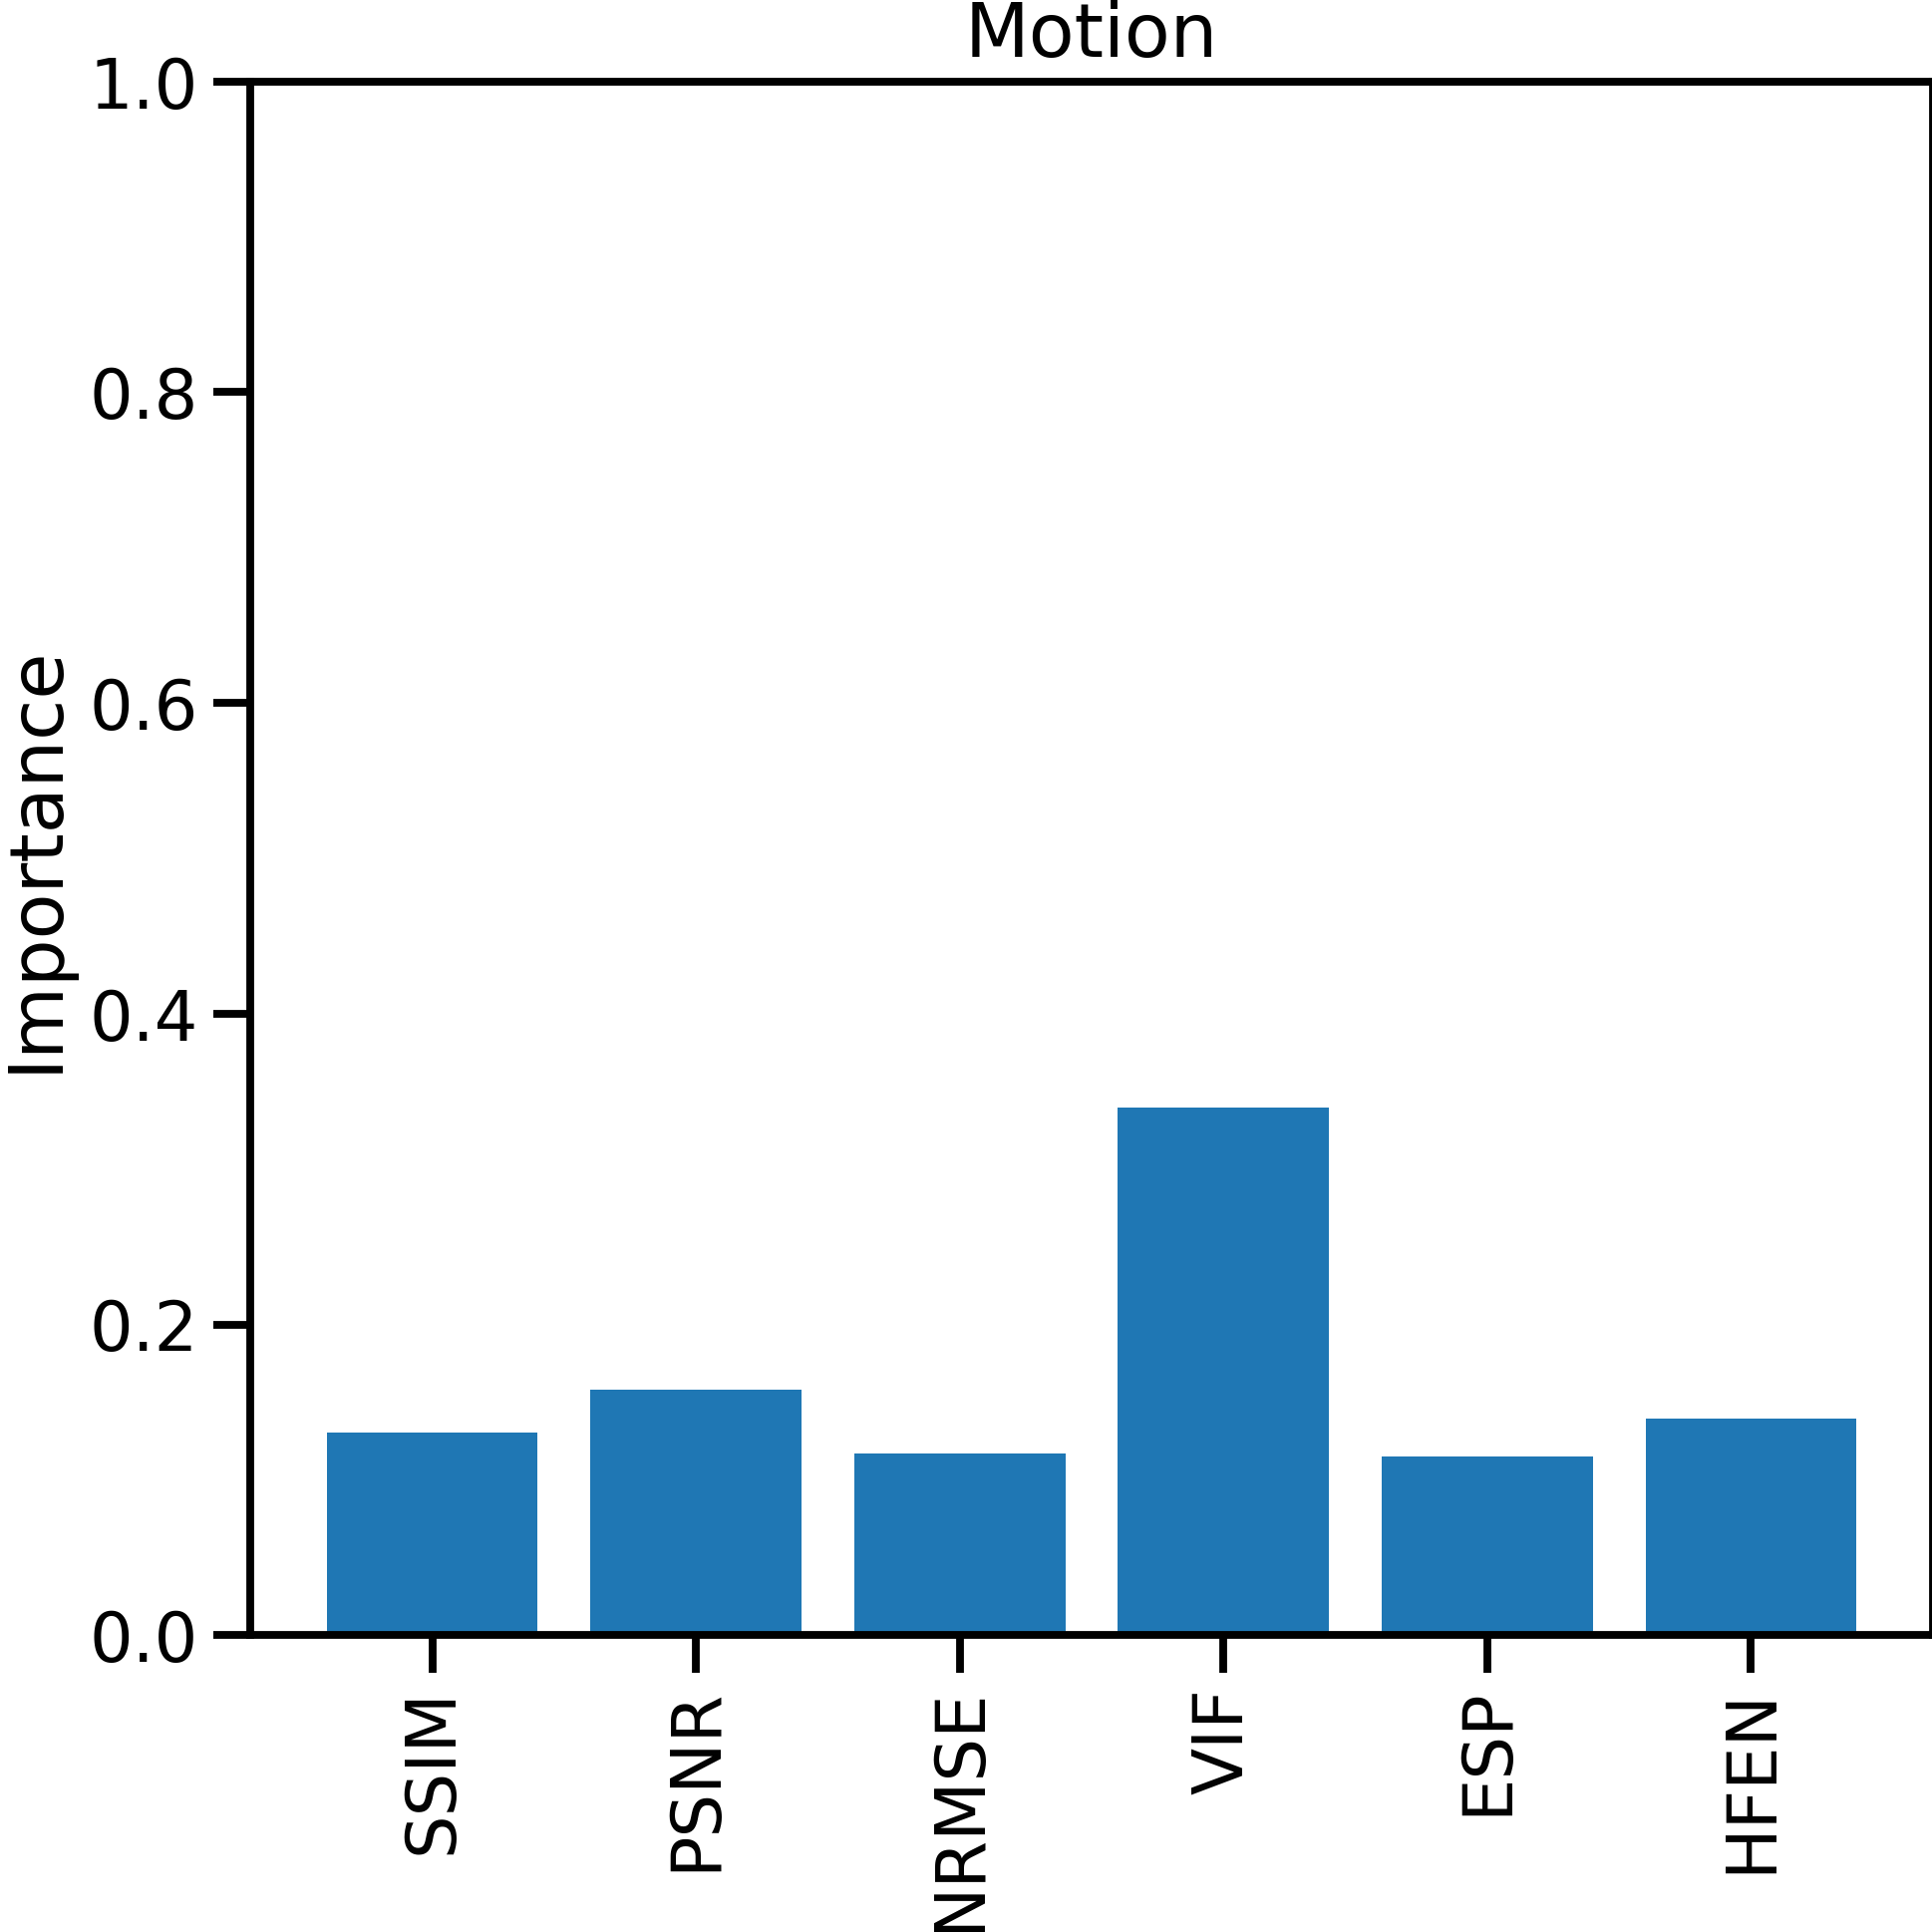
The regression forest was able to accurately predict each distortion parameter based on the metric values and undersampling factor (R2 = 0.895, 0.852, 0.796 - MAE = 0.0154, 0.749, 0.926 mm for noise, blurring and motion, respectively), as shown in Figure 3. We estimated the metric relevance for each distortion source based on the trained regression forest (Figure 4). For blurring, HFEN was found to be the most sensitive metric. For noise, NRMSE was the most critical metric. For image registration and motion correction, the VIF was the most descriptive metric (Figure 5). However, we have not found that a single metric is best at characterizing all distortion sources.Discussion and conclusion
We have evaluated the sensitivity of various common image quality metrics and have found that the most sensitive metric depends on the distortion source. While all metrics are sensitive to all distortion sources to some degree, selecting the best metric depends on the phenomenon to be measured. Generally, the SSIM is considered the de-facto image similarity metric, while we found it is has low distortion sensitivity. However, other works have identified the SSIM to be most correlated with radiologists' Likert ratings[7]. The regression forests are not only useful for metric sensitivity quantification, but can also be used for quality assurance by detecting the (remaining) distortion in-vivo acquisitions. Further investigation is required to discover whether optimal metrics exist for medical imaging. Future work will investigate model-based optimization using the found metrics and MRI contrast dependence on the metric sensitivity.Acknowledgements
No acknowledgement found.References
[1] Hammernik et al. "
L2 or not L2: Impact of Loss Function Design for Deep Learning MRI Reconstruction" Proc. ISMRM (2017)
[2] Wang et al. "Image quality assessment: from error visibility to structural similarity" IEEE TIP 13 (2004): 600-612
[3] Sheikh et al. "Image Information and Visual Quality" IEEE TIP 15 (2006): 430-445
[4] Kim and Haldar "The Fourier radial error spectrum plot: A more nuanced quantitative evaluation of image reconstruction quality" Proc. IEEE Int. Symp. Biomed. Imaging (2019) pp. 61-64
[5] Ravishankar and Bresler "MR image reconstruction from highly undersampled k-space data by dictionary learning" IEEE Trans. Med. Imaging 2011; 30: 1028–1041.
[6] Breiman, Leo. "Random forests." Machine learning 45 (2001): 5-32.
[7] Eichhorn et al. "Evaluating the match of image quality metrics with radiological assessment in a dataset with and without motion artifacts" Proc. ISMRM. (2022)
Figures