1975
Deep Learning-Based Super Resolution Reconstruction for Quantitative Susceptibility Mapping1CUBRIC, School of Psychology, Cardiff University, Cardiff, United Kingdom, 2CUBRIC, School of Physics and Astronomy, Cardiff University, Cardiff, United Kingdom, 3Institute for Advanced Biomedical Technologies and Department of Neurosciences, Imaging, and Clinical Sciences, University G. D’Annunzio of Chieti-Pescara, Chieti, Italy
Synopsis
Keywords: Analysis/Processing, Quantitative Susceptibility mapping
Motivation:
Lengthy acquisitions are needed to produce high-quality quantitative susceptibility mapping (QSM) from which it is possible to segment vasculature and extract physiological parameters.
Goal(s): To adapt a deep learning method for super-resolution reconstruction to enhance QSM images.
Approach: We applied the 3D densely-connected super resolution network (DCSRN) to QSM data, as it has previously shown promising results in reconstructing T1w high-resolution (HR) images from low-resolution (LR) images.
Results: We demonstrated an improvement in the reconstruction of the vascular network, with intravascular susceptibility values distribution close to the true distribution.
Impact: Our results show the promise of DCSRN architecture in producing super resolution (SR) images from low resolution (LR) images. Furthermore, the feasibility of segmenting vessels and extracting venous OEF on SR would be beneficial for studies of brain vasculature.
Introduction
Quantitative susceptibility mapping (QSM) measures the spatial distribution of magnetic susceptibility from the signal phase of gradient echo MRI data. Susceptibility differences allow the accurate segmentation of the brain vasculature and the estimation of venous oxygen saturation1. The reliability of such maps critically depends on their contrast and spatial resolution. High-resolution QSM data requires lengthy acquisitions and high field systems. Single image super resolution (SISR) reconstruction attempts to solve the problem of generating HR images from a LR version. The DCSRN architecture2 has shown promising results in reconstructing T1w HR images from LR data. The model proved to be efficient and less prone to overfitting due to weight sharing and the reuse of features. In this work, we aim to train and fit the same deep learning model to QSM images, to increase the resolution of the images and improve the segmentation of the brain vasculature to quantify venous oxygen saturation in cortical vessels.Methods
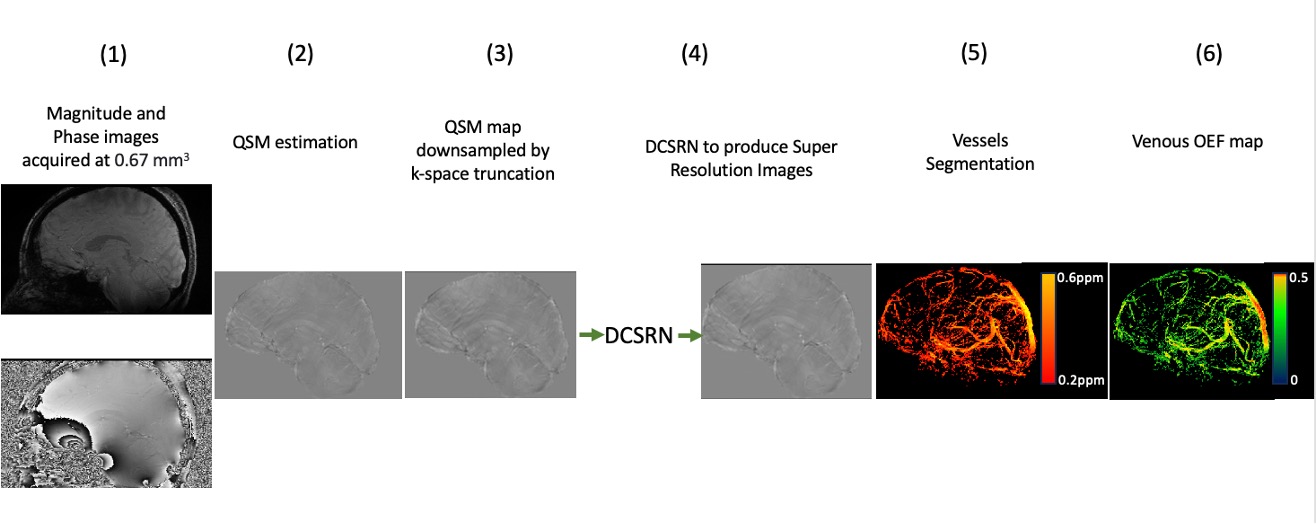
Two datasets were used in the present study: a first one, 1113 T1w images of Human Connectome Project (HCP) dataset3 (Siemens 3T “Connectome Skyra”, voxel resolution=0.7 mm isotropic) to ensure the model was running with similar performance to Chen at al. (2018)2. The second dataset was used with the aim of applying the model to QSM maps. 101 QSM maps generated from magnitude and phase GRE scans acquired with a 7T Siemens Magnetom scanner (0.67 mm isotropic, 7 TEs between 5 and 35 ms) (Figure 1.1). QSM generation consisted of an initial phase unwrapping (ROMEO4), followed by projection onto dipole fields (MEDI suite5) and non-linear dipole inversion6 (Figure 1.2). For both datasets (HCP and QSM), LR volumes were obtained by cropping the k-space of the HR volumes by a factor 2 in each direction (Figure 1.3). DCSRN model was separately trained on both datasets (Figure 1.4). Splits of 7:1.5:1.5 were used for training, validation, and testing, respectively. Intensity normalisation (mean/std) was applied to the whole 3D volumes, before the division into 200 randomly located patches (64x64x64) used during training. The QSM dataset was further augmented by applying affine deformations with randomly generated rotation angles from normal distribution around 3°7, and random shearing around 0.05. Networks were implemented in TensorFlow and run on the local GPU cluster. To assess the results, we computed image metrics, such as Structural Similarity Index (SSIM), peak signal to noise ratio (PSNR) and normalized root mean squared error (NRMSE), between the Super Resolution (SR) and HR. Our model was also compared with other resampling methods, such as nearest neighbour up-sampling, bicubic interpolation and cubic interpolation. Susceptibility values were extracted within the vessels identified with a threshold (Figure 1.5) in order to calculate venous OEF8 from SR susceptibility maps (Figure 1.6).Results
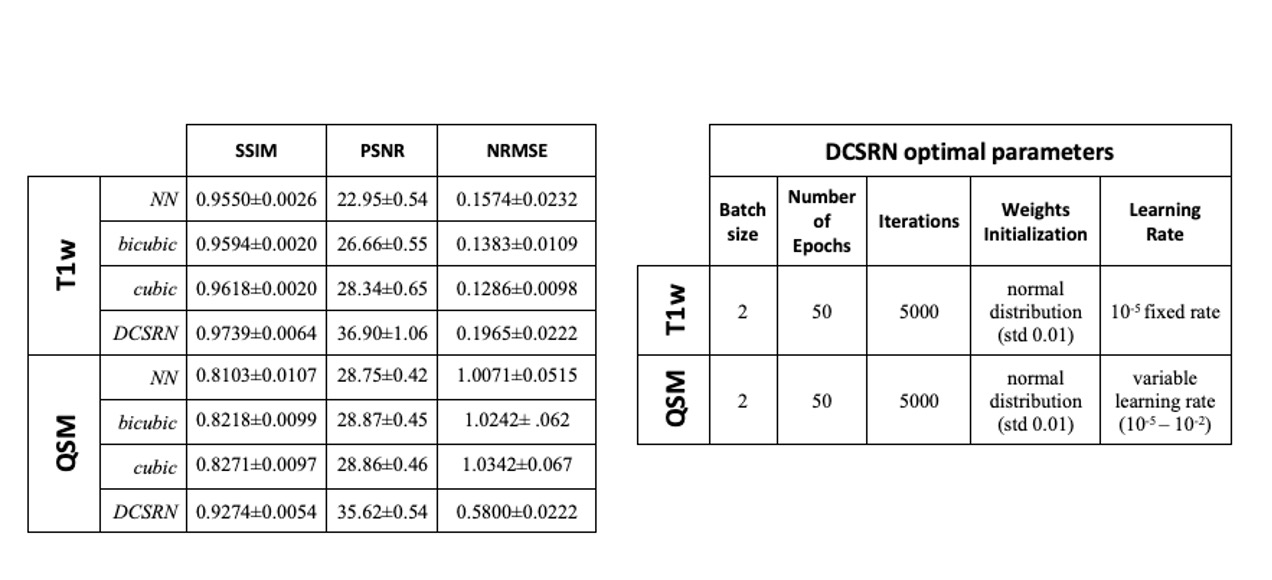
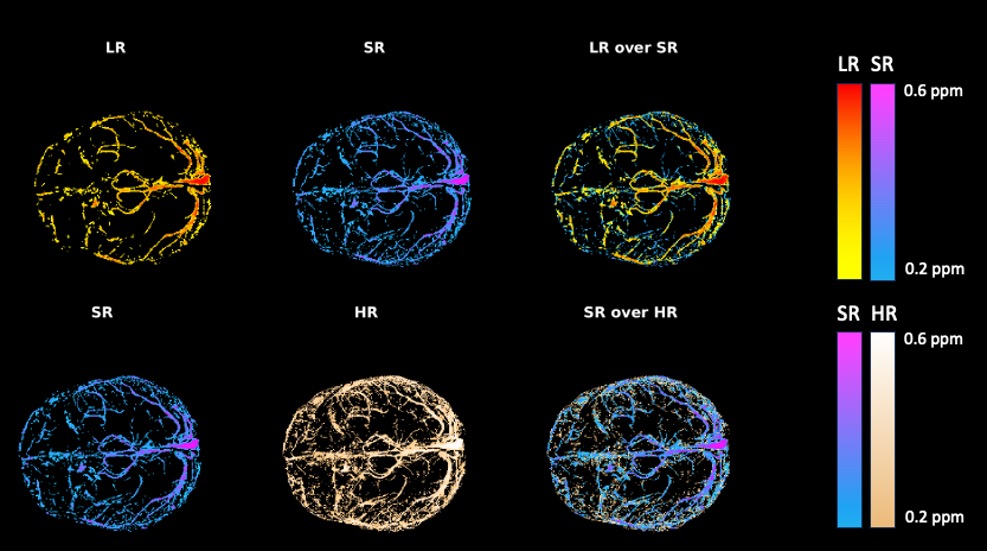
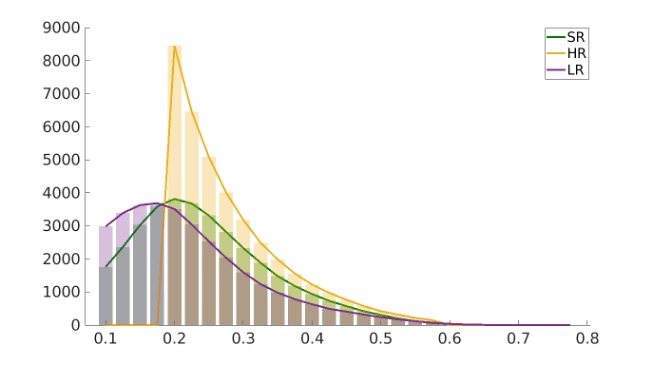
The table in Figure 2 shows the performance metrics obtained on the test set. The DCSRN architecture improved the similarity between HR and SR images more than the other interpolation methods tested. Training on T1w, shows SSIM metric results similar to Chen et al.2, although we used a different weight initialisation and different intensity normalisation. Figure 3 shows the improvement in the captured vasculature network achieved with the DCSRN architecture on QSM data. Smaller vessels could be more reliably identified from the SR image (blue) than the LR (orange) (Figure 3), and the noise that affected the HR image (brown) is less evident in SR (blue) (Figure 3). QSM susceptibility values within the vessels (range [0.2, 0.6] ppm) were extracted for each image (mean±std= LR: 0.2599±0.1031; HR: 0.3027±0.1205; SR: 0.2995±0.0898). We observed SR susceptibility values to be very similar to the true susceptibility values obtained from HR (Figure 4). After segmenting the vessels on QSM maps (LR/HR/SR), venous OEF was calculated in the vessels (mean±std= LR:0.200±0.085;HR:0.232±0.098;SR: 0.227±0.075) indicating the feasibility of estimating OEF on QSM SR images.Discussion/Conclusion
Our results show the promise of DCSRN architecture in QSM SR reconstruction, as it can produce high-quality SR images that are similar to those obtained from high-resolution images with longer acquisition times. SR can also be used to segment vessels and compute OEF venous maps, which would be beneficial for studying brain vasculature and oxygen metabolism.Acknowledgements
The study was funded by EPSRC grant (EP/S025901/1), MG’s Wellcome Fellowship (220575/Z/20/Z), and the Wellcome Trust for the Strategic Award (104943/Z/14/Z). Funded in part by the European Union - NextGenerationEU under the National Recovery and Resilience Plan (NRRP), Mission 4 Component 2 -M4C2, Investment 1.5 - Call for tender No. 3277 of 30.12.2021 Italian Ministry of Universities Award Number: ECS0000004, Project Title: “Innovation,digitalisation and sustainability for the diffused economy in Central Italy,” Concession Degree No. 1057 of 23.06.2022 adopted by the Italian Ministry of Universities, CUP: D73C22000840006.References
1. Murdoch, R., et al., A Comparison of MRI Quantitative Susceptibility Mapping and TRUST-Based Measures of Brain Venous Oxygen Saturation in Sickle Cell Anaemia. Frontiers in physiology, 2022. 13: p. 913443-913443.
2. Yuhua Chen, Y.X., Zhengwei Zhou, Feng Shi, Anthony Christodoulou, Debiao Li, Brain MRI Super Resolution Using 3D Deep Densely Connected Neural Networks. 2018.
3. Glasser, M.F., et al., The minimal preprocessing pipelines for the Human Connectome Project. Neuroimage, 2013. 80: p. 105-24.
4. Dymerska, B., et al., Phase unwrapping with a rapid opensource minimum spanning tree algorithm (ROMEO). Magnetic Resonance in Medicine, 2021. 85(4): p. 2294-2308.
5. Liu, T., et al., Accuracy of the morphology enabled dipole inversion (MEDI) algorithm for quantitative susceptibility mapping in MRI. IEEE transactions on medical imaging, 2012. 31(3): p. 816-824.
6. Polak, D., et al., Nonlinear dipole inversion (NDI) enables robust quantitative susceptibility mapping (QSM). NMR in biomedicine, 2020. 33(12): p. e4271-n/a.
7. Gallichan, D., J.P. Marques, and R. Gruetter, Retrospective correction of involuntary microscopic head movement using highly accelerated fat image navigators (3D FatNavs) at 7T. Magn Reson Med, 2016. 75(3): p. 1030-9.
8. Fan, A. P., Schäfer, A., Huber, L., Lampe, L., von Smuda, S., Möller, H. E., ... & Gauthier, C. J. (2016). Baseline oxygenation in the brain: correlation between respiratory-calibration and susceptibility methods. Neuroimage, 125, 920-931.
9. Gourdeau, D., S. Duchesne, and L. Archambault, On the proper use of structural similarity for the robust evaluation of medical image synthesis models. Medical Physics, 2022. 49(4): p. 2462-2474.
Figures