1973
Improved DCE-MRI for Diffuse Gliomas: Clinical Application of Deep Learning-based Super-resolution and Denoising Algorithm1Seoul National University College of Medicine, Seoul, Korea, Republic of, 2Department of Radiology, Seoul National University Hospital, Seuol, Korea, Republic of, 3AIRS Medical, Seoul, Korea, Republic of, 4Seoul Metropolitan GovernmentSeoul National University Boramae Medical Center, Seoul, Korea, Republic of
Synopsis
Keywords: Analysis/Processing, DSC & DCE Perfusion
Motivation: Dynamic contrast-enhanced MRI (DCE-MRI) is invaluable for non-invasive assessment of tissue perfusion and microcirculation dynamics. However, unreliability of DCE-MRI discourages clinical application.
Goal(s): To evaluate the image quality and diagnostic performance of enhanced DCE-MRI using a deep learning-based super-resolution and denoising algorithm.
Approach: Deep learning-based super-resolution and denoising (DLSD) algorithm was applied to DCE-MRI obtained from 306 patients with adult-type diffuse gliomas to reduce noise and increase resolution.
Results: DLSD significantly enhanced image quality without compromising diagnostic accuracy in distinguishing low- and high-grade tumors and IDH mutation, and it also improved the reliability of arterial input functions.
Impact: Improving DCE-MRI image quality and reliability through deep learning-based super-resolution and denoising algorithm can help address previous reliability issues and offer clinical applicability not only in the field of diffuse glioma but also in other areas utilizing DCE-MRI.
Introduction
Dynamic contrast-enhanced magnetic resonance imaging (DCE-MRI) is invaluable for non-invasive assessment of tissue perfusion and microcirculation dynamics1–4. However, it faces challenges such as noise due to low T1-based signal intensity compared to T2*-based signal intensity, partial volume effects, and reliability issues related to the arterial input function (AIF)5–7. These challenges reduce signal-to-noise ratios (SNR) and impede quantification of pharmacokinetic (PK) parameters8,9.To address these limitations, our study introduces a novel deep learning-based super-resolution and denoising algorithm aimed at enhancing the image quality and reliability of DCE-MRI. We validated its effectiveness in not only improving image quality but also in enhancing the reliability of the AIF, as well as diagnostic performance in diffuse glioma.
Method and Materials
PatientsThe study included patients over the age of 18 with newly diagnosed histopathologically confirmed adult-type diffuse glioma according to the 2021 World Health Organization (WHO) classification. This resulted in a final cohort of 306 patients.
MRI processing
Using NordicIce, the AIF was obtained from DCE-MRI. Subsequently, PK parametric maps were calculated based on the extended Tofts (eTofts) model10. Evaluation at the tumor region has important clinical relevance in glioma patients. To achieve this, sub-regions of interest (ROIs) were selected for the contrast-enhancing tumor (CE), non-enhanced tumor (NE), and whole tumor (WT), utilizing HD-GLIO11,12.
Deep learning-based algorithm
Standard DCE-MRI (std-DCE) was processed using a commercially available deep learning-based reconstruction software (SwiftMR, AIRS Medical). This deep learning-based super-resolution and denoising (DLSD) algorithm-enhanced DCE-MRI (DL-DCE) has an output size of 640x640x80 from 192x192x40, with a time step fixed at 60.
Quantitative evaluation
Image Quality Analysis: The SNR and contrast-to-noise ratio (CNR) were computed for ROIs in both std-DCE and DL-DCE to assess image quality as follows:
SNRROI = mean of signal intensity (SI)ROI / std of SIbackground,
CNRROI = (mean of SIROI - mean of SInormal) / standard deviation of SIbackground,
where, normal and background regions refer to tissue and the air space, respectively.
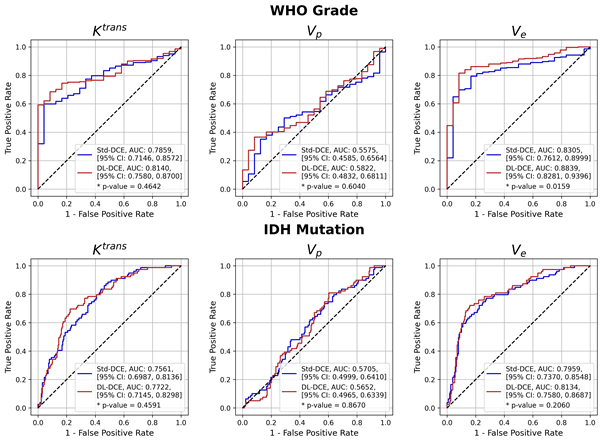
Diagnostic Performance Analysis: The receiver operating characteristic (ROC) curve was obtained to differentiate WHO grades and IDH-mutation based on PK parameters obtained from the tumor ROI. From ROC analysis, the area under the ROC curve (AUC) with p-value were derived.
AIF Reliability Analysis: The AIF analysis included the evaluation of five distinct AIF curve parameters: (a) bolus arrival time, (b) time to peak, (c) baseline SI, (d) maximal SI, and (e) wash-in slope. The intraclass correlation coefficient (ICC) was calculated between the AIF parameters measured twice to assess reliability.
Results
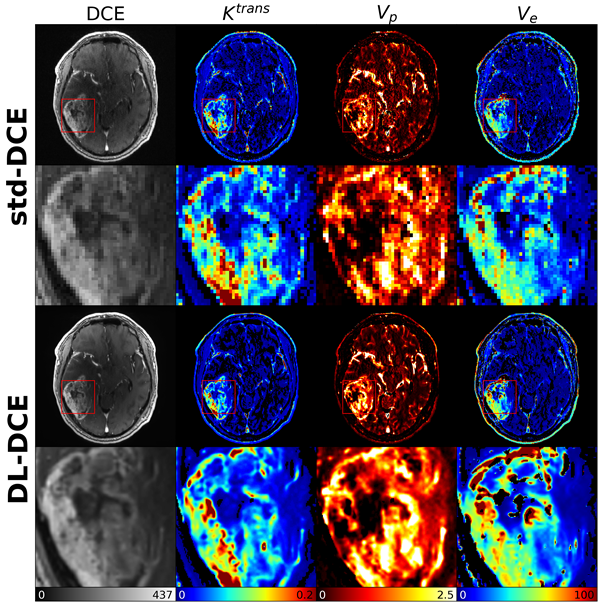
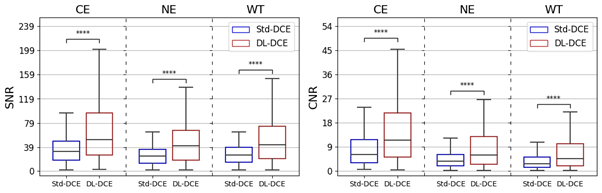
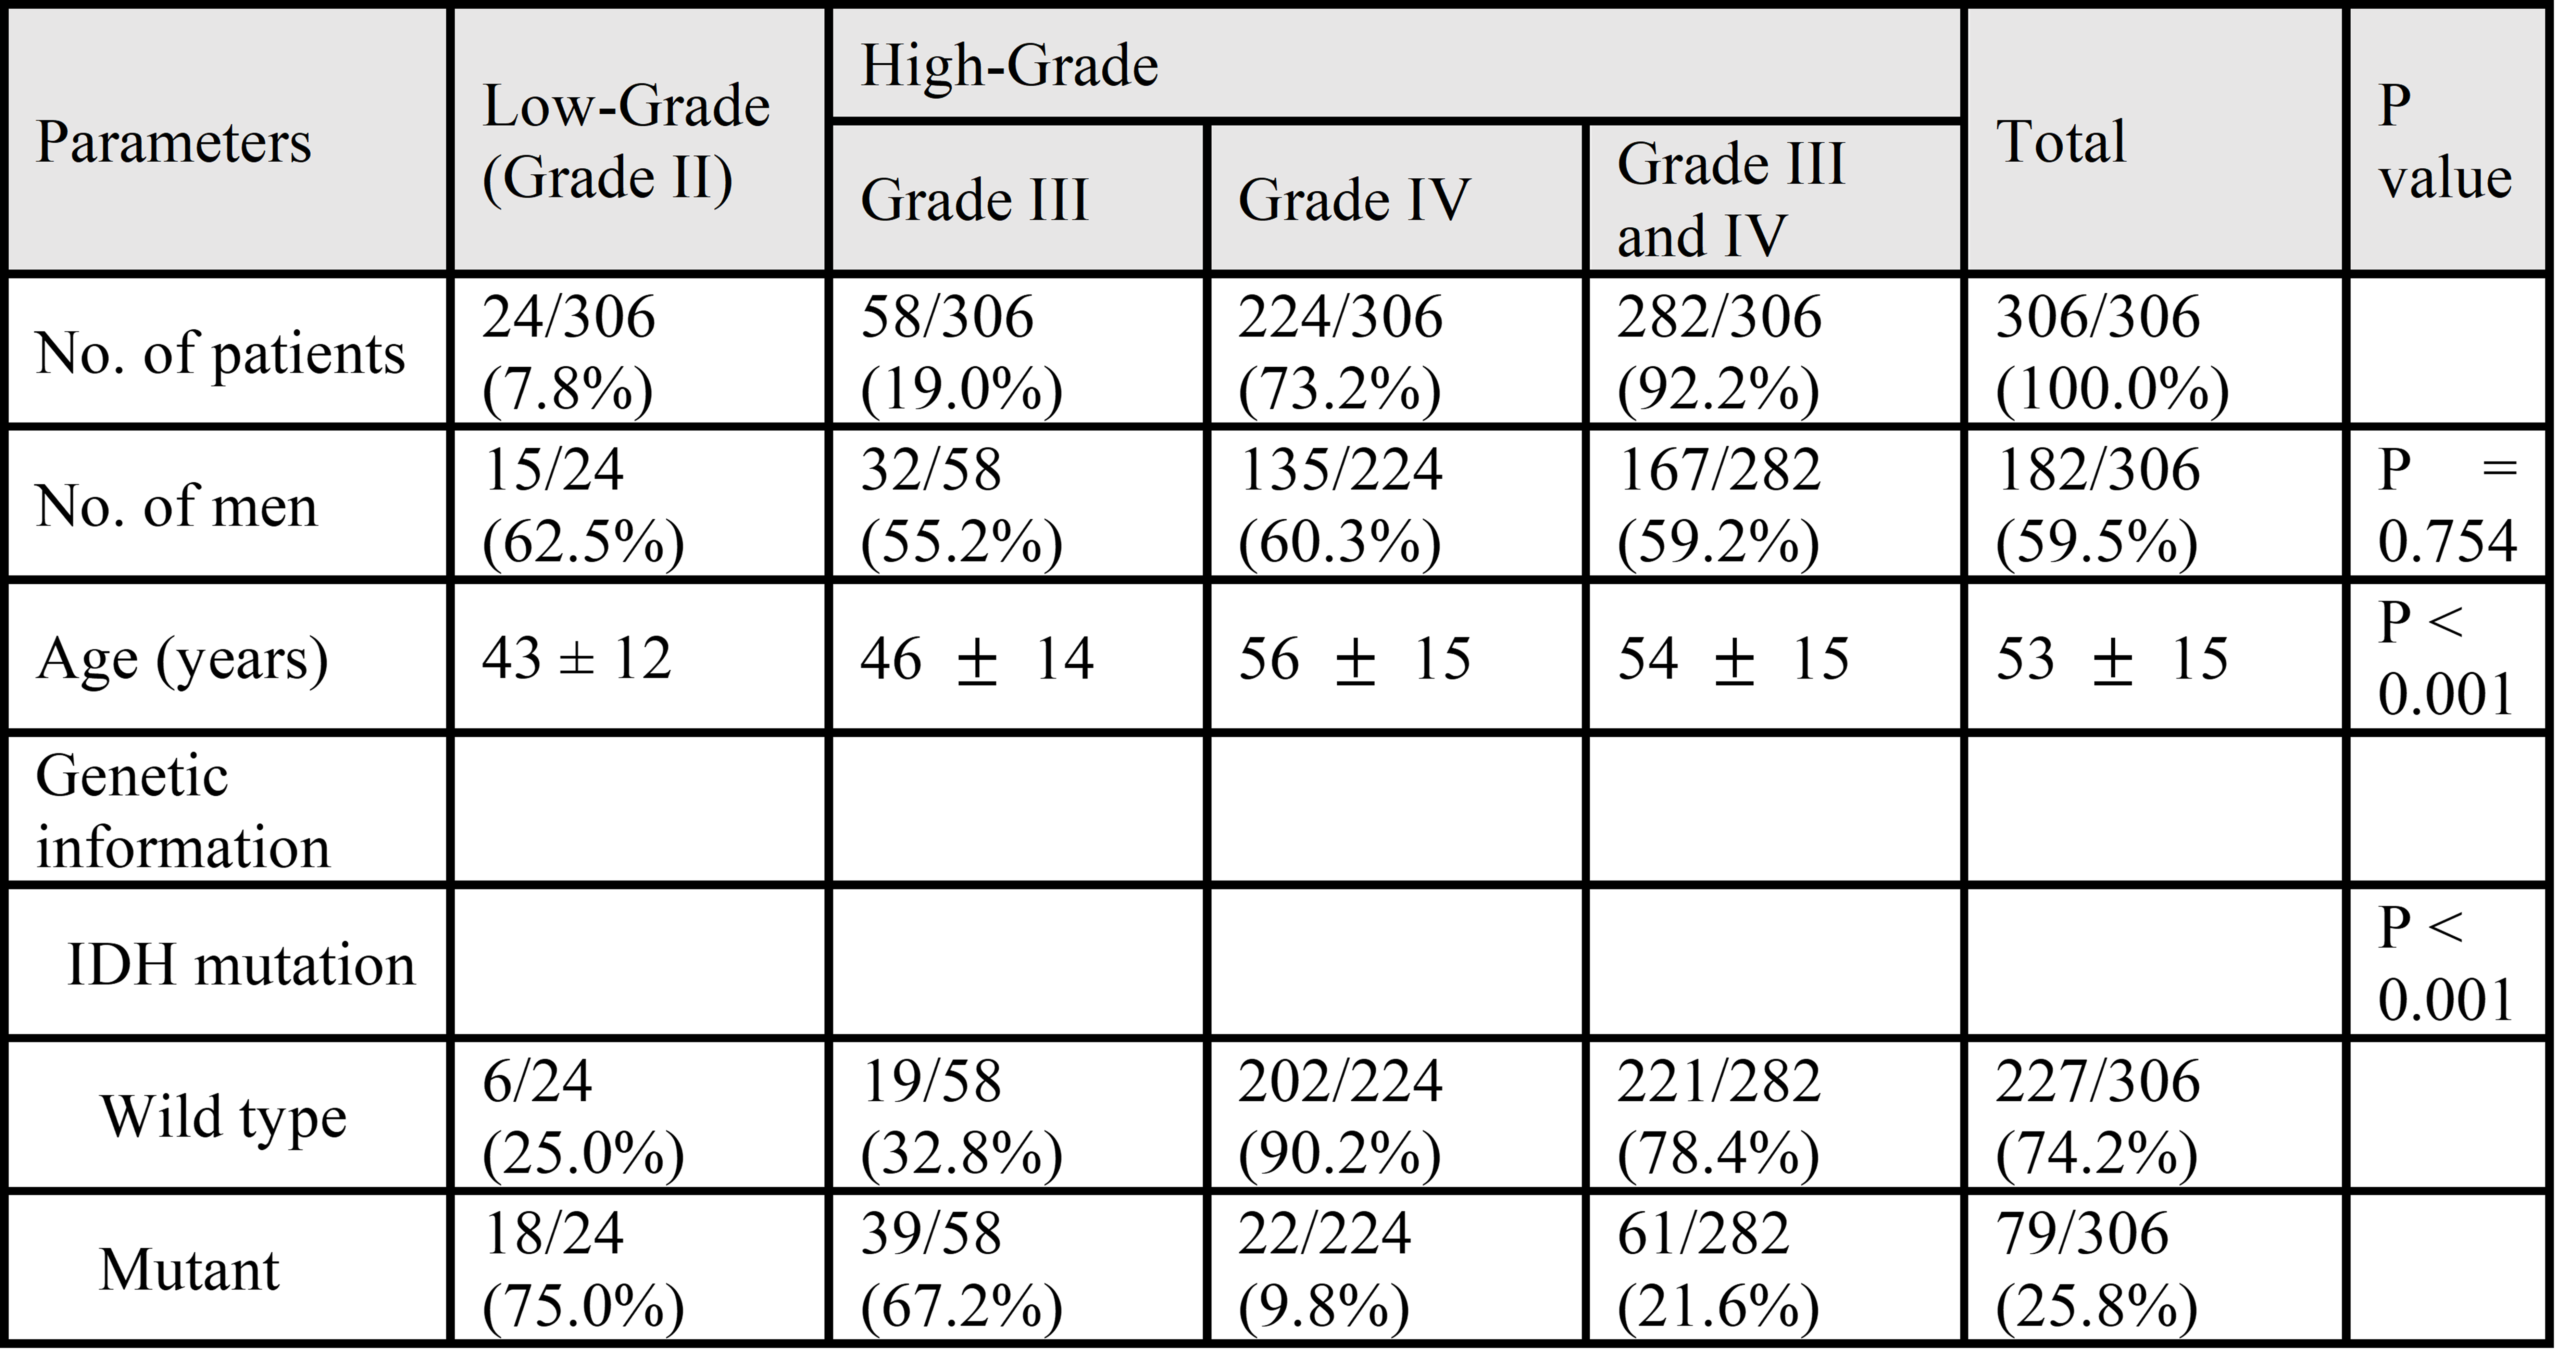
Among 306 patients, 282 (92.2%) had high-grade tumors, and 79 (25.8%) were IDH-mutant (Table 1). Compared to std-DCE, DL-DCE reduced noise and increased spatial resolution from 192x192 to 640x640, while preserving complex structural details (Figure 1). In image quality evaluation, DL-DCE showed significantly higher SNRs than std-DCE (CE, 35.03 vs 68.19; NE, 25.10 vs 47.77; WT, 27.21 vs 52.09, respectively, P < .001 for all). Furthermore, DL-DCE showed higher CNRs compared with std-DCE (CE, 9.23 vs 19.12; NE, 4.71 vs 9.40; WT, 4.02 vs 8.04, respectively, P < .001 for all). Boxplots for SNR, and CNR of std-DCE and DL-DCE were provided in Figure 2.In the differentiation of WHO grades, DL-DCE showed higher diagnostic performance in Ve, and otherwise comparable to std-DCE: Ktrans, 0.79 vs 0.81, P = .46; Vp, 0.56 vs 0.58, P = .60; Ve, 0.83 vs 0.88, P = .02. DL-DCE showed comparable diagnostic performance to std-DCE in the prediction of IDH mutation: Ktrans, 0.76 vs 0.77, P = .46; Vp, 0.57 vs 0.57, P = .87; Ve, 0.80 vs 0.81, P = .21 (Figure 3).
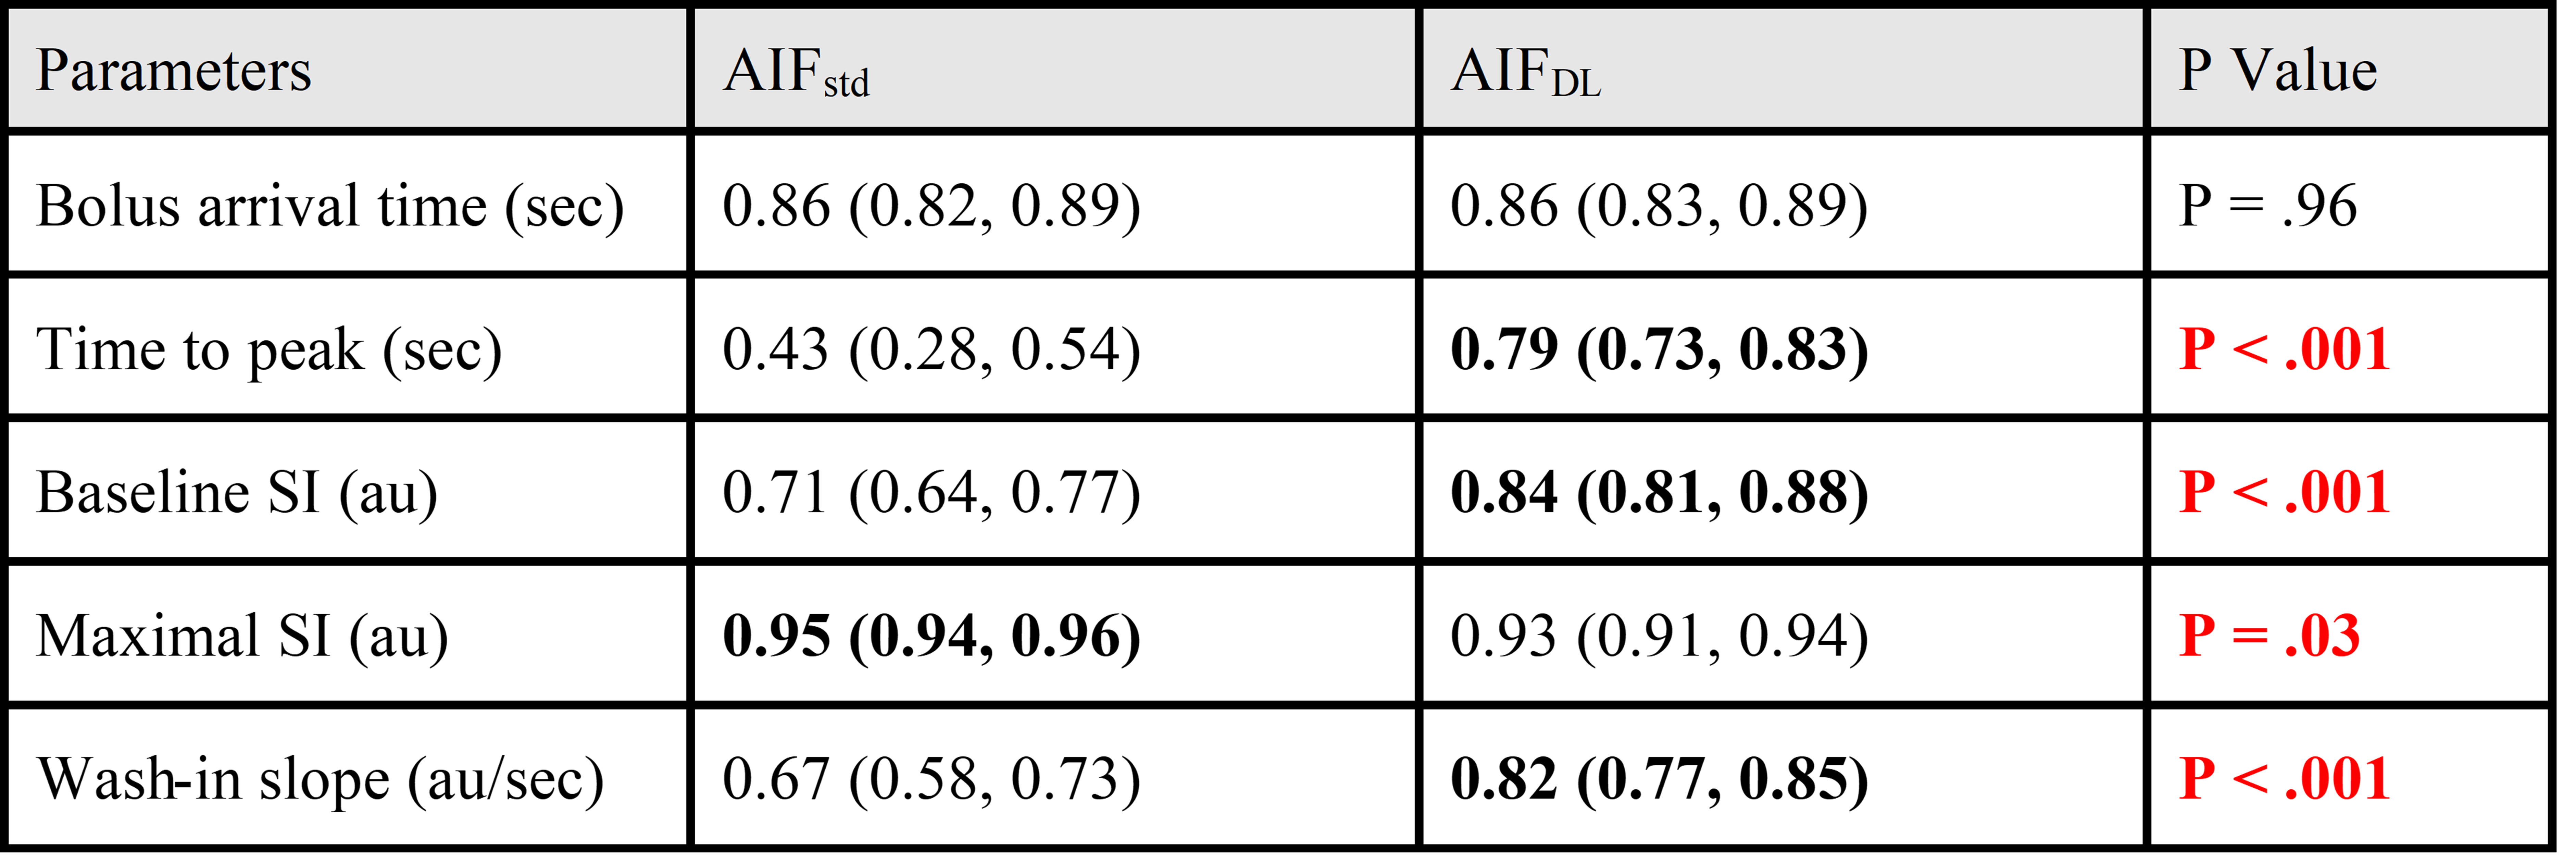
In the reliability of AIF assessment, the parameteres of AIFDL showed higher reliability compared to AIFstd in terms of ICC (Table 2). Especially, most of the AIF parameters, such as time to peak, baseline SI, and wash-in slope, as obtained from AIFDL, showed significantly better agreement in comparison to those obtained from AIFstd (time to peak, 0.79 vs 0.43; baseline SI, 0.84 vs 0.71; wash-in slope, 0.82 vs 0.67, respectively, P < .001 for all).
Conclusions
This study has shown the potential of DLSD to enhance the quality of DCE-MRI, thereby addressing challenges associated with noise and resolution. Quantitative evaluations based on SNR and CNR measurement, ROC analysis, and ICC comparison demonstrates that DLSD improves image quality without compromising the diagnostic performance of DCE-MRI. The improvements in this study have implications for recognizing the potential of DL-enhanced DCE-MRI as a useful tool in the area of medical imaging and analysis.Acknowledgements
This work was supported by the National Research Foundation of Korea(NRF) grant funded by the Korea government(MSIT) (No. RS-2023-00251022) (K.S.C); the Phase III (Postdoctoral fellowship) grant of the SPST (SNU-SNUH Physician Scientist Training) Program (K.S.C); the SNUH Research Fund (No. 04-2023-2050) (K.S.C.); the Bio & Medical Technology Development Program of National Research Foundation of Korea (NRF) grant funded by the Korean government (MSIT) (No. 2021M3E5D2A01022493) (I.H); and the Technology Innovation Program (20011878, Development of Diagnostic Medical Devices with Artificial Intelligence Based Image Analysis Technology) funded by the Ministry of Trade, Industry & Energy (MOTIE, Korea) (J.W.C).References
1. Quantification of cerebral blood flow, cerebral blood volume, and blood–brain‐barrier leakage with DCE‐MRI - Sourbron - 2009 - Magnetic Resonance in Medicine - Wiley Online Library. Accessed October 31, 2023. https://onlinelibrary.wiley.com/doi/10.1002/mrm.22005
2. Cuenod CA, Balvay D. Perfusion and vascular permeability: Basic concepts and measurement in DCE-CT and DCE-MRI. Diagnostic and Interventional Imaging. 2013;94(12):1187-1204. doi:10.1016/j.diii.2013.10.010
3. Khalifa F, Soliman A, El-Baz A, et al. Models and methods for analyzing DCE-MRI: A review. Medical Physics. 2014;41(12):124301. doi:10.1118/1.4898202
4. Tofts PS, Brix G, Buckley DL, et al. Estimating kinetic parameters from dynamic contrast-enhanced t1-weighted MRI of a diffusable tracer: Standardized quantities and symbols. Journal of Magnetic Resonance Imaging. 1999;10(3):223-232. doi:10.1002/(SICI)1522-2586(199909)10:3<223::AID-JMRI2>3.0.CO;2-S
5. Li X, Huang W, Rooney WD. Signal-to-noise ratio, contrast-to-noise ratio and pharmacokinetic modeling considerations in dynamic contrast-enhanced magnetic resonance imaging. Magnetic Resonance Imaging. 2012;30(9):1313-1322. doi:10.1016/j.mri.2012.05.005
6. Wang P, Xue Y, Zhao X, Yu J, Rosen M, Song HK. Effects of flip angle uncertainty and noise on the accuracy of DCE-MRI metrics: comparison between standard concentration-based and signal difference methods. Magn Reson Imaging. 2015;33(1):166-173. doi:10.1016/j.mri.2014.10.005
7. Rata M, Collins DJ, Darcy J, et al. Assessment of repeatability and treatment response in early phase clinical trials using DCE-MRI: comparison of parametric analysis using MR- and CT-derived arterial input functions. Eur Radiol. 2016;26(7):1991-1998. doi:10.1007/s00330-015-4012-9
8. Port RE, Knopp MV, Brix G. Dynamic contrast-enhanced MRI using Gd-DTPA: interindividual variability of the arterial input function and consequences for the assessment of kinetics in tumors. Magn Reson Med. 2001;45(6):1030-1038. doi:10.1002/mrm.1137
9. Reproducibility of Dynamic Contrast-enhanced MR Imaging. Part I. Perfusion Characteristics in the Female Pelvis by Using Multiple Computer-aided Diagnosis Perfusion Analysis Solutions | Radiology. Accessed August 10, 2023. https://pubs.rsna.org/doi/full/10.1148/radiol.12120278
10. Tofts PS. Modeling tracer kinetics in dynamic Gd-DTPA MR imaging. Journal of Magnetic Resonance Imaging. 1997;7(1):91-101. doi:10.1002/jmri.1880070113
11. Isensee F, Jaeger PF, Kohl SAA, Petersen J, Maier-Hein KH. nnU-Net: a self-configuring method for deep learning-based biomedical image segmentation. Nat Methods. 2021;18(2):203-211. doi:10.1038/s41592-020-01008-z
12. Kickingereder P, Isensee F, Tursunova I, et al. Automated quantitative tumour response assessment of MRI in neuro-oncology with artificial neural networks: a multicentre, retrospective study. The Lancet Oncology. 2019;20(5):728-740. doi:10.1016/S1470-2045(19)30098-1
Figures