1972
Deep learning-based MRI denoising enhances the reliability of whole-brain volumetric analysis1Medical Imaging AI Research Center, Canon Medical Systems Korea, Seoul, Korea, Republic of, 2College of Medicine, Seoul National University, Seoul, Korea, Republic of, 3Magnetic Resonance Business Unit, Canon Medical Systems Korea, Seoul, Korea, Republic of, 4Department of Radiology, Yonsei University Wonju College of Medicine, Wonju, Korea, Republic of
Synopsis
Keywords: Data Processing, Brain
Motivation: This study investigates the impact of deep learning-based image reconstruction (DLR) in structural brain MRI volumetric analysis.
Goal(s): To demonstrate that DLR effectively reduces noise and enhances image quality with short acquisition time,
Approach: Ten healthy subjects were scanned with a 3T MRI system with and without DLR reconstruction.
Results: Voxel-based morphometry analysis revealed significant improvements in brain volumetric measurements with DLR compared to conventional methods. These advancements are particularly relevant in regions associated with neurodegenerative diseases.
Impact: DLR offers the potential to facilitate earlier detection and monitoring of such conditions, providing clinical value with comparable scan duration.
Purpose
Brain MRI has become a part of the clinical practice to provide diagnostic insights into structural changes associated with neurodegenerative diseases1. Given the close relationship between neurodegenerative changes and clinical symptoms, the volumetric measurement on structural MRI serves as a potent biomarker for these conditions2. To facilitate precise assessments, it is imperative to achieve less noisy and higher contrast imaging. Unfortunately, conventional image reconstruction methods face inherent limitations, as they typically have the trade-off between signal-to-noise (SNR) ratio and scan duration, making it challenging to achieve superior image quality within a relatively short acquisition time. Recently, deep learning-based image reconstruction (DLR) has been commercially introduced to improve the image quality through denoising using deep convolutional neural network (DCNN), thereby allowing the acquisition of high-quality images in a shorter time3. Therefore, we investigated the practical usefulness of DLR in structural MRI for brain volumetry by comparing images reconstructed using conventional methods with those reconstructed using deep learning techniques.Materials & Methods
Brain structural MRI data were acquired from ten healthy subjects (M/F=6/4; 25~50 years old) on 3T MRI (Canon Medical Systems, Vantage Galan STD) equipped with a 16-channel head and neck coil. From each subject, three different T1-weighted structural MR images were obtained using a 3D-MPRAGE sequence (TI/TR/TE=1000/7.5/3.3ms, flip angle=10°, spatial resolution=1×1×1mm3, SPEEDER (SENSE) acceleration along the PE direction=2); 1) a original image without any filtering (NEX=1, scan time=5 mins 58 secs), 2) an image with DLR (Advanced intelligent Clear-IQ Engine, AiCE), and 3) a high SNR image assumed as a potential ground truth dataset (NEX=3, scan time=17 mins 54 secs). The DLR approach we adapted is based on a DCNN trained with extensive pairs of low and high SNR images3. This network discriminates between signal and noise, allowing the removal of noise contribution from the original images. It effectively reduces noise, particularly in central part of the images, addressing non-uniform noise patterns by the g-factor in parallel imaging. For brain voxel-based morphometry (VBM), we performed the preprocessing pipeline using CAT 124 toolbox integrated into the SPM12 software5. The images were spatially normalized to the standard MNI space and segmented into tissue classes of gray matter (GM), white matter, and cerebrospinal fluid using the DARTEL approach, resulting in a cubic resolution of 1.5 mm. The normalized GM maps were subsequently smoothed with a 6-mm FWHM Gaussian kernel. Additionally, we obtained volumetric parcellations describing subcortical GM volumes of six ROIs including caudate, putamen, pallidum, thalamus, hippocampus, and amygdala labeled by the Neuromorphometrics atlas (http://www.neuromorphometrics.com/). To investigate potential volumetric differences in GM maps across the entire brain between groups, two-sample t-test (e.g., original vs. DLR, original vs. NEX=3) was performed with statistical significance set at an uncorrected p < 0.001. For quantification of subcortical areas, repeated one-way ANOVA was conducted, followed by Bonferroni multiple comparison test, with significance at p < 0.05.Results
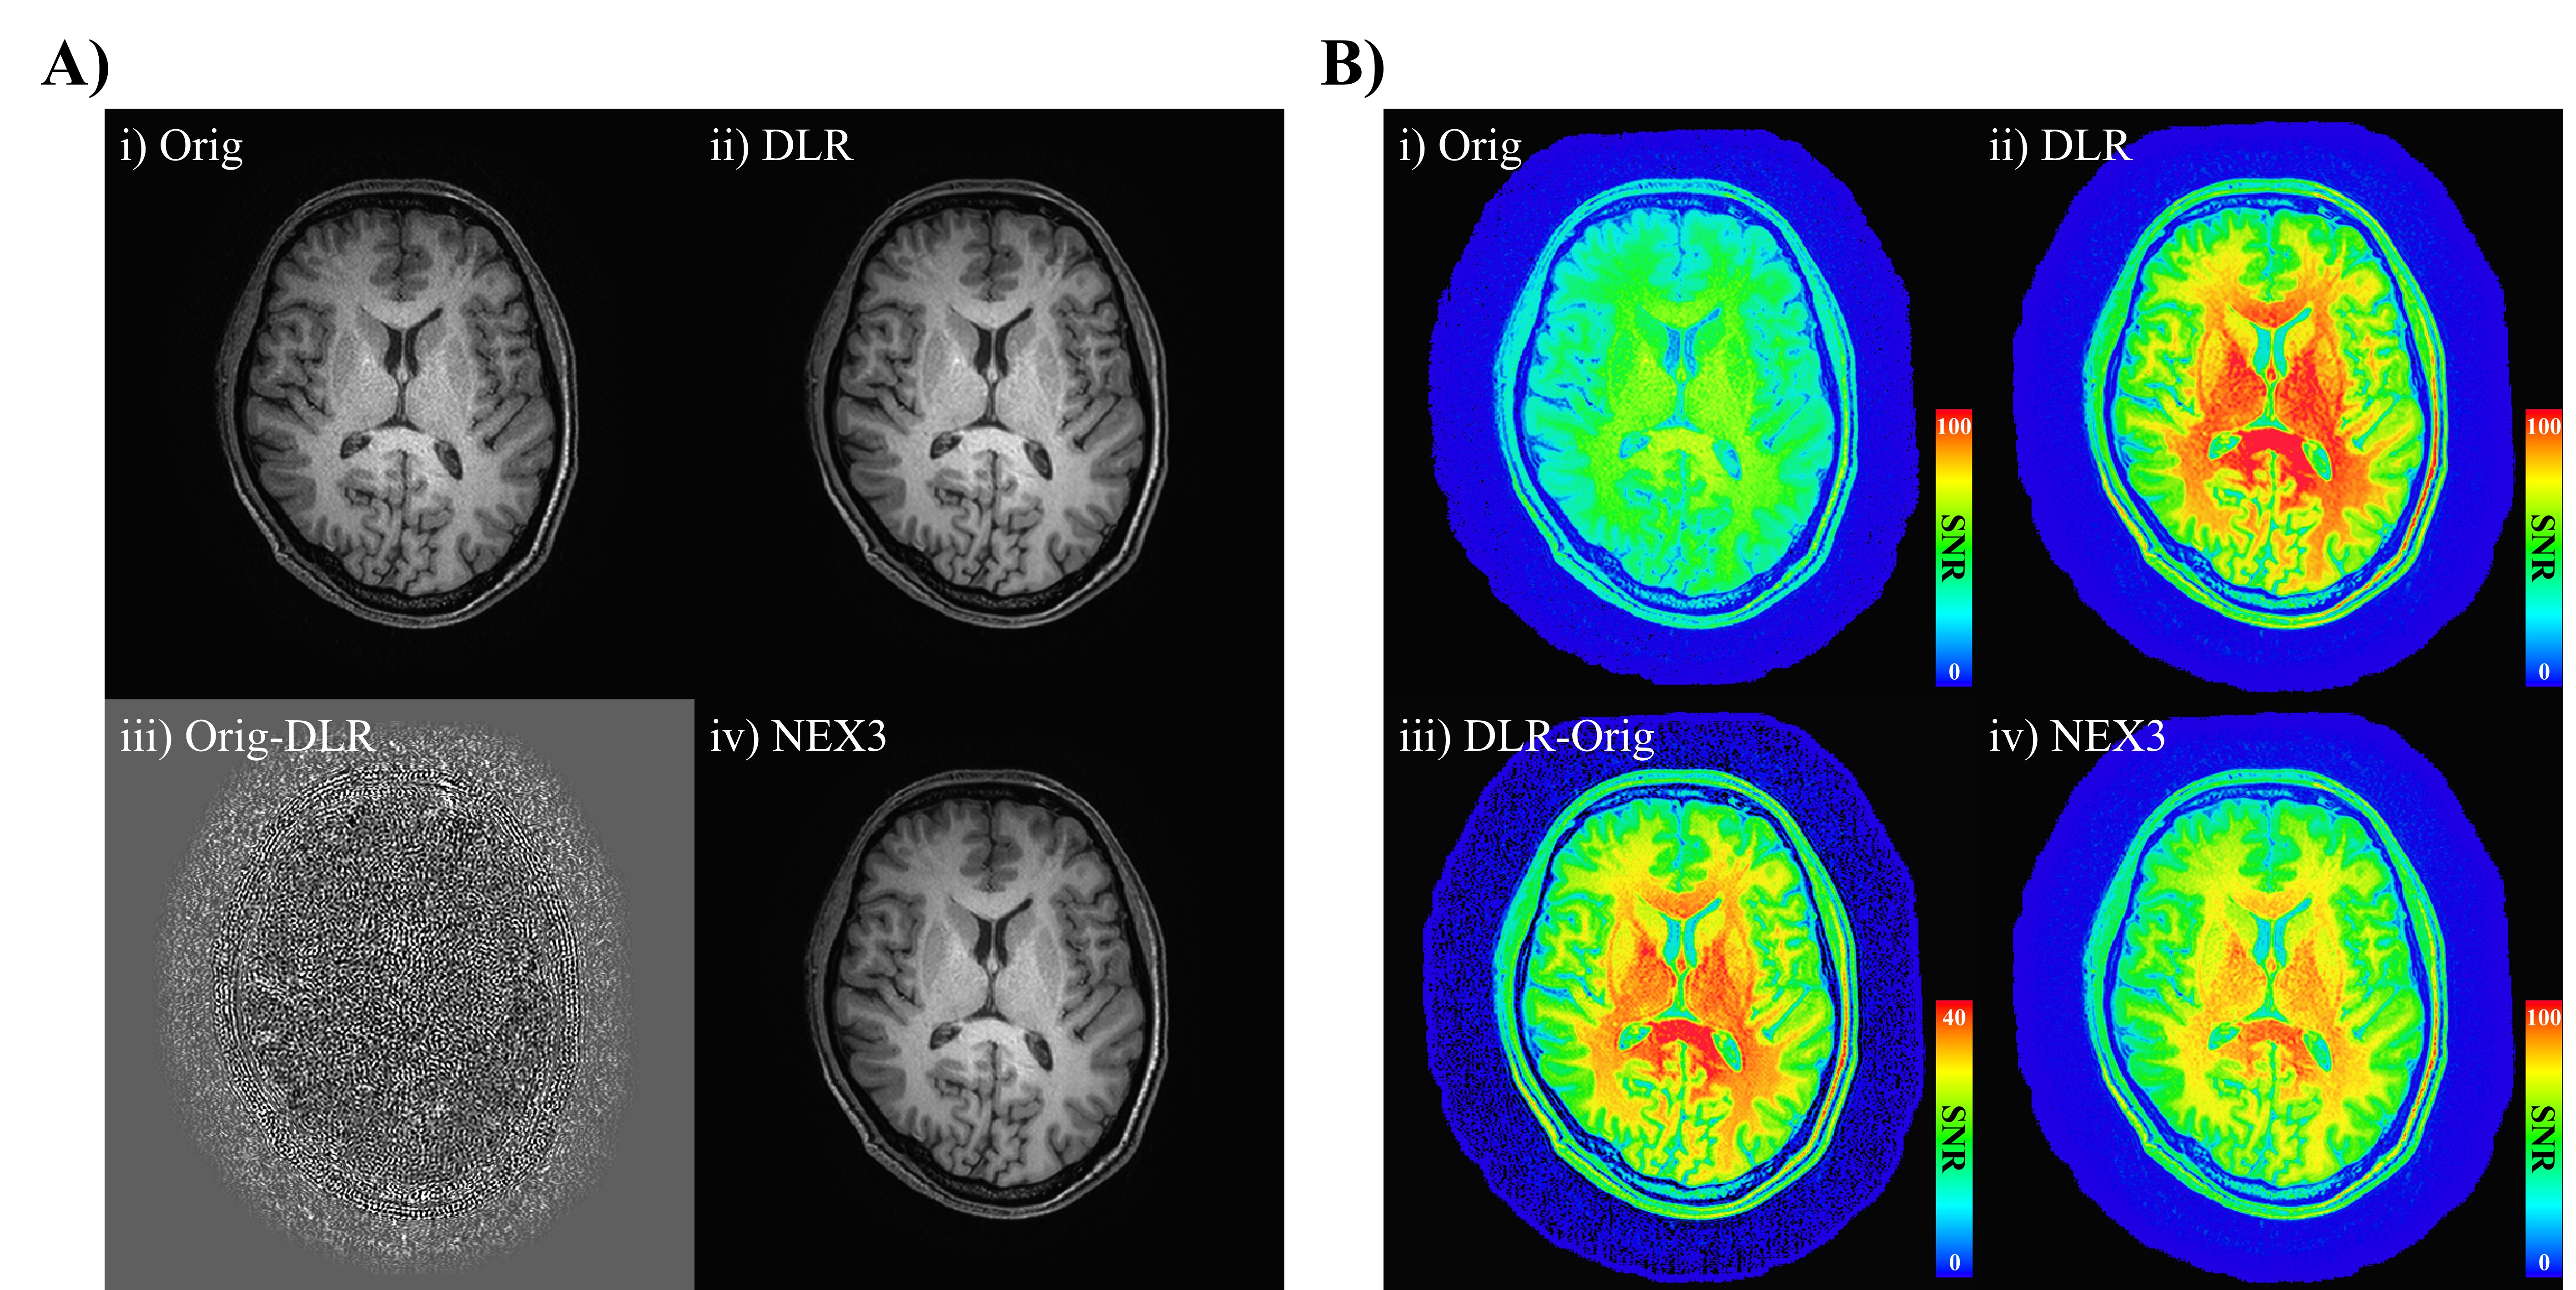
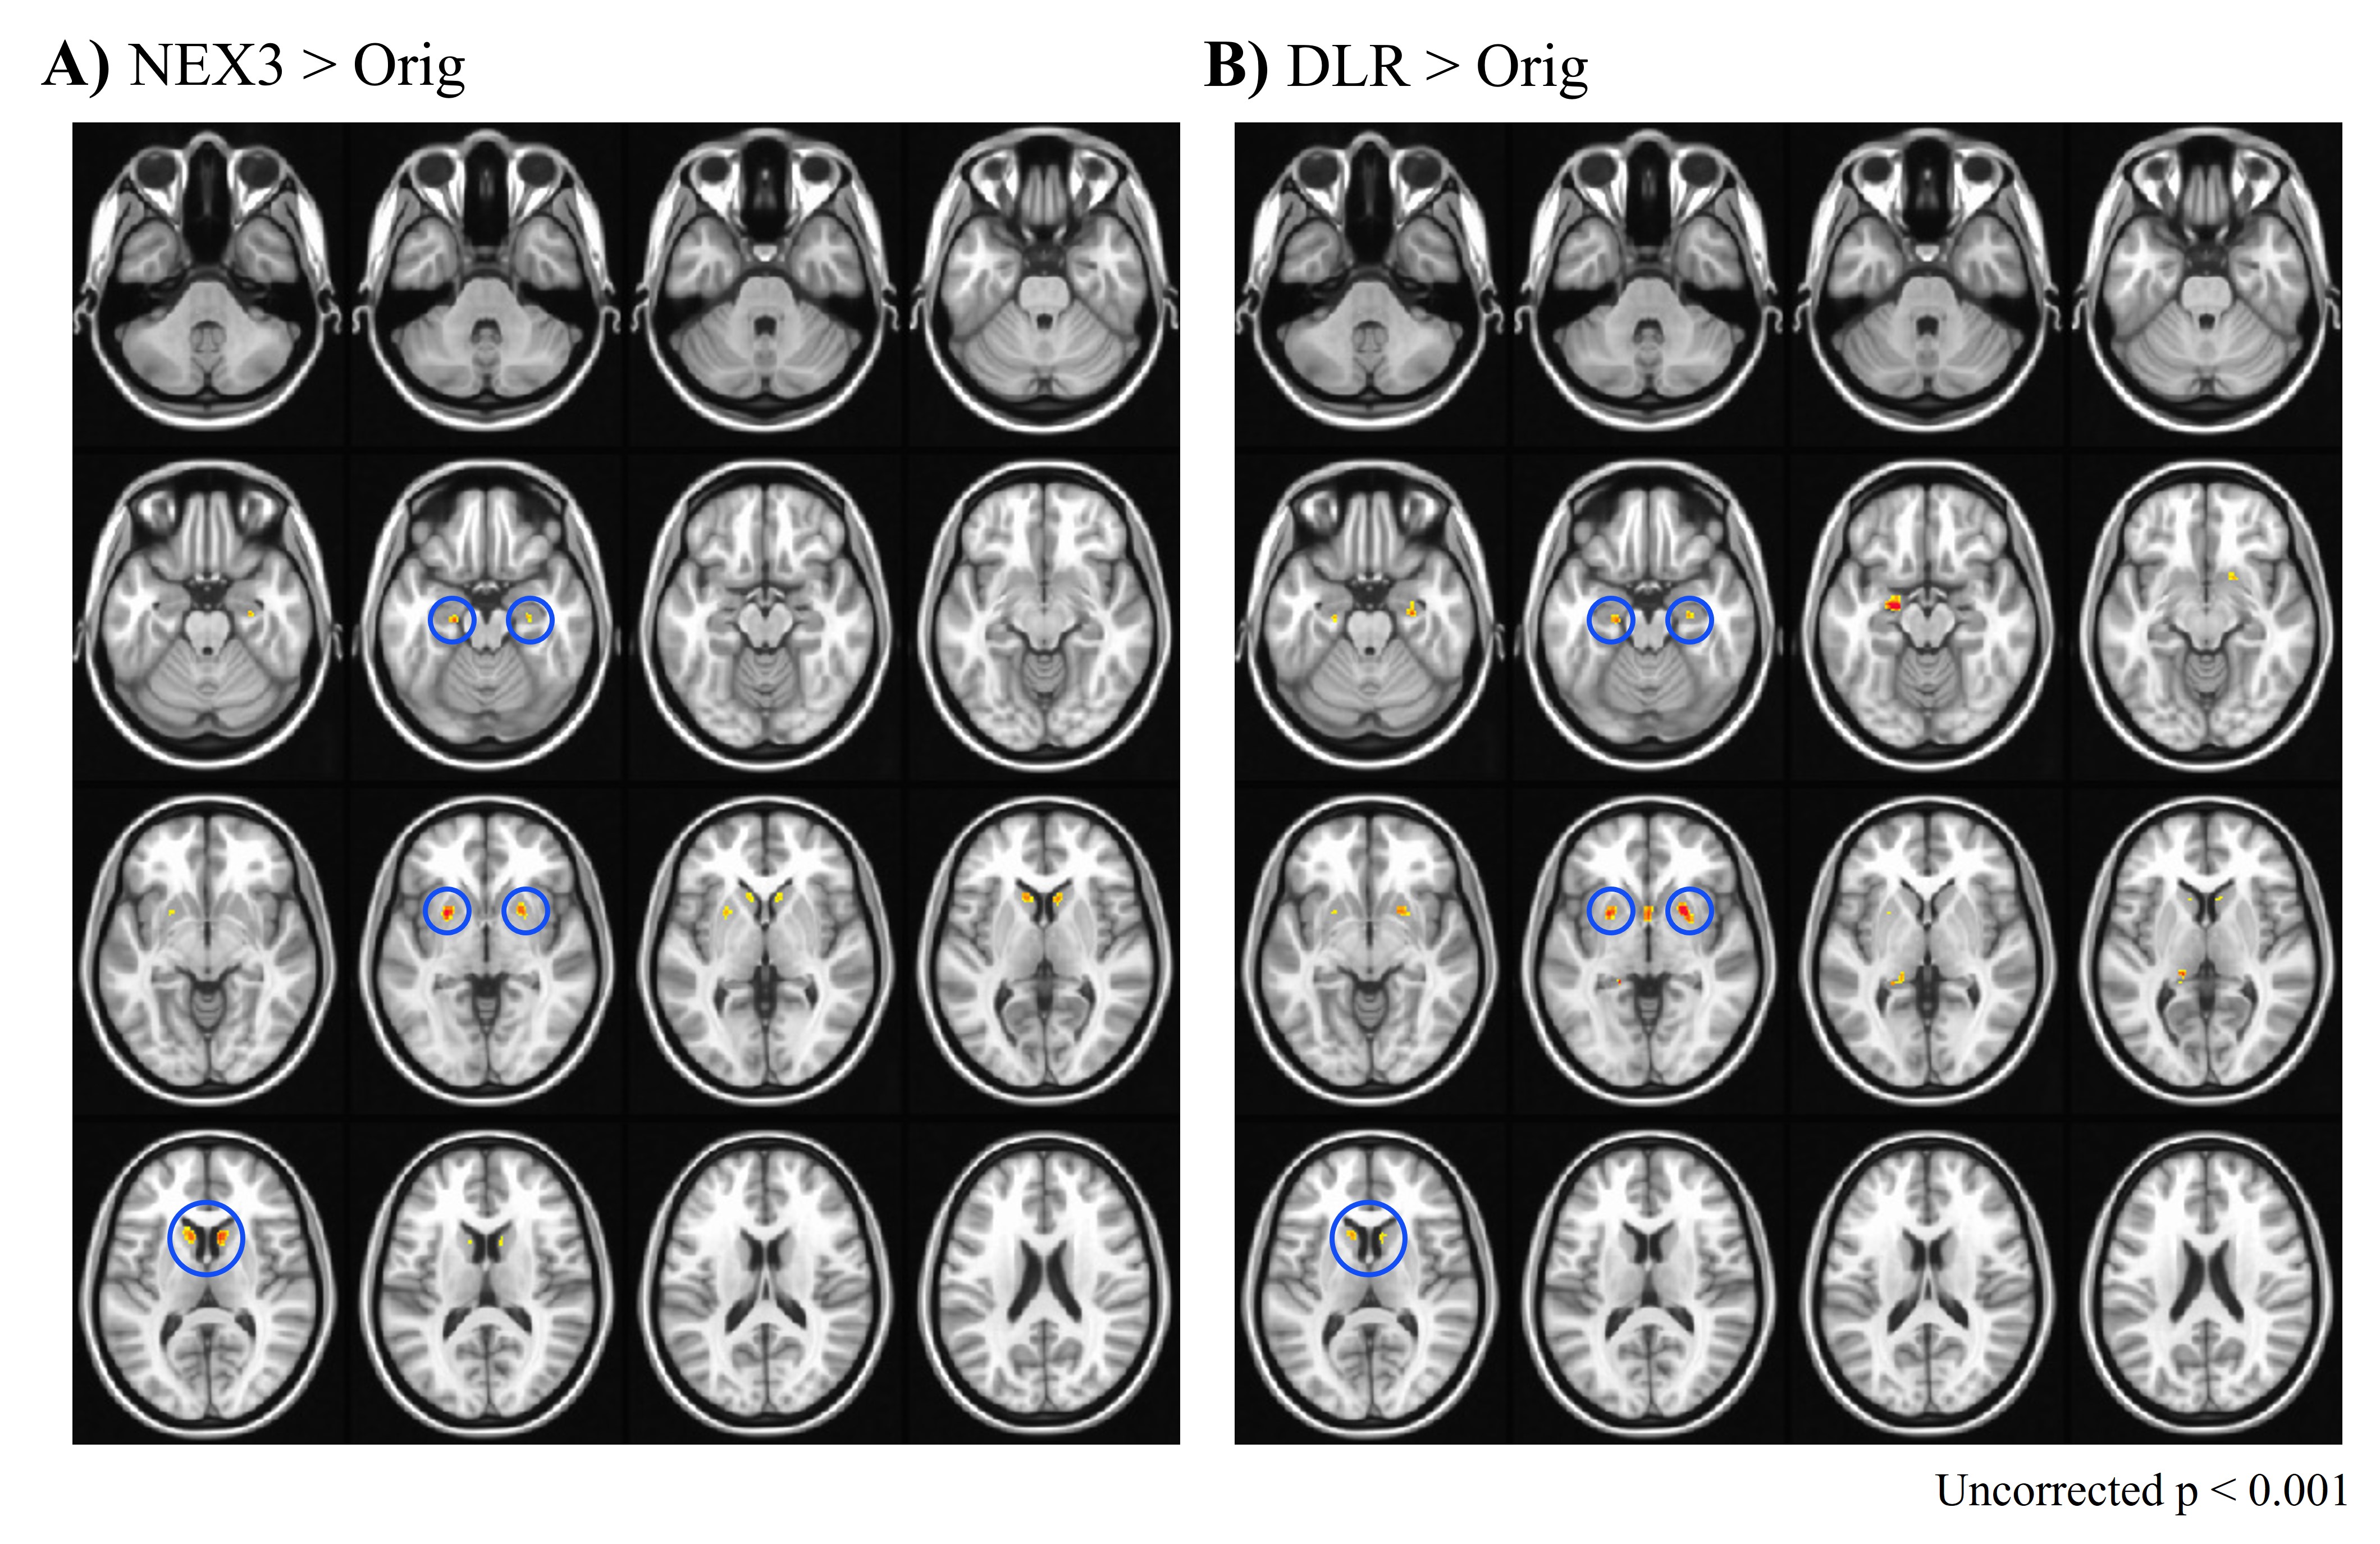
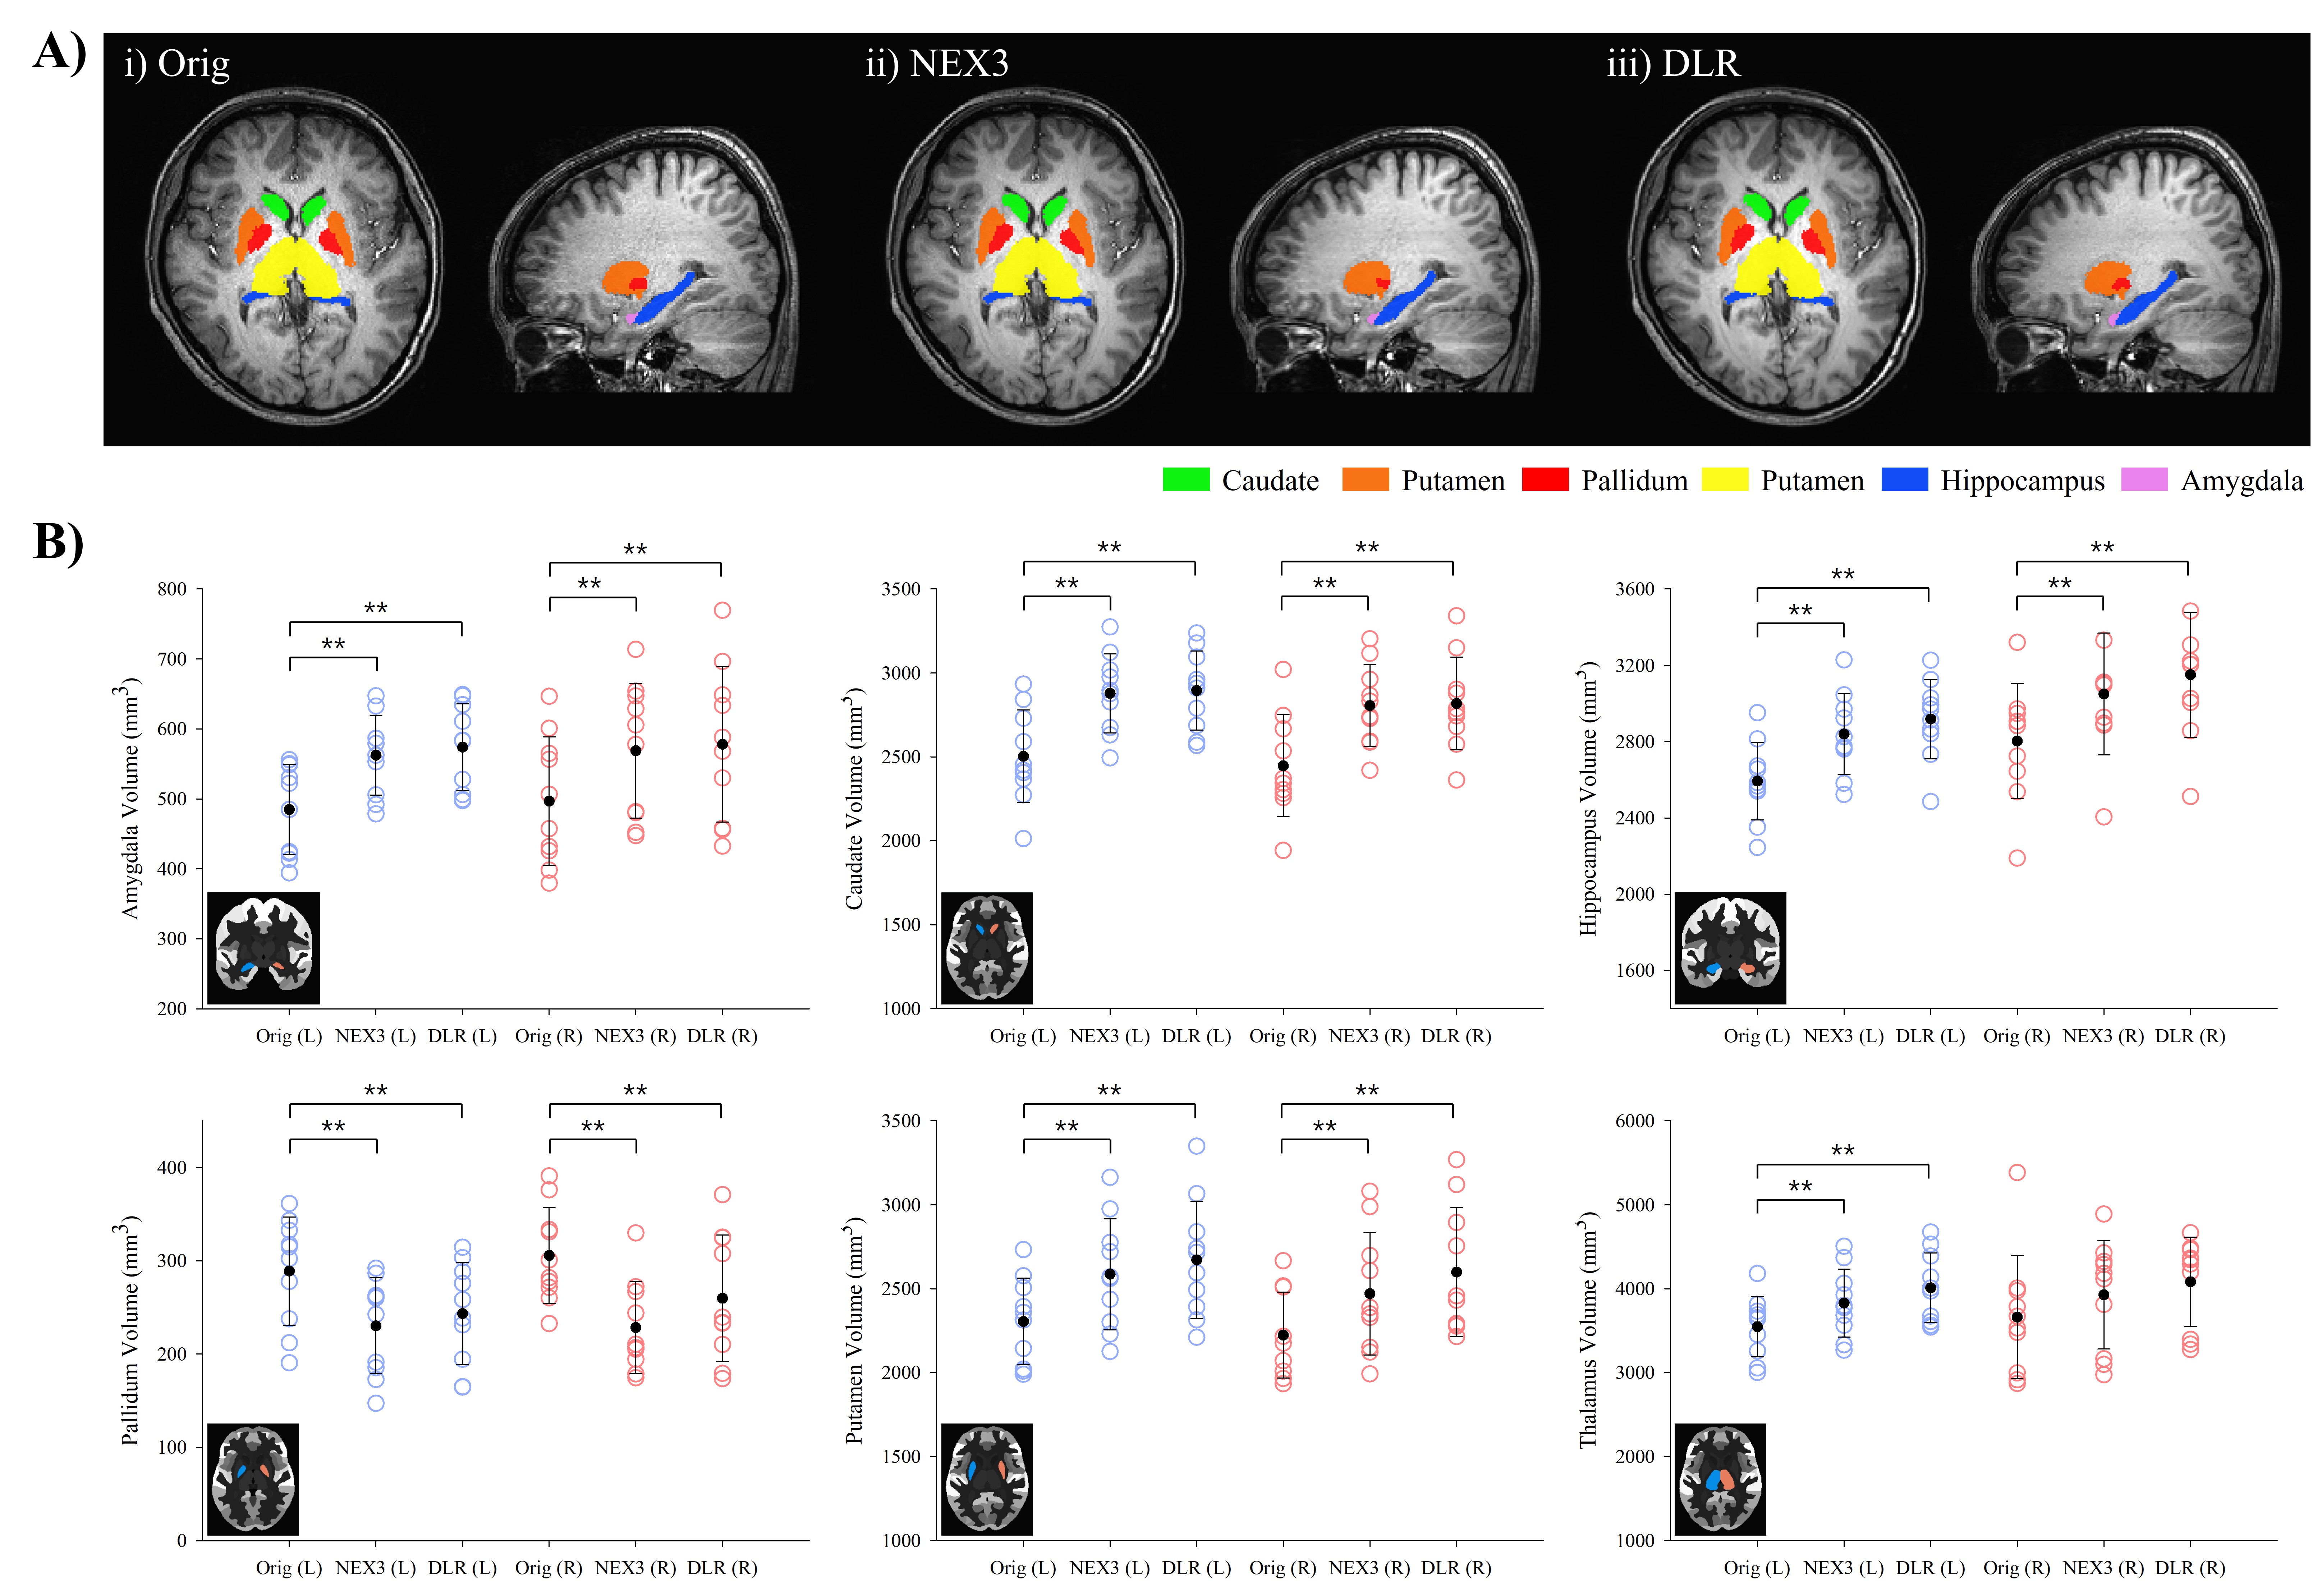
Figure 1 shows a comparison of axial images and SNR maps without and with DLR approaches. In subtraction of images with DLR from original images, the non-uniform noise was reduced without significant loss of structural information (Fig.1A-iii). In VBM analysis, GM volumes obtained from original images (NEX=1) commonly showed a significant reduction in bilateral caudate, putamen, hippocampus, and left amygdala regions, compared with those derived from higher SNR images (NEX=3, Fig.2A) and images with DLR (Fig.2B). No significant alterations were observed in the reverse contrast or between the higher SNR images and images with DLR. Furthermore, the comparison of subcortical volumetry across different image acquisitions (Fig.3A) exhibited volume variability similar with the brain VBM analysis. In general, the volumes measured in original images were underestimated compared to images with higher SNR, except for the pallidum, where an overestimation was observed. These findings from both VBM and subcortical volumetry underscore the substantial effects of image SNR on the quantitative measures of automated brain morphometry.Discussion & Conclusion
The quantitative analysis of brain MRI is increasingly recognized as valuable complement tool in the clinical practice6. Using T1-weighted brain MRI with open-source software package for automated brain volumetric measurement, we demonstrated that the level of image noise directly impacts on performances of tissue segmentation and quantitative assessments of brain volumetric changes. The brain atrophy in basal ganglia and hippocampal regions, which exhibited volumetric differences based on image qualities in this study, are well-established as clinical imaging biomarkers associated with neurodegenerative diseases such as Alzheimer's disease2 and frontotemporal dementia7. Therefore, our findings suggest the potential advantages of denoising approaches with DLR, not requiring additional scan time, to enhance the reliability of brain volumetric quantification as screening tools in clinical decision-making.Acknowledgements
No acknowledgement found.References
1. Vemuri P, Jack CR Jr. Role of structural MRI in Alzheimer's disease. Alzheimers Res Ther. 2010;2(4):23.
2. Jung WB, Lee YM, Kim YH, Mun CW. Automated Classification to Predict the Progression of Alzheimer's Disease Using Whole-Brain Volumetry and DTI. Psychiatry Investig. 2015;12(1):92-102.
3. Kidoh M, Shinoda K, Kitajima M, et al. Deep Learning Based Noise Reduction for Brain MR Imaging: Tests on Phantoms and Healthy Volunteers. Magn Reson Med Sci. 2020;19(3):195-206.
4. Gaser C, Dahnke R, Kurth K, Luders E, Alzheimer"s Disease Neuroimaging Initiative. A Computational Anatomy Toolbox for the Analysis of Structural MRI Data. bioRxiv.
5. Ashburner J, Friston KJ. Unified segmentation. Neuroimage. 2005;26(3):839-851.
6. Rebsamen M, Capiglioni M, Hoepner R, et al. Growing importance of brain morphometry analysis in the clinical routine: The hidden impact of MR sequence parameters [published online ahead of print, 2023 Apr 26]. J Neuroradiol. 2023;S0150-9861(23)00198-0.
7. Broe M, Hodges JR, Schofield E, Shepherd CE, Kril JJ, Halliday GM. Staging disease severity in pathologically confirmed cases of frontotemporal dementia. Neurology. 2003;60(6):1005-1011.
Figures