1961
Decoding Brain Dynamic Functional Connectivity Implicated in ADHD via Graph Neural Networks and Transformers1School of Computer Science and Engineering, Nanyang Technological University, Singapore, Singapore
Synopsis
Keywords: Diagnosis/Prediction, Machine Learning/Artificial Intelligence, Dynamic Functional Connectivity
Motivation: Few studies have investigated the potential of using dynamic functional connectivity for Attention Deficit Hyperactivity Disorder (ADHD) diagnosis and biomarker discovery.
Goal(s): The goal of this study is to effectively capture spatiotemporal dynamic features in resting state fMRI data for detection of ADHD subjects.
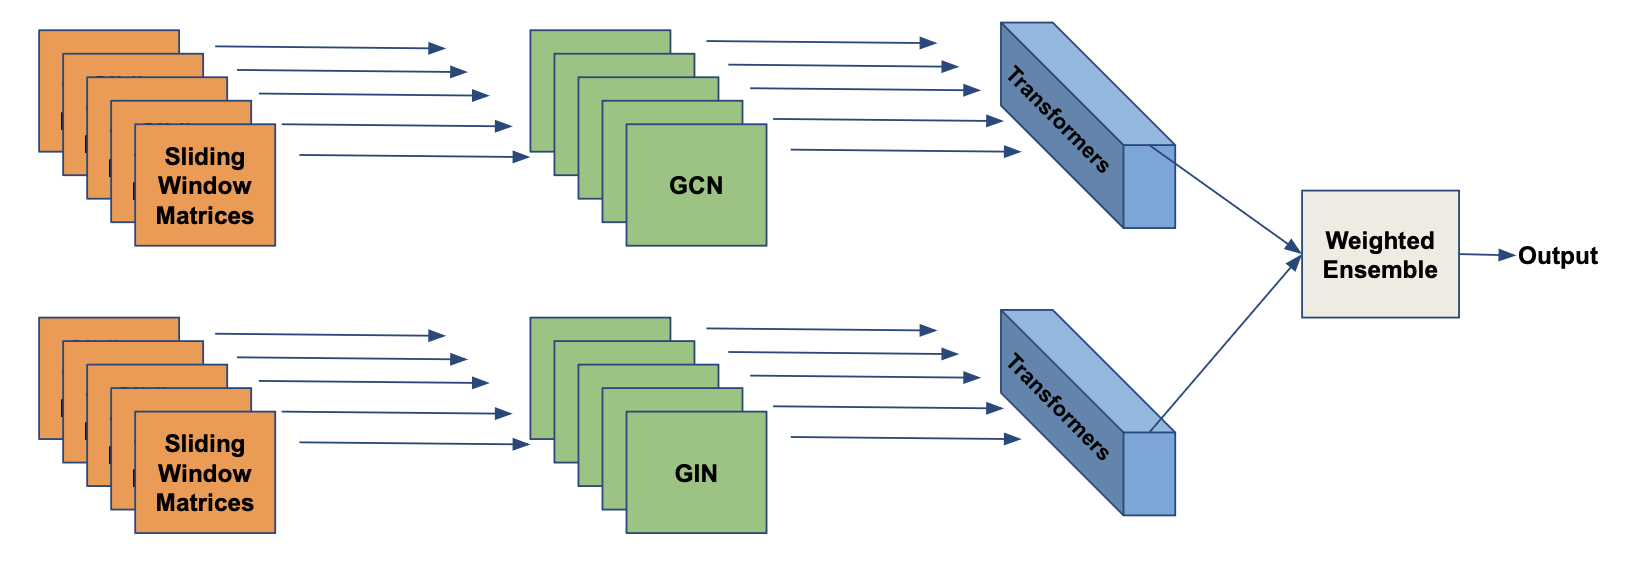
Approach: We present a novel ensemble framework that combines the strengths of Graph Convolutional Networks (GCN), Graph Isomorphism Networks (GIN), and Transformers.
Results: On ADHD-200 dataset, our framework outperforms other state-of-the-art models for ADHD detection. By using explainable AI, we generated biomarkers for ADHD which are consistent with the existing literature.
Impact: Innovative integration of GCN, GIN, and Transformers in our proposed framework enables analysis of effective dynamic functional connectivity for ADHD diagnosis. The classification performance outperforms existing state-of-the-art models and generated biomarkers further affirm its usefulness of our methods.
Introduction
Dynamic functional connectivity (dFC) is an extension of traditional functional connectivity (FC), which accounts for variations in brain-wide connectivity patterns as they evolve over time [1]. There is recent converging evidence that dFC analysis are better suited for detecting neurological diseases compared to static FC methods [2-4]. To analyse temporal dynamics of functional connectivity, GCN, GIN and Transformers architectures were used [5-8]. These models can learn spatial and temporal features in the data and improves representation learning and discriminative power of the deep learning models. The main difference between GCN and GIN lies in the way they aggregate information of neighboring nodes in a graph from one layer to the next layer. In this context, we hypothesize that using the expressive power both GCN and GIN leads to better disease classification performance, than using either of the two separately.Methods
ADHD-200 [9] contains 279 resting state fMRI scans of subjects diagnosed with ADHD and 488 typical controls of similar age, collected from 4 sites:- NI, NYU, OHSU and PKU. To generate dynamic brain networks, we segment the BOLD signals into a series of overlapping rectangular windows of length 60s and stride size 1s, following the best suggested practices [10, 11]. For our experiments, we used the Power atlas [12] for parcellating the whole brain region into 264 distinct regions of interest (ROIs). The functional connectivity (FC) matrix was derived by computing the Pearson correlation between the mean activation timeseries of each pair of ROIs. We calculated dynamic FC matrices for each sliding window. Our ensemble-based framework leverages on GCN [13], GIN [14] and Transformers [15] to capture spatiotemporal dynamic representations within brain networks (Figure 1).Results
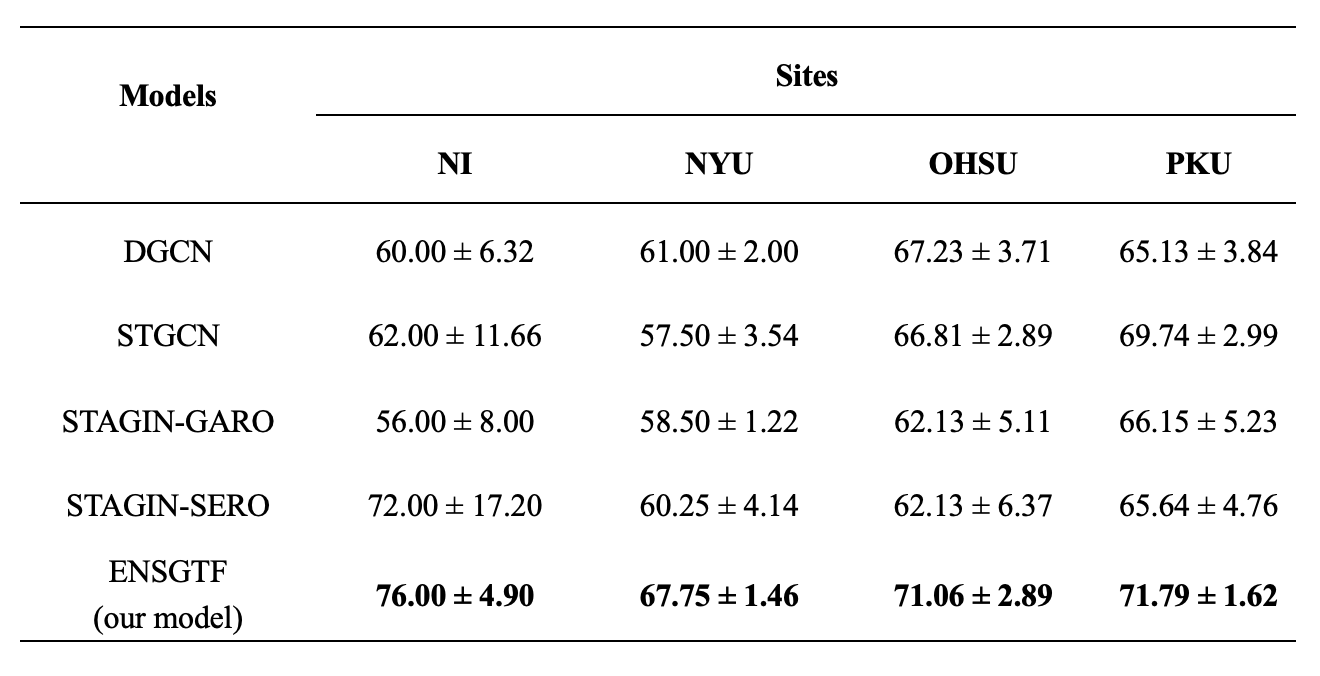
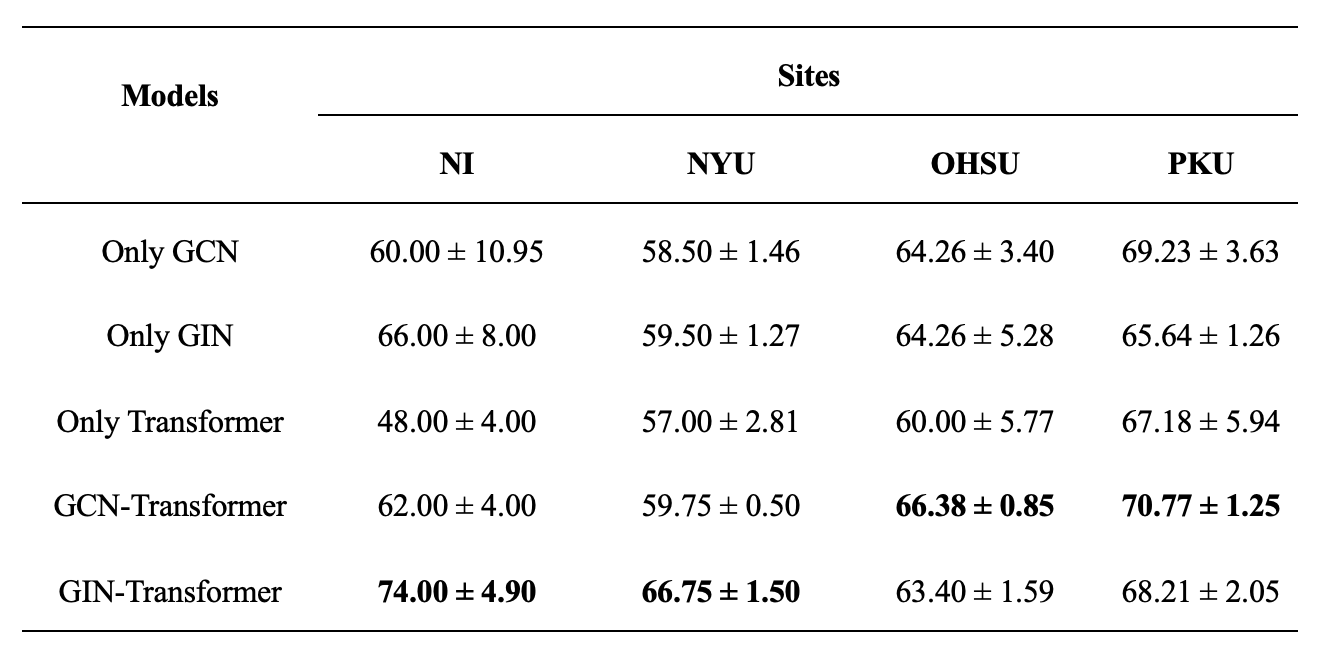
For all the experiments, model training and evaluation were repeated over 5 seeds. Same set of hyperparameters {hidden dimension = 128, number of transformer layers = 1, output dimension = 2} was used across all sites. However, for sites NYU, OHSU and PKU, we used 8 transformers heads and a dropout rate of 0.6. For site NI, we set the number of transformers heads and dropout rate to 2 and 0.4, respectively. Data from all sites were split into train-validation-test sets at ratio 6:2:2. We performed gradient descent learning with Adam optimizer at a learning rate of 0.001. To assess our model, we compared its performance on site-specific disease classification to current state-of-the-art dFC models based on GNNs and Transformer architectures, including: DGCN [16], ST-GCN [5] and STAGIN [6] (Table 1). As seen from Table 1, our model outperformed existing methods in detecting ADHD.We also performed an ablation study to highlight the effectiveness of our model framework design (Table 2). For model interpretability, attention scores were utilised to identify crucial sliding time windows. We then implemented Integrated Gradients [17] to produce saliency features, which are based on node feature importance scores, revealing their contribution to the classification task.
Discussion
In GCN, the aggregation operation is based on simplified Laplacian smoothing, which allows the GCN to capture more linear relationships in the graph. Meanwhile, GIN uses a more expressive aggregation function by performing element-wise addition of neighbour features and applying a fully connected layer with activation. This gives the GIN a better discriminative power than GCN and allows it to capture non-linear relationships in the graph. As the capabilities of GCN and GIN are different, it is fair to assume that they are bound to make different mistakes during classification. By creating an ensemble, we are taking advantage of this behavior. Hence, our model shows superior classification performance. This is also reflected in the ablation study results. The GIN component does well on sites NI and NYU while the GCN component does well on sites OHSU and PKU.Attention scores from the Transformer layer revealed that segment 194 exhibited the highest saliency and made the most significant contribution to predicting an ADHD. This was calculated by ranking the most salient segments after considering all time window segments of the signal from 4-dimensional attention scores embedding. Within segment 194, we subsequently identified the critical connections between nodes. We focused on nodes associated with the inferior frontal gyrus as target node indices. The result indicated that inferior frontal gyrus is more salient towards cuneus, superior temporal gyrus and posterior cingulate gyrus. These results aligned with existing studies on ADHD site-specific biomarkers [18, 19].
Conclusion
In summary, our novel framework combines the discriminative capabilities of GCN and GIN with Transformers to capture temporal dynamics in rs-fMRI data from ADHD subjects and controls. Furthermore, we generated key biomarkers for performance insights.Acknowledgements
This research is supported by AcRF Tier-2 grant MOE T2EP20121-0003 of Ministry of Education, Singapore.References
- Ahrends C, Vidaurre D. Dynamic Functional Connectivity. arXiv preprint arXiv:2301.03408. 2023 Jan 9.
- Jin C, Jia H, Lanka P, Rangaprakash D, Li L, Liu T, Hu X, Deshpande G. Dynamic brain connectivity is a better predictor of PTSD than static connectivity. Human brain mapping. 2017 Sep;38(9):4479-96.
- Chen X, Zhang H, Shen D. Ensemble hierarchical high-order functional connectivity networks for MCI classification. InMedical Image Computing and Computer-Assisted Intervention–MICCAI 2016: 19th International Conference, Athens, Greece, October 17-21, 2016, Proceedings, Part II 19 2016 (pp. 18-25). Springer International Publishing.
- Kan X, Gu AA, Cui H, Guo Y, Yang C. Dynamic Brain Transformer with Multi-level Attention for Functional Brain Network Analysis. arXiv preprint arXiv:2309.01941. 2023 Sep 5.
- Gadgil S, Zhao Q, Pfefferbaum A, Sullivan EV, Adeli E, Pohl KM. Spatio-temporal graph convolution for resting-state fmri analysis. InMedical Image Computing and Computer Assisted Intervention–MICCAI 2020: 23rd International Conference, Lima, Peru, October 4–8, 2020, Proceedings, Part VII 23 2020 (pp. 528-538). Springer International Publishing.
- Kim BH, Ye JC, Kim JJ. Learning dynamic graph representation of brain connectome with spatio-temporal attention. Advances in Neural Information Processing Systems. 2021 Dec 6;34:4314-27.
- Kan X, Dai W, Cui H, Zhang Z, Guo Y, Yang C. Brain network transformer. Advances in Neural Information Processing Systems. 2022 Dec 6;35:25586-99.
- Asadi N, Olson IR, Obradovic Z. A transformer model for learning spatiotemporal contextual representation in fMRI data. Network Neuroscience. 2023 Jan 1;7(1):22-47.
- ADHD-200 consortium. The ADHD-200 consortium: a model to advance the translational potential of neuroimaging in clinical neuroscience. Frontiers in systems neuroscience. 2012 Sep 5;6:62.
- Leonardi N, Van De Ville D. On spurious and real fluctuations of dynamic functional connectivity during rest. Neuroimage. 2015 Jan 1;104:430-6.
- Zhang H, Chen X, Zhang Y, Shen D. Test-retest reliability of “high-order” functional connectivity in young healthy adults. Frontiers in neuroscience. 2017 Aug 2;11:439.
- Power JD, Cohen AL, Nelson SM, Wig GS, Barnes KA, Church JA, Vogel AC, Laumann TO, Miezin FM, Schlaggar BL, Petersen SE. Functional network organization of the human brain. Neuron. 2011 Nov 17;72(4):665-78.
- Kipf TN, Welling M. Semi-supervised classification with graph convolutional networks. arXiv preprint arXiv:1609.02907. 2016 Sep 9.
- Xu K, Hu W, Leskovec J, Jegelka S. How powerful are graph neural networks?. arXiv preprint arXiv:1810.00826. 2018 Oct 1.
- Devlin J, Chang MW, Lee K, Toutanova K. Bert: Pre-training of deep bidirectional transformers for language understanding. arXiv preprint arXiv:1810.04805. 2018 Oct 11.
- Manessi F, Rozza A, Manzo M. Dynamic graph convolutional networks. Pattern Recognition. 2020 Jan 1;97:107000.
- Sundararajan M, Taly A, Yan Q. Axiomatic attribution for deep networks. InInternational conference on machine learning 2017 Jul 17 (pp. 3319-3328). PMLR.
- Chan YH, Yew WC, Rajapakse JC. Semi-supervised Learning with Data Harmonisation for Biomarker Discovery from Resting State fMRI. InInternational Conference on Medical Image Computing and Computer-Assisted Intervention 2022 Sep 15 (pp. 441-451). Cham: Springer Nature Switzerland.
- Tremblay LK, Hammill C, Ameis SH, Bhaijiwala M, Mabbott DJ, Anagnostou E, Lerch JP, Schachar RJ. Tracking inhibitory control in youth with ADHD: a multi-modal neuroimaging approach. Frontiers in Psychiatry. 2020 Nov 19;11:00831.
Figures