1951
Longitudinal oncology lesion tracking using self-supervised vision transformers.1GE HealthCare, Bengaluru, India
Synopsis
Keywords: Diagnosis/Prediction, Machine Learning/Artificial Intelligence, Foundation Model, Lesion Tracking, Longitudinal data
Motivation: Automate lesion(s) delineation across longitudinal time-points to improve throughput and accuracy, reduce fatigue and determine disease velocity
Goal(s): A method where user identifies an imaging lesion and wants to automatically label phenotypically similar imaging lesion on other scans .
Approach: Vision Foundation model (DINO V2) features to localize and segment similar region between template mask region and new test data to obtain segmentation of similar lesion(s).
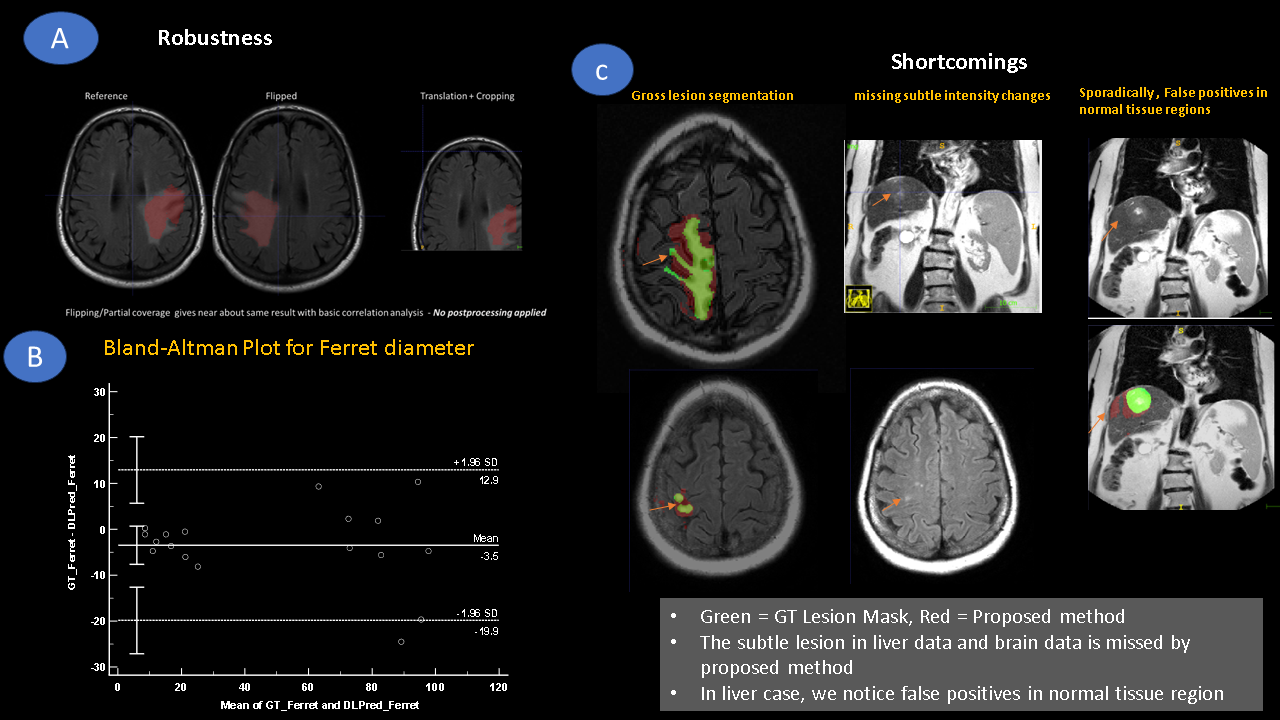
Results: Reasonably well lesion segmentation capabilities on serial MRI scans in oncology patients with various MRI protocols, orientations and contrast. For Ferret diameter metric, a mean difference (95% CI) = -3.5 mm (-7.6 to 0.7 mm).
Impact: Ability to automatically delineate phenotypically similar lesions on serial imaging data with user interaction on first time point only. Methodology is generalizable irrespective of imaging orientation, contrast and without need for extensive data labelling or geometric synchronization on serial scans.
Introduction
In oncology practice, serial follow up with imaging is common for screening and evaluating therapy response. A clinician might repeatedly delineate lesions with specific imaging phenotype at each time point to determine disease velocity. A methodology which allows a clinician to mark a sample imaging lesion in a single slice at initial time point and labels phenotypically similar lesions through the volume and across serial imaging time-points would improve clinical throughput, reduce fatigue, and potentially ensure control over precision of relevant lesion segmentation. We describe an unsupervised deep learning-based methodology for automated lesion segmentation on serial imaging scans with minimal user interaction on a reference scan. The developed methodology is demonstrated on a wide pool multi-contrast MR imaging data across orientations, multiple subjects and pathology, with following advantages: Clinician is in control of lesion phenotype to be tracked and it doesn’t assume or require geometric synchronization across serial scans.Methods:
Workflow: The proposed method (Figure 1) is based on using features from unsupervised vision transformer (ViT) model [1] to localize ROI and chaining localized points to Segment Anything model (SAM) for refined segmentation [2]. ViT architecture allows patch level features to be extracted and interpolated to obtain pixel level features (See Figure 2A).DINO V2 FM Training: A total of 12700 three-plane localizers across different anatomy, resolution and protocols (SSFSE , fGRE) generated on 1.5T and 3T GE scanners were sequestered from internal volunteer database for training DINO V2 FM with MRI data. All studies were approved by relevant IRBs.
Study Data: Data for our study came from four different cancer patients with their multiple time-point MRI imaging data and with clinical imaging notes and radiology reports.
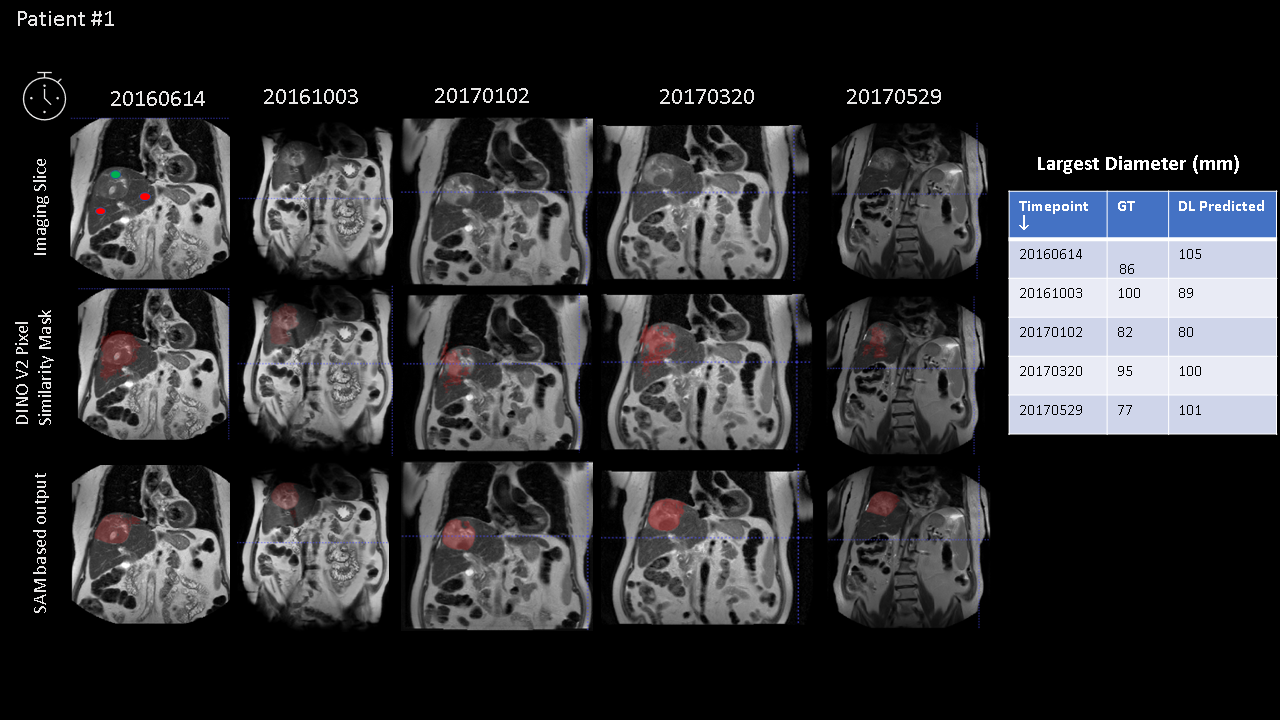
Patient #1: Liver Cancer Patient. Five time points. Coronal fast-spin echo or single shot fast spin echo images
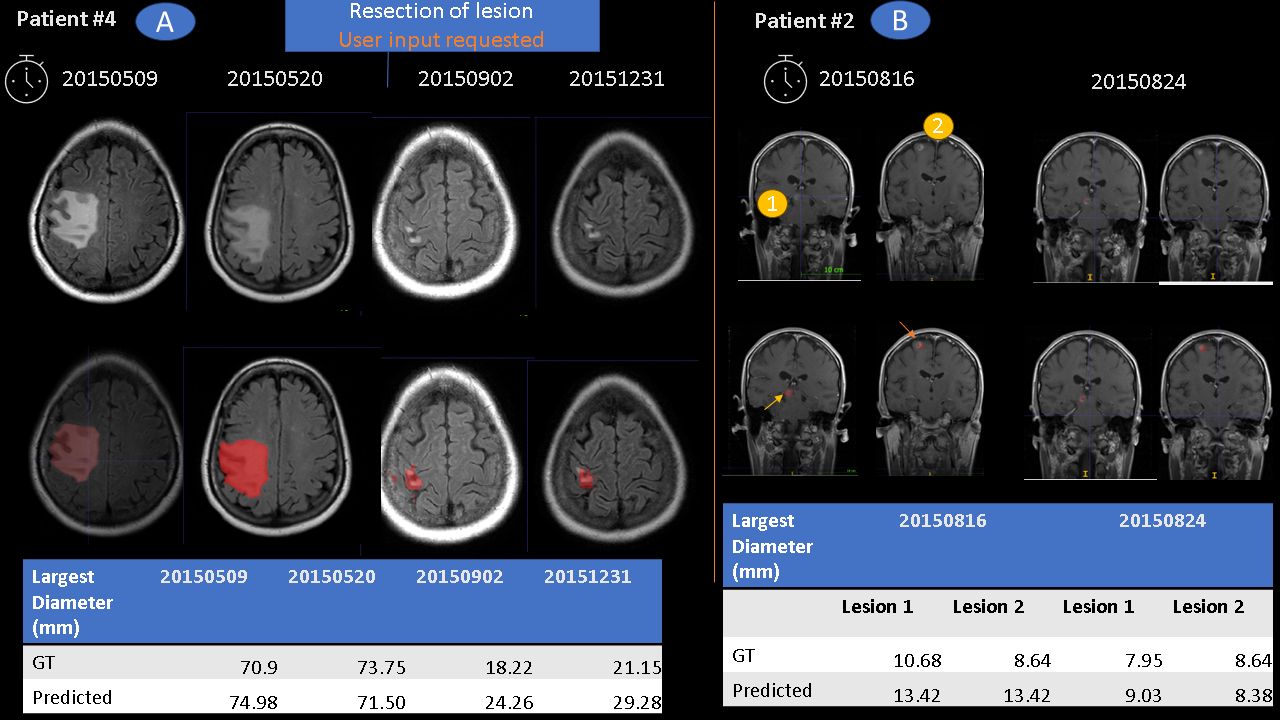
Patient #2: Lung Cancer patient. Two Time points. Coronal SE-T1w post-contrast data in brain for metastatic workup.
Patient #3: Lung Cancer patient. Secondary malignant neoplasm of brain. Two Time points. Axial T2 FLAIR images
Patient #4: Lung Cancer Patient. Four time points. Malignancy and metastasis. Underwent resection of metastatic lesion in brain after two time points.
Ground-truth (GT) marking: Marked by a trained radiologist on all lesions and used to compare lesion segmentation performance in terms of Ferret diameter.
Results and Discussion:
Figure 3 demonstrates reasonably well lesion segmentation capabilities of proposed approach on serial liver scans, using first timepoint template marking by user; despite change in position of lesion across respiratory cycle and different imaging protocols (T2w-TSE vs SSFSE). This is most likely due to the strong spatial localization capabilities of DINO V2 ViT model. Similar observation are seen in Figure 4A, Patient #4, where lesion was successfully delineated before surgical resection, while after resection of tumor, it did not segment small tumor fragments. We provided additional prompt at this time point, and it could then successfully delineate lesion for remining two points after resection (Figure 4A). For Patient #2 (Figure 4B), there were two different lesion locations and we had to give both lesion location as prompts for successful tracking. Figure 5A demonstrates robustness of approach to image flip or cropped images or partial coverage which suggests resilience to image geometry changes. We notice that in most cases, predicted lesion largest diameters are like ground-truth marking. Bland-Altman analysis indicates a mean error of -3.5 mm (limits = 13 mm to -20 mm) in predicting lesion Ferret diameter. Limitations of our study (Figure 5C): a. lesion mask is a gross approximation of GT lesion mask , b. subtle lesions at periphery can be missed , c. Change in image lesion characteristics might need a new user prompt (Fig 4A) and d. Each lesion must be tracked independently (Fig 4B). False positives in normal tissue regions can inflate can predicted lesion diameter (See Fig 3).Many of these issues are due to fixed threshold (= 0.6) used for fViT feature correlation and can be addressed with ML/DL based data adaptive thresholding and is being actively pursued.
Conclusion
We have introduced an unsupervised DL methodology for longitudinal lesion tracking without need for large volumes of annotated training data (supervised learning) .This can be easily adapted to any lesion type or heterogeneity since radiologist marks lesion only once; thereby leveraging contextual radiological knowledge and incorporating and element of trust in workflow design and thus enables significant speed-up of oncology longitudinal imaging analysis workflow.Acknowledgements
No acknowledgement found.References
1. 1. Oquab, M., Darcet, T., Moutakanni, T., Vo, H., Szafraniec, M., Khalidov, V., Fernandez, P., Haziza, D., Massa, F., El-Nouby, A. and Assran, M., 2023. Dinov2: Learning robust visual features without supervision. arXiv preprint arXiv:2304.07193.
2. Kirillov, A., Mintun, E., Ravi, N., Mao, H., Rolland, C., Gustafson, L., Xiao, T., Whitehead, S., Berg, A. C., Lo, W-Y., Dollár, P., & Girshick, R. (2023). Segment Anything. arXiv preprint arXiv:2304.026431
Figures
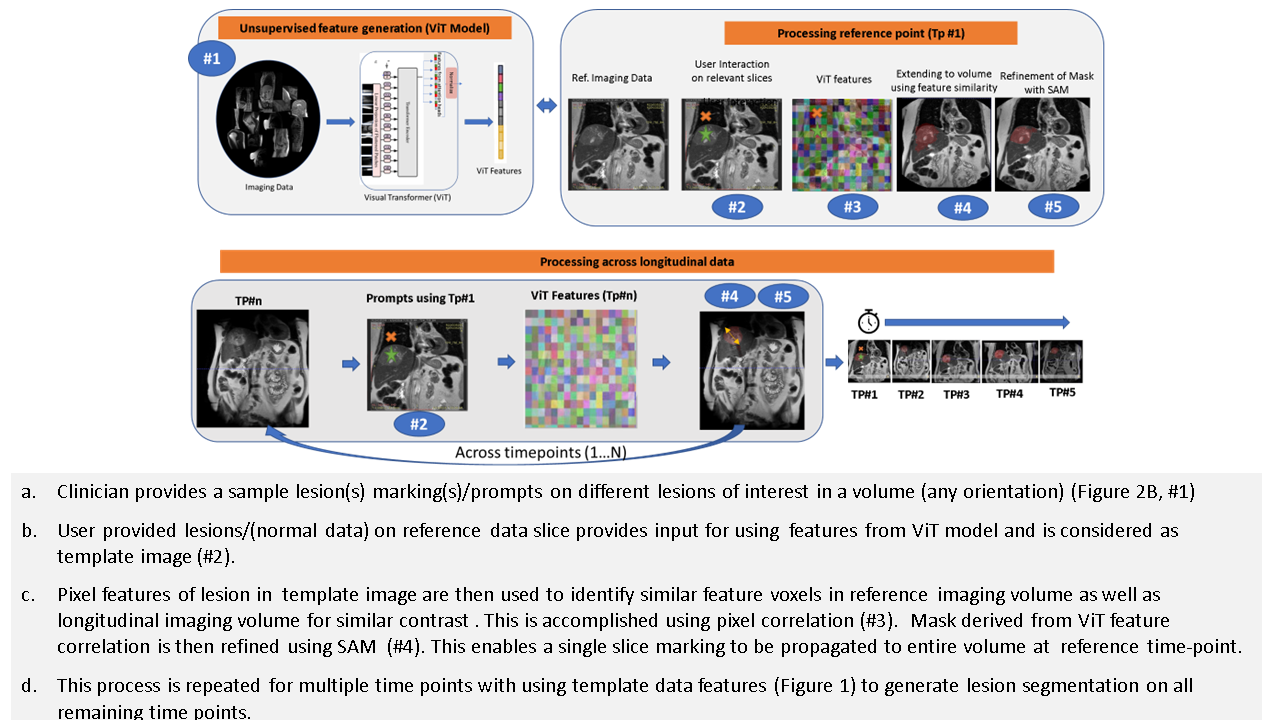
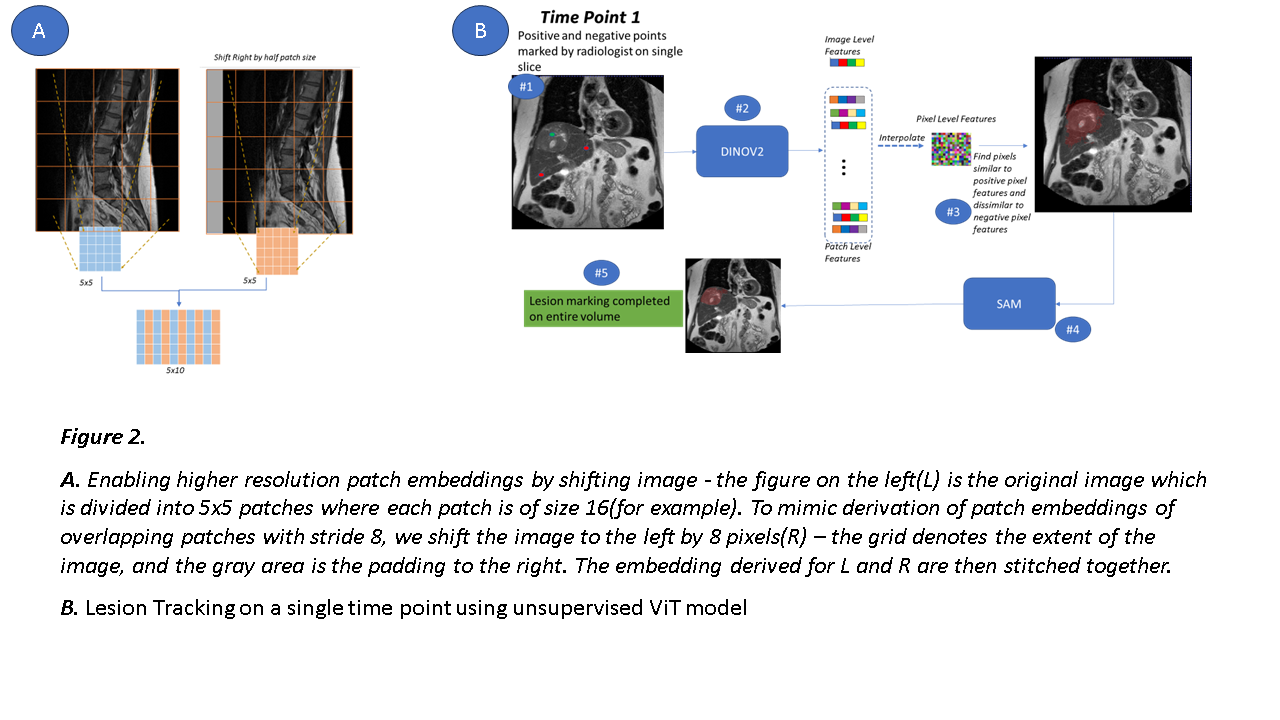
Figure 2. A. Enabling higher resolution patch embeddings by shifting image - figure on the left(L) is original image which is divided into 5x5 patches where each patch is of size 16(for example). To mimic derivation of patch embeddings of overlapping patches with stride 8, we shift image to the left by 8 pixels(R) – the grid denotes extent of the image, and gray area is the padding to the right. Embedding derived for L and R are then stitched together.
B. Lesion Tracking on a single time point using unsupervised ViT model