1945
Performance of T2 mapping in the staging of Graves’ ophthalmopathy based on different region of interest selection methods1Fujian Provincial Hospital, Fuzhou, China, 2MR Research Collaboration Team, Siemens Healthineers Ltd., Shanghai, China
Synopsis
Keywords: Head & Neck/ENT, Head & Neck/ENT, Graves’ ophthalmopathy; T2 mapping
Motivation: T2 relaxation time (T2RT) of extraocular muscle (EOM) derived from T2 mapping has been reported to be useful for staging patients with Graves’ ophthalmopathy (GO). However, due to the particularity of orbital anatomy, various region of interest (ROI) selection methods have been used in the process of T2RT measurements in GO.
Goal(s): This study aimed to evaluate the performance of T2 mapping based on different ROIs for staging GO.
Approach: T2RT-mean and T2RT-max values of EOM on coronal T2 mapping were measured and analyzed.
Results: Taking reproducibility and diagnostic performance into consideration, T2RT-mean was found to be an ideal biomarker for staging GO.
Impact: Taking reproducibility and diagnostic performance into consideration, T2RT-mean of EOM derived from T2 mapping was found to be an ideal biomarker for staging GO compared to T2RT-max.
The natural history of Graves’ ophthalmopathy (GO) can be divided into two distinct phases: the active inflammatory phase and the inactive fibrotic phase [1]. Accurately discriminating between the two phases is of great importance in clinical practice, as different treatment strategies are required for patients with active and inactive GO [2]. To date, the Clinical Activity Score (CAS) system is commonly used to assess the activity of GO; however, it has some limitations.
In recent years, T2 relaxation time (T2RT) of extraocular muscles (EOMs) derived from T2 mapping has been reported to be useful for the staging of GO [3-5]. However, due to the particularity of orbital anatomy, various region of interest (ROI) selection methods have been used in the process of T2RT measurements for GO staging in previous studies. To date, limited research has been conducted to investigate the effect of selecting different ROIs on T2RT measurement for GO staging.
The aim of this study was to evaluate the performance of T2 mapping based on different ROIs for staging GO patients.
Method
Patients
From February 2021 to March 2023, a total of 56 consecutive patients (mean age 44.4±13.4 years; male/female ratio 20/36) were enrolled. All patients were clinically diagnosed with GO based on Bartley's criteria. Disease activity was determined for each orbit according to the modified seven-point CAS. A CAS score of ≥3 was defined as active GO, while a score of <3 was defined as inactive.
MR Protocol
MRI scans were conducted on a 3.0 T MRI system (MAGNETOM Prisma, Siemens Healthcare, Erlangen, Germany) using a 20-channel head coil. The imaging parameters for the coronal T2 mapping were as follows: echo train length, 5; TE, 13.8–69ms (ΔTE = 13.8 ms); TR, 1440 ms; matrix, 240 × 320; FOV, 180 × 180mm; bandwidth, 230Hz/Px; slice thickness, 3 mm; slice gap, 0.6 mm; total slices, 16.
Image Analysis
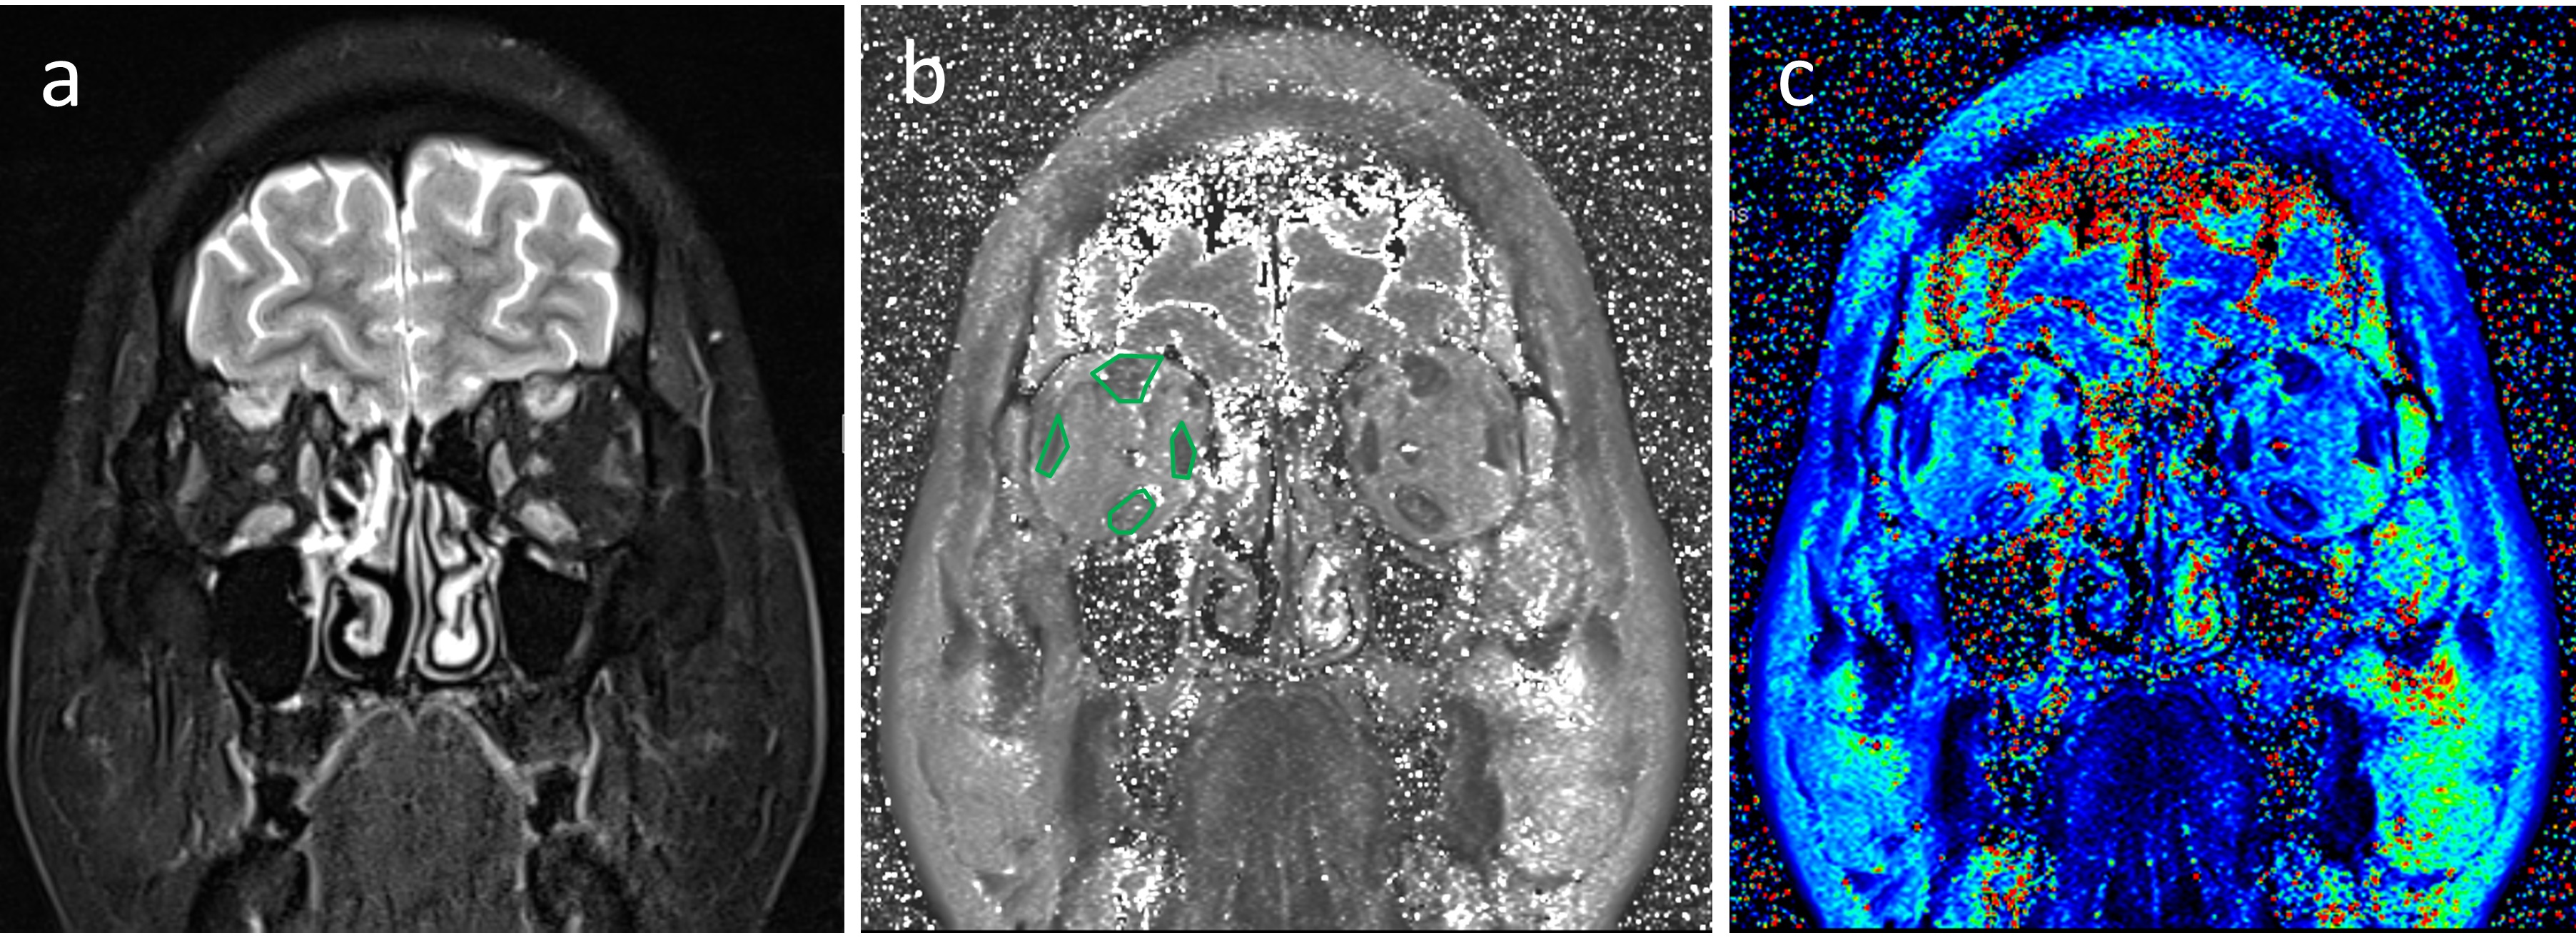
The T2RT measurements were conducted as follows: four EOMs including superior, inferior, medial, and lateral recti - were manually delineated on the largest coronal section of the coronal T2WI with fat suppression (Fig 1). The mean T2RT (T2RT-mean) was calculated using the following formula: T2RT-mean=(T2RTROI-s*AreaROI-s+T2RTROI-i*AreaROI-i+T2RTROI-m*AreaROI-m+T2RTROI-l*AreaROI-l)/(AreaROI-s+AreaROI-i+AreaROI-m+AreaROI-l). The maximum T2RT value (T2RT-max) was then selected from the four EOMs. Two radiologists independently drew the ROIs and the inter-observer agreement was assessed using the measurement results of the two observers.
Statistical Analysis
The Shapiro-Wilk test was used to analyze the normality of the data. An independent sample t test was applied to compare the T2RT-mean and T2RT-max values between two groups. Spearman correlation analysis was used to examine the correlations between CAS and T2RT values. Receiver operating characteristic (ROC) curves were employed to determine the performances of T2RT values in distinguishing active from inactive GO. The optimal cutoff values were estimated according to the Youden index. The sensitivity and specificity were calculated for each parameter based on the optimum cutoff values. Comparisons of multiple ROC curves according to DeLong et al. [6] were used to compare the diagnostic performances between T2RT-mean and T2RT-max. The inter-observer reproducibility of T2RT values measurements was assessed with the intraclass correlation coefficient (ICC) with 95% confidence interval. The ICC was interpreted as follows: <0.40, poor; 0.40-0.75, moderate; 0.76-0.90, good; ≥0.91, excellent.
Results
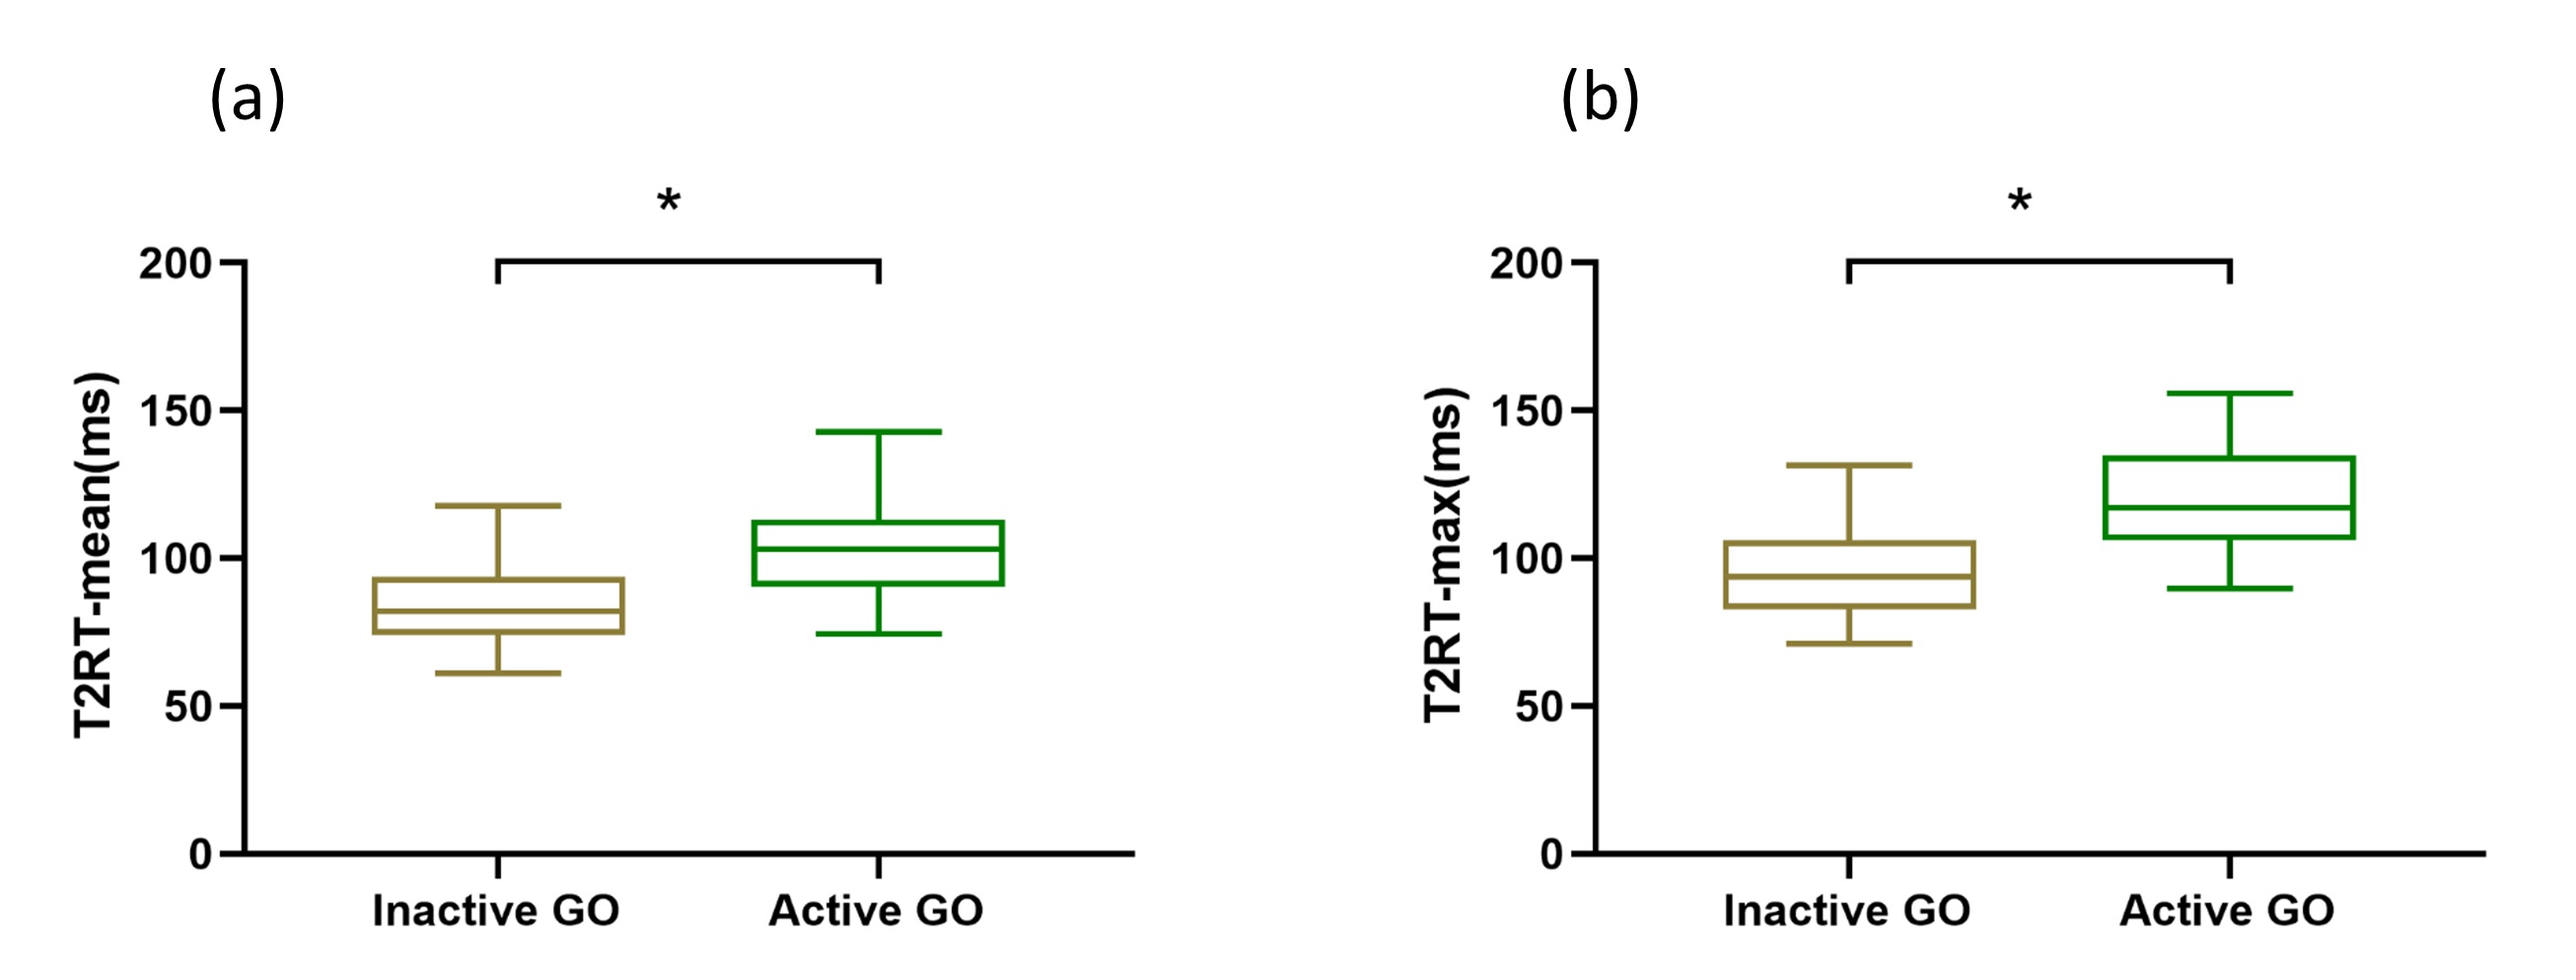
The T2RT-mean and T2RT-max values in the active GO were significantly higher than those of the inactive GO (P < 0.001). Detailed comparisons between active and inactive GO are presented in Figure 2.
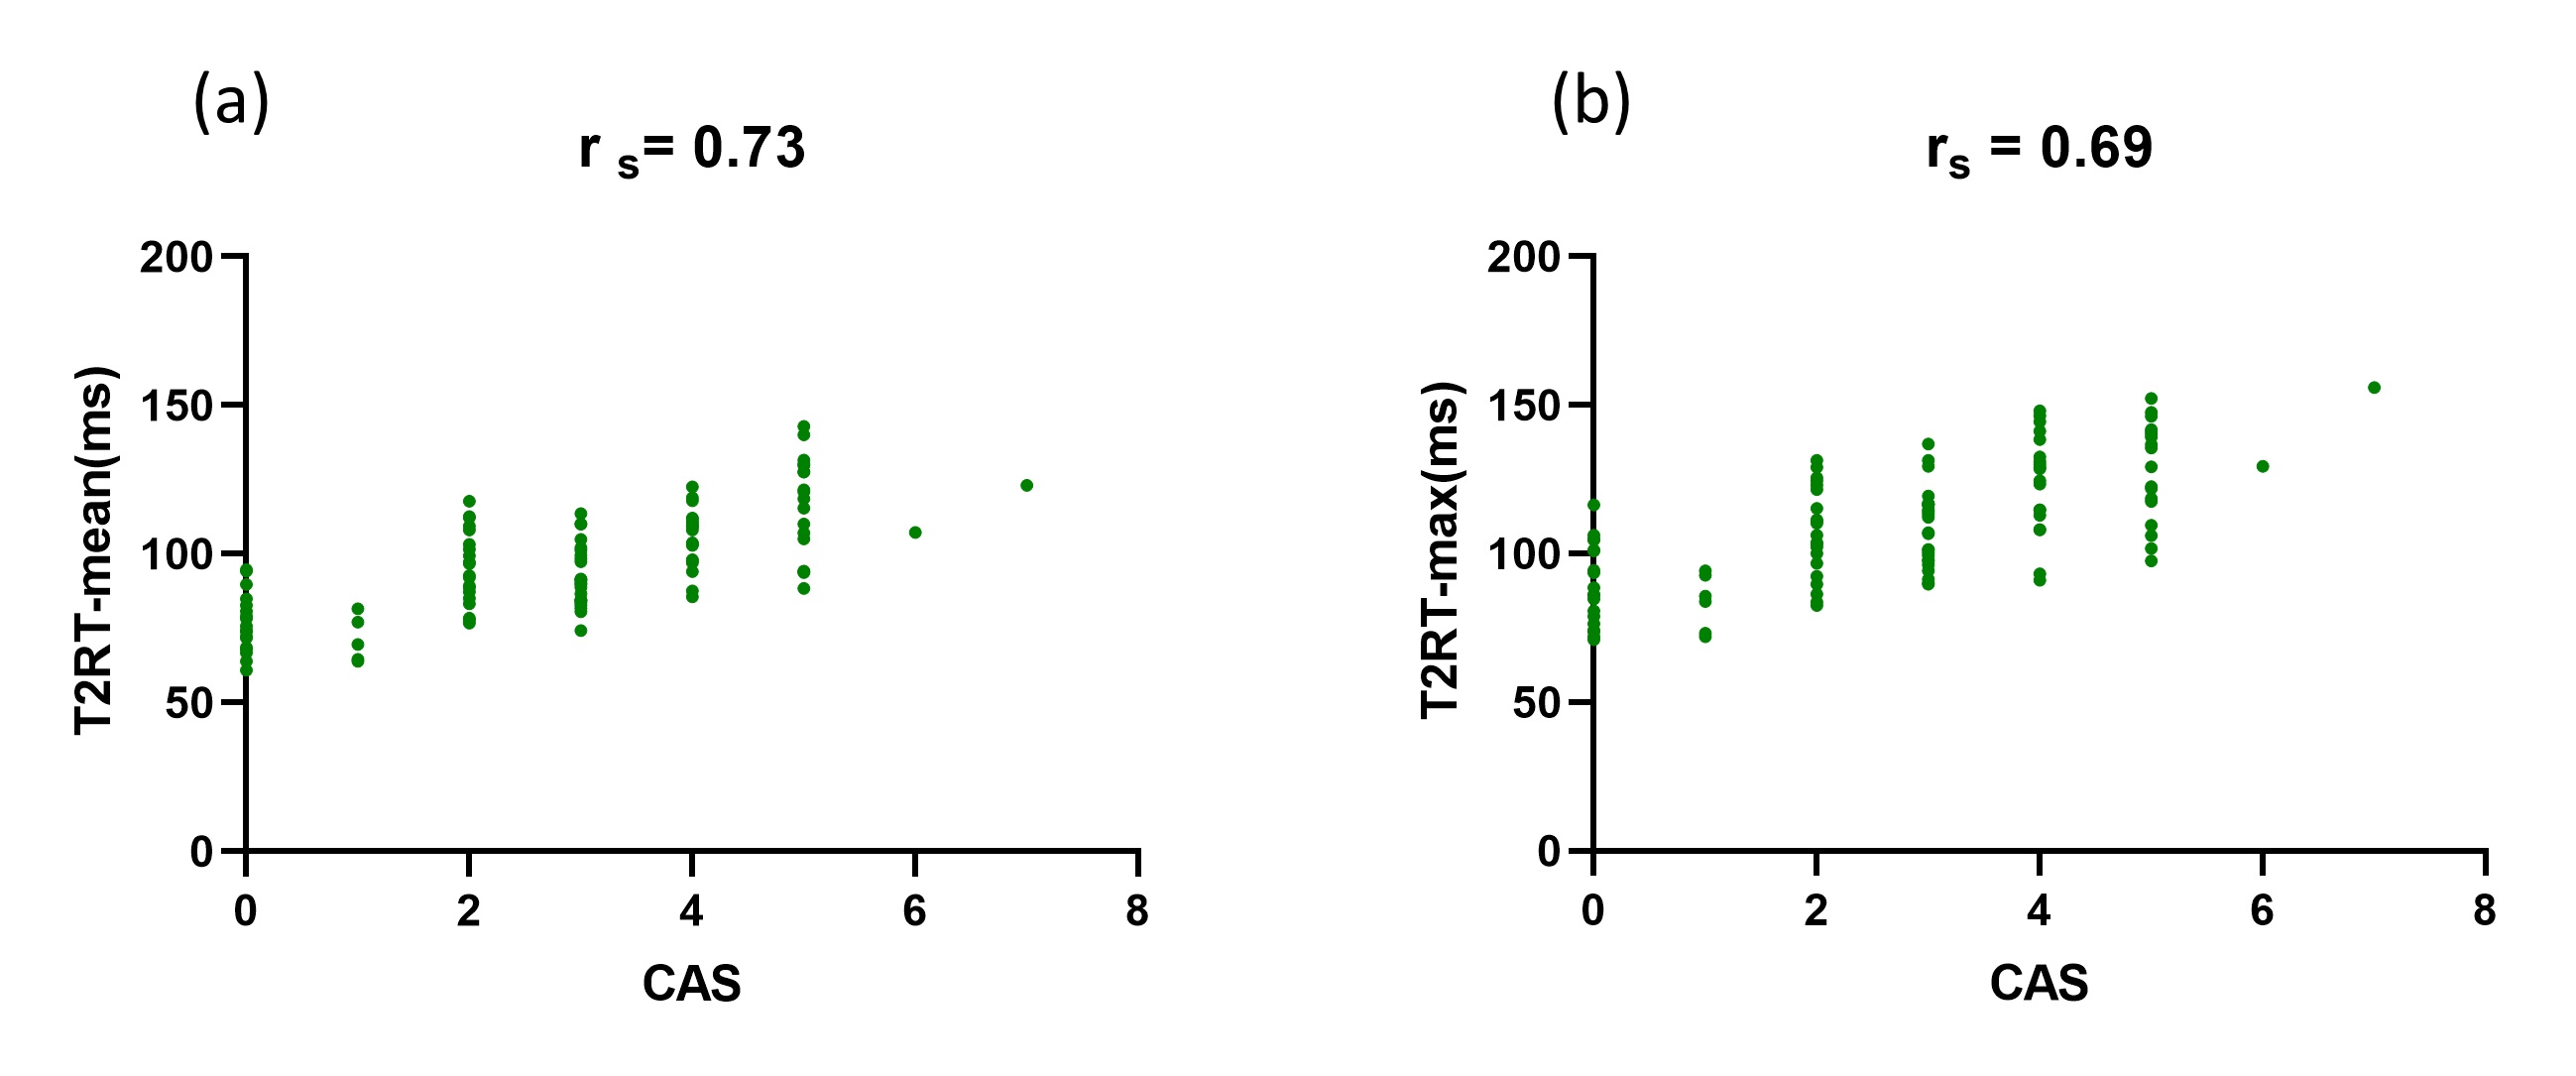
The T2RT-mean and T2RT-max values were positively correlated with CAS (rs = 0.73, 0.69; P < 0.001), as demonstrated in Figure 3.
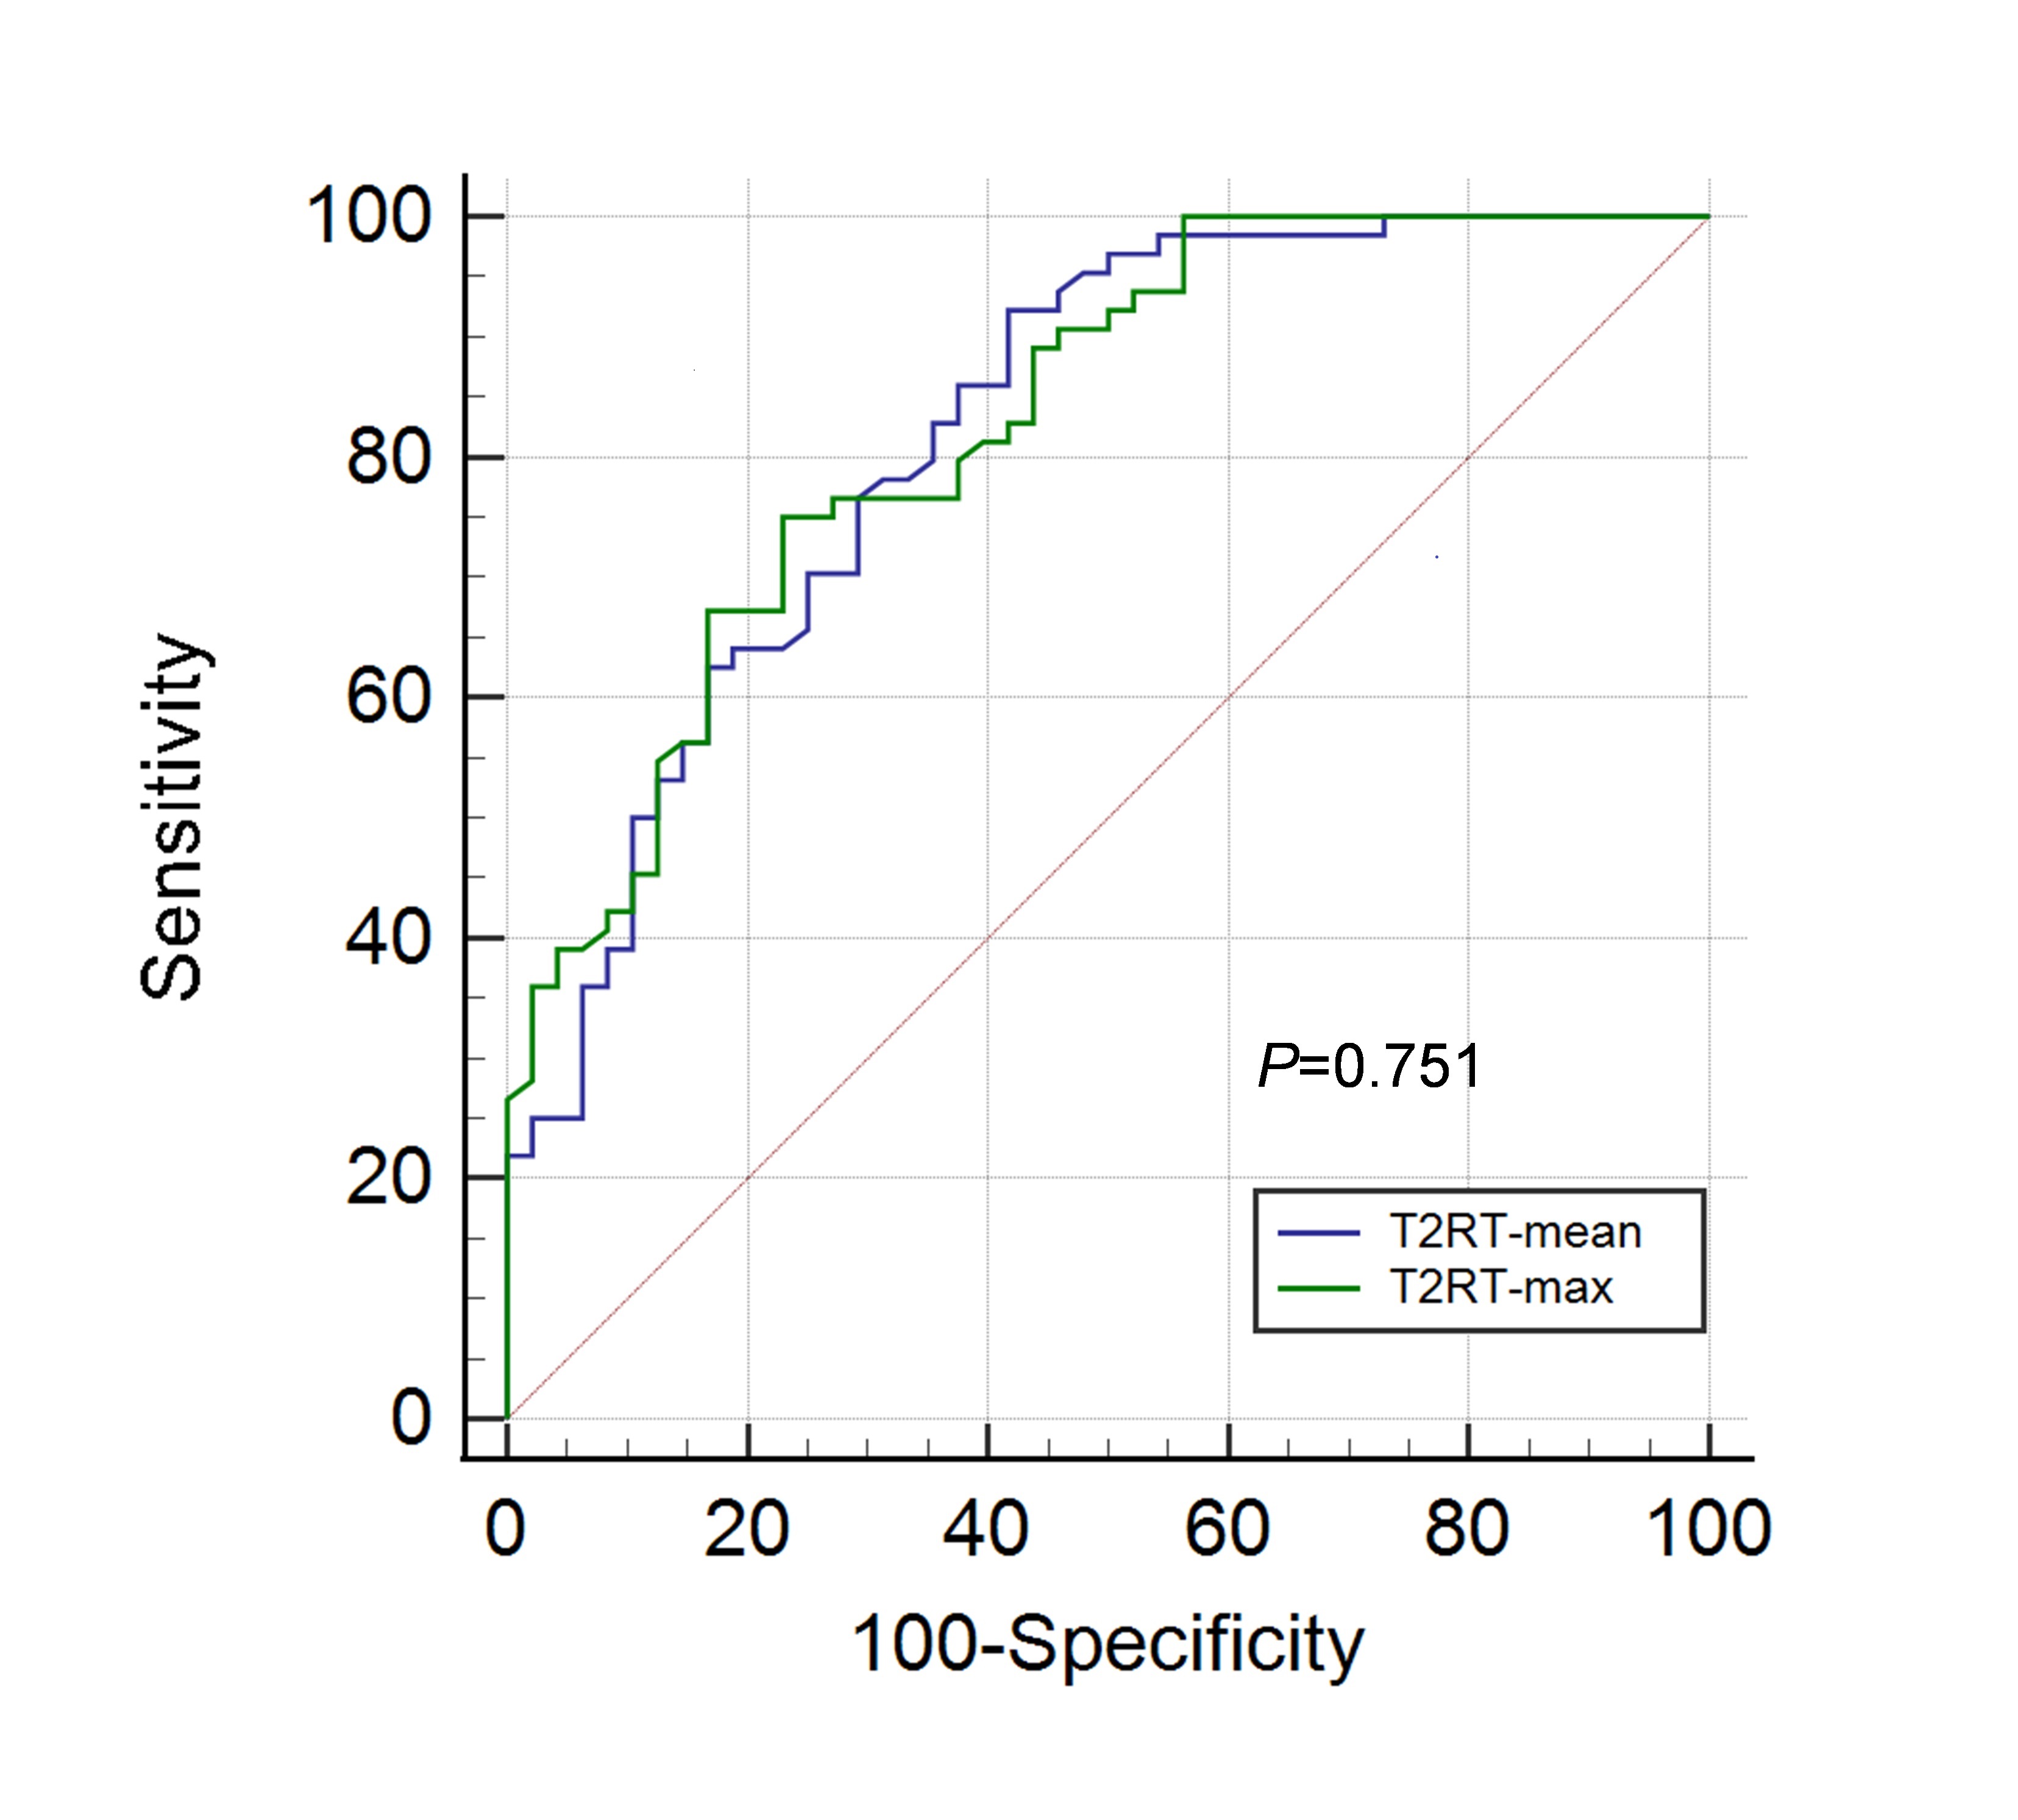
The T2RT-mean and T2RT-max values of the EOM were used as threshold values for staging GO, respectively. The best results were obtained with an area under the curve (AUC) of 0.822 and 0.827, respectively, and a sensitivity of 92.2% and 67.2%, and a specificity of 58.3% and 83.3%. There was no significant difference in AUC between T2RT-mean and T2RT-max (P=0.751) (Fig 4).
Excellent and good inter-observer agreements were achieved in quantitative measurements for T2RT-mean and T2RT-max values, respectively, with ICCs of 0.954 and 0.882.
Discussion & Conclusions
In conclusion, our study results showed that the T2RT-mean and T2RT-max values of EOMs were effective in assessing disease activity. When considering both diagnostic performance and reproducibility, T2RT-mean was found to be an ideal biomarker for staging GO.
Acknowledgements
The authors of this manuscript declare that they have no relationships with any companies whose products or services may be related to the subject matter. No complex statistical methods were necessary for this paper. It was approved by the institutional review board and written informed consent was waived due to its retrospective nature. No study subjects or cohorts have been previously reported.References
[1] Chen L, Chen W, Chen HH, et al. Radiological Staging of Thyroid-Associated Ophthalmopathy: Comparison of T1 Mapping with Conventional MRI. Int J
[2] Hu H, Xu XQ, Wu FY, et al. Diagnosis and stage of Graves' ophthalmopathy: Efficacy of quantitative measurements of the lacrimal gland based on 3-T magnetic resonance imaging. Exp Ther Med 2016;12:725-729.
[3] Chen W, Hu H, Chen HH, et al. Utility of T2 mapping in the staging of thyroid-associated ophthalmopathy: efficiency of region of interest selection methods. Acta Radiol 2020;61:1512-1519.
[4] Das T, Roos JCP, Patterson AJ, et al. T2-relaxation mapping and fat fraction assessment to objectively quantify clinical activity in thyroid eye disease: an initial feasibility study. Eye (Lond) 2019;33:235-243.
[5] Hou K, Ai T, Hu WK, et al. Three dimensional orbital magnetic resonance T2-mapping in the evaluation of patients with Graves' ophthalmopathy. J Huazhong Univ Sci Technolog Med Sci 2017;37:938-942.
[6] DeLong ER, DeLong DM, Clarke-Pearson DL. Comparing the areas under two or more correlated receiver operating characteristic curves: a nonparametric approach. Biometrics 1988;44:837-845.
Figures