1944
Within-session test-retest reproducibility and reliability of auditory cortex GABA+ in individuals with tinnitus using MEGA-sLASER at 3T1Department of Psychiatry, Columbia University Irving Medical Center, New York, NY, United States, 2New York State Psychiatric Institute, New York, NY, United States, 3Department of Experimental Medicine, Lund University, Lund, Sweden, 4Synex Medical, Boston, MA, United States, 5Department of Biomedical Engineering, Columbia University, New York, NY, United States
Synopsis
Keywords: Head & Neck/ENT, Spectroscopy, Precision and accuracy, brain, tinnitus
Motivation: The measurement of GABA+ using in vivo proton magnetic resonance spectroscopy requires adequate reproducibility and reliability for its use in clinical research and as a potential biomarker.
Goal(s): We aimed to determine the within-session test-retest reproducibility and reliability of GABA+ in the auditory cortex of individuals with tinnitus.
Approach: A MEGA-sLASER sequence for GABA+ measurement using two consecutive within-session blocks was performed on 38 participants over 2 scanning days.
Results: GABA+ quantification in the auditory cortex demonstrated similar reproducibility and reliability when using either a total creatine (tCr) or water reference (GABA+/tCr: CV=5.6%, ICC=0.69, 95% CI [0.52-0.80]; GABA+/water: CV=5.6%; ICC=0.73, 95% CI [0.58-0.83]).
Impact: Auditory cortex GABA+ quantification with MEGA-sLASER in a clinical population with GABA+ abnormalities in the region of interest can be achieved with reproducibility and reliability that is comparable to what has been reported in other brain regions of healthy controls.
Introduction
The measurement of GABA using in vivo proton magnetic resonance spectroscopy (1H-MRS) requires adequate reproducibility (determined by the coefficient of variation, CV) and reliability (expressed as the intraclass correlation coefficient, ICC) for its use in clinical research and as a potential biomarker. Previous within-session studies have found acceptable reproducibility with CV<10%1-4 and moderate (ICC=0.5-0.75) to good (ICC=0.75-0.9) reliability1,3,5 but have often focused on healthy participants. The replication of this research in a clinical population, where there may be pathological findings, is important for the dissemination of 1H-MRS in clinical use. In this secondary analysis, we used a MEGA-sLASER sequence6 for the measurement of GABA+ (GABA with macromolecules) in participants with tinnitus, a condition where metabolite irregularities in the auditory cortex have been reported7,8.Methods
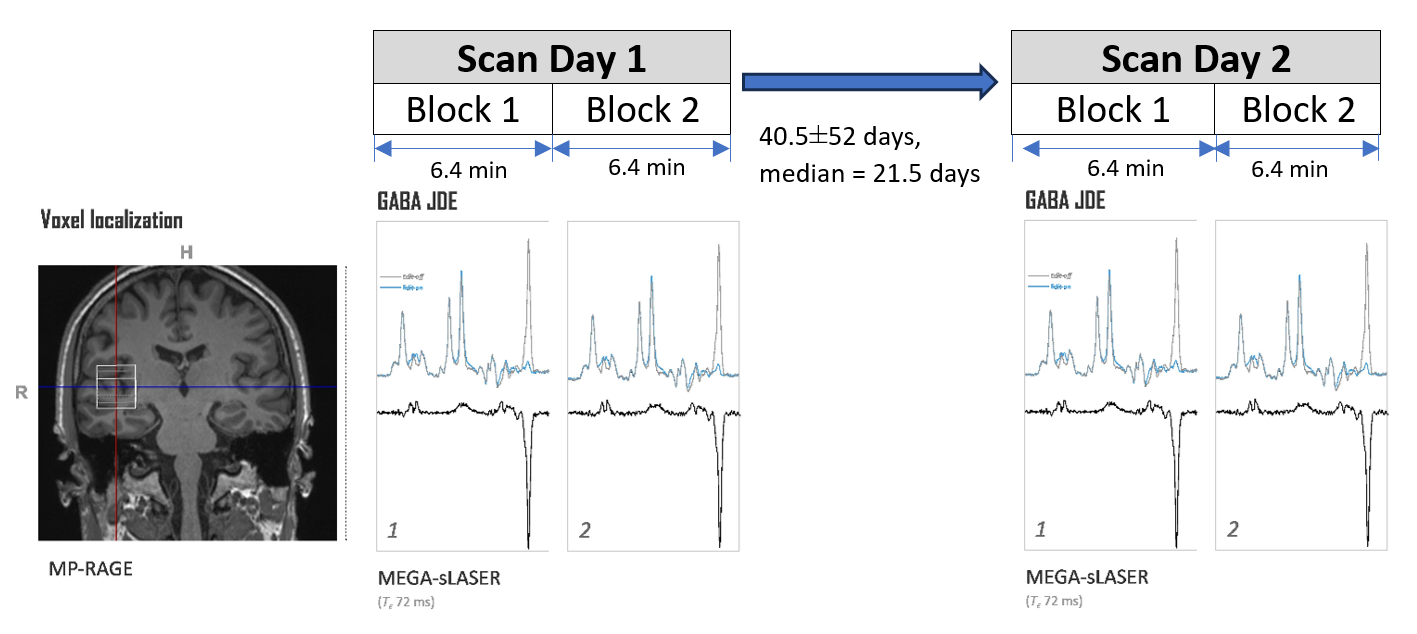
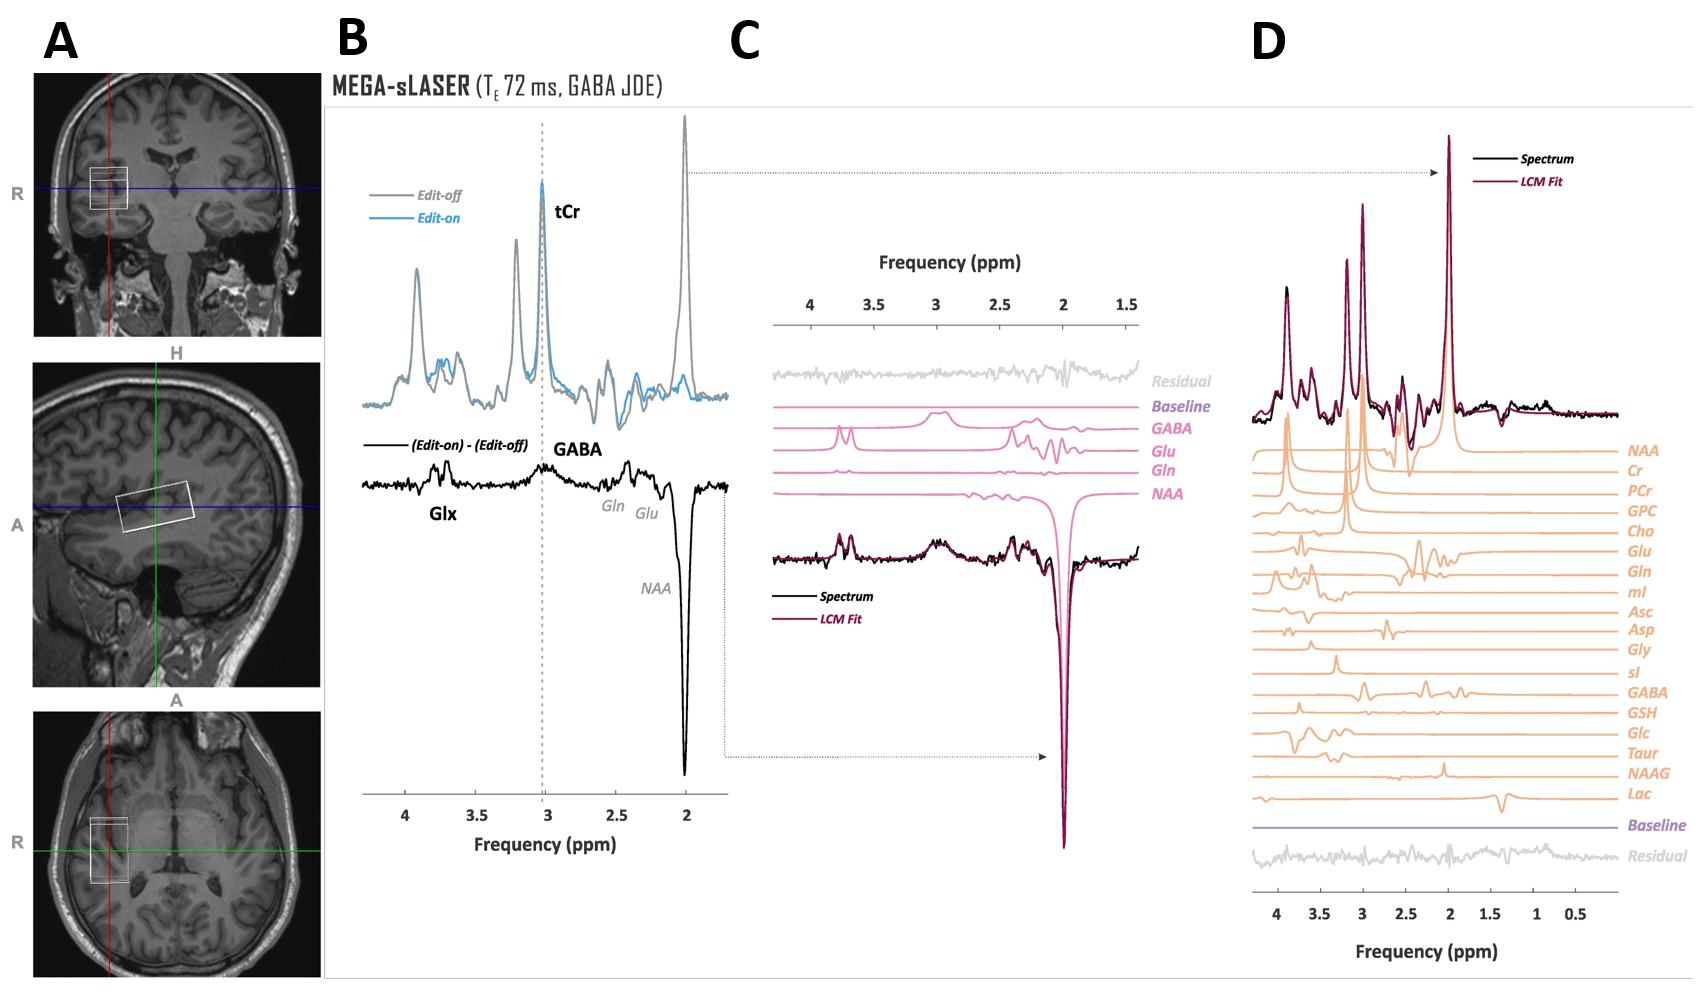
Scans were performed using a Siemens 3T MAGNETOM Prisma scanner with the vendor’s 32-channel head receive coil (Siemens Healthineers, Erlangen, Germany) on 38 participants (21/17 m/f, age 42±12years) enrolled in a clinical trial for the treatment of tinnitus (Clinicaltrials.gov ID NCT03336398). Two baseline GABA+ acquisitions (blocks 1 and 2, 6.4min each) beginning approximately 15min into the scanning session were performed on each of two scan days (Fig. 1).Data were acquired from a 25x40x20-mm3 voxel (Fig. 2A) aligned with the Sylvian fissure in the transverse plane and adjusted to capture the entirety of the primary auditory cortex. GABA+ was measured with sLASER acquisitions J-difference-edited (JDE) for GABA+ detection (TE=72ms, TR=2s, NR=192 per block). Sequence crushers (maximum 24mT/m, duration 1.3ms) and 16-step cogwheel phase cycling schemes9 were optimized by DOTCOPS10,11; water suppression was achieved by 7-pulse VAPOR12.
Metabolite spectra were processed in INSPECTOR13 with individual traces eddy-current corrected, and phase- and frequency-aligned. Corresponding averaged edit-on and edit-off spectra were aligned and subtracted to yield averaged difference spectra with isolated GABA+ and co-edited Glx with NAA. GABA+ JDE difference spectra and corresponding edit-off spectra were quantified in LCModel (v. 6.3, S. Provencher)14 (Fig. 2B-2D). Basis sets were density-matrix simulated at 2048 complex points in MARSS15 using published chemical shifts and J-coupling constants16 with realistic pulse shapes defined over a 1283-point cubic spatial grid.
Concentrations were referenced to an assumed 10mM total creatine (tCr) per voxel as well as internal water. For this within-subject analysis, water molarity was estimated at 42800mM per voxel according to published occipital cortex tissue water fractions in healthy adults17,18, with assumed tissue partial volumes at 40% grey matter, 40% white matter, and 20% cerebral spinal fluid. T2 for GABA, creatine, and water were set to 75, 144, and 107ms, respectively19,20.
CV, ICC, and Pearson’s r values were calculated in SPSS v.29.0. Data were inspected for outliers and skewness using Bland-Altman plots.
Results
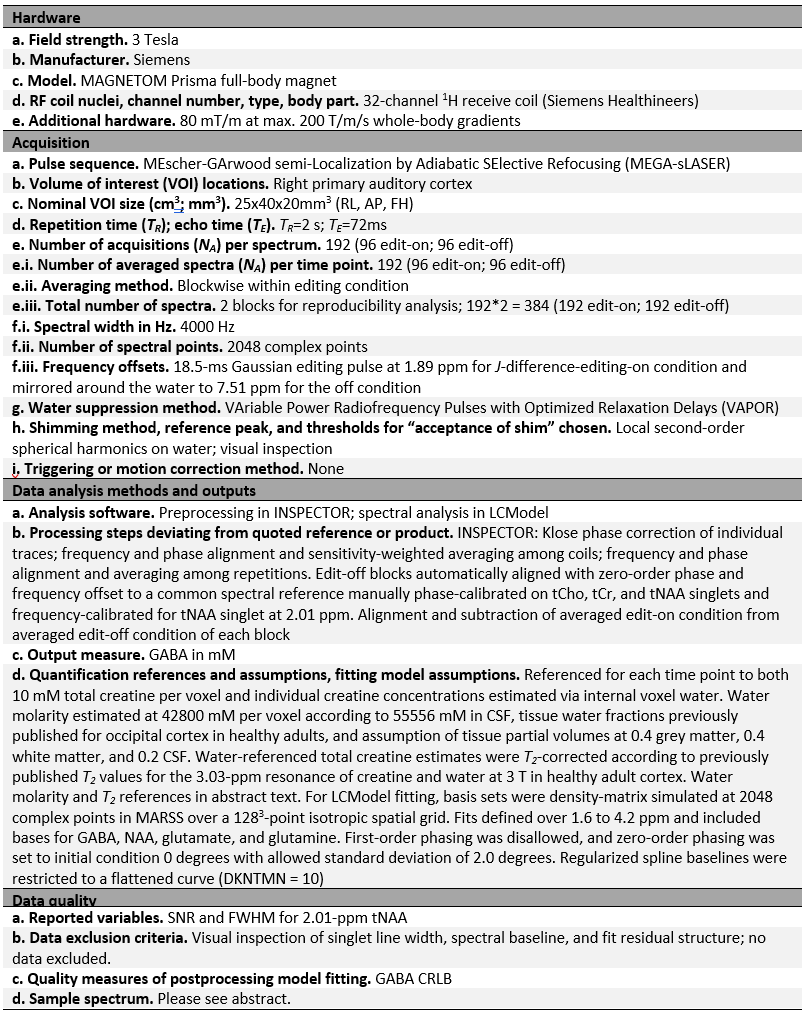
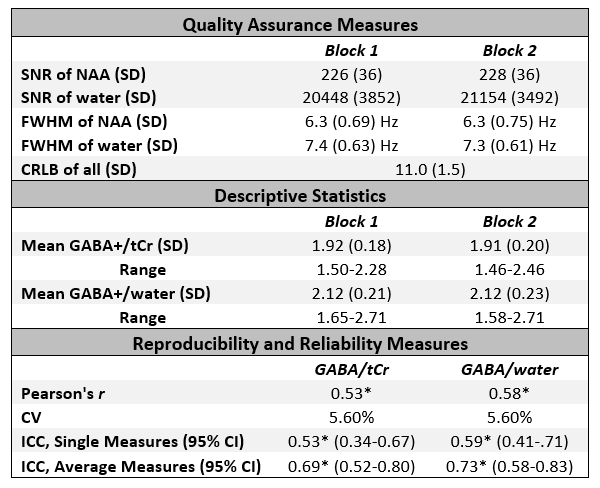
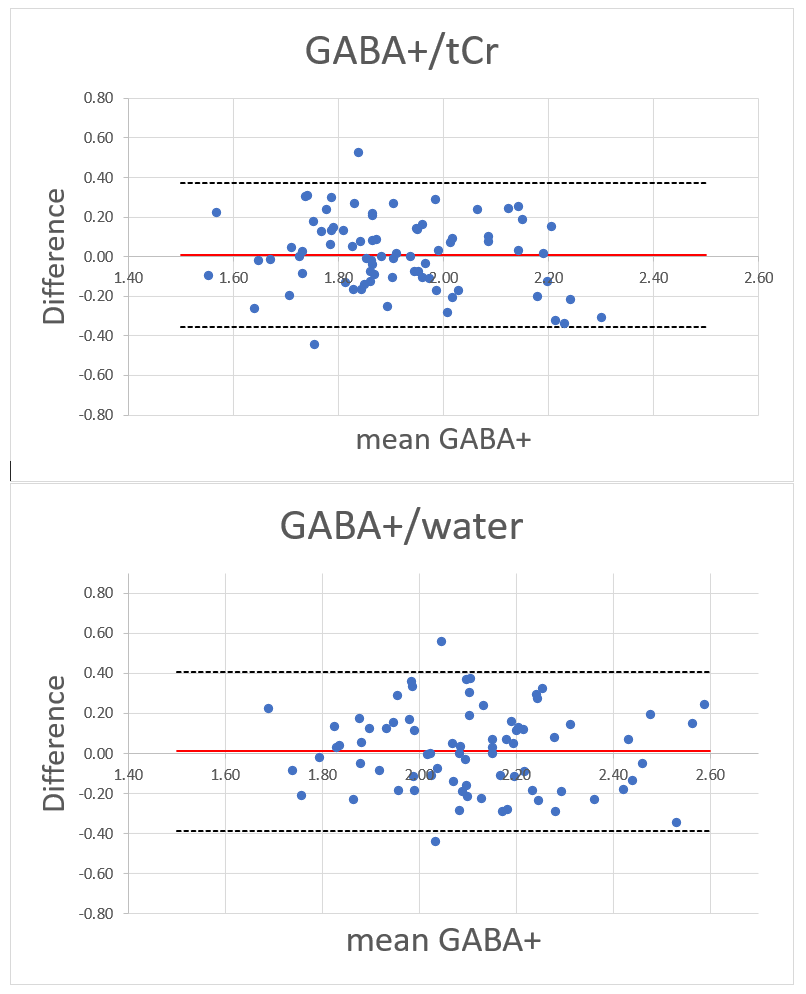
Scan parameters according to minimum reporting standards guidelines21 are shown in Fig. 3. JDE GABA+ edit-off spectra (76 averaged spectra each for blocks 1 and 2) had no difference in SNR (t(75)=-0.604, p=0.547) or FWHM (t(75)=-0.083, p=0.93) of the 2.01-ppm NAA singlet. No data sets acquired were discarded due to visually poor spectral quality or quantifiability. GABA Cramér-Rao Lower Bounds were <20% (mean=11.0±1.5, range 8-17).Auditory cortex GABA+ quantification demonstrated similar reproducibility and reliability when referenced to either tCr or water (GABA+/tCr: CV=5.6%, ICC=0.69, 95% CI [0.52-0.80]; GABA+/water: CV=5.6%; ICC=0.73, 95% CI [0.58-0.83]) (Fig. 4). The data were normally distributed and there was a moderate correlation between block 1 and block 2 (GABA/tCr: r=0.531, GABA/water: r=0.576). Bland-Altman plots for both creatine and water referenced measures showed >95% (two outliers each) of blocks falling within repeatability coefficients and no skewness (Fig. 5).
Discussion
Auditory cortex GABA+ quantification with MEGA-sLASER in a clinical population with reported GABA+ abnormalities in the region of interest can be achieved with reproducibility and reliability that is comparable to other brain regions of healthy controls. GABA/water demonstrated better ICC when compared to GABA/Cr, though both fell within the “moderate” range, with the ICC for GABA/water approaching “good”5 for average measures. The 6.4min acquisition time for the MEGA-sLASER sequence was feasible for clinical use.Conclusions
MEGA-sLASER for GABA+ quantification in the auditory cortex has appropriate reproducibility and reliability for use as an averaged measure in research with a clinical population with described GABA+ abnormalities.Acknowledgements
This work was supported by NIAAA grant K23AA028295 (JMW) and USAMRAA grant W81XWH-18-1-0221 (DM). We would also like to acknowledge Kay Igwe for her assistance with data management.References
1. Duda JM, Moser AD, Zuo CS, Du F, Chen X, Perlo S, Richards CE, Nascimento N, Ironside M, Crowley DJ, Holsen LM. Repeatability and reliability of GABA measurements with magnetic resonance spectroscopy in healthy young adults. Magnetic resonance in medicine. 2021 May;85(5):2359-69.
2. Brix MK, Ersland L, Hugdahl K, Dwyer GE, Grüner R, Noeske R, Beyer MK, Craven AR. Within‐and between‐session reproducibility of GABA measurements with MR spectroscopy. Journal of Magnetic Resonance Imaging. 2017 Aug;46(2):421-30.
3. Mikkelsen M, Singh KD, Sumner P, Evans CJ. Comparison of the repeatability of GABA‐edited magnetic resonance spectroscopy with and without macromolecule suppression. Magnetic resonance in medicine. 2016 Mar;75(3):946-53.
4. O'Gorman RL, Michels L, Edden RA, Murdoch JB, Martin E. In vivo detection of GABA and glutamate with MEGA‐PRESS: reproducibility and gender effects. Journal of magnetic resonance imaging. 2011 May;33(5):1262-7.
5. Koo TK, Li MY. A guideline of selecting and reporting intraclass correlation coefficients for reliability research. Journal of chiropractic medicine. 2016 Jun 1;15(2):155-63.
6. Landheer K, Schulte RF, Treacy MS, Swanberg KM, Juchem C. Theoretical description of modern 1H in vivo magnetic resonance spectroscopic pulse sequences. Journal of Magnetic Resonance Imaging. 2020 Apr;51(4):1008-29.
7. Sedley W, Parikh J, Edden RA, Tait V, Blamire A, Griffiths TD. Human auditory cortex neurochemistry reflects the presence and severity of tinnitus. Journal of Neuroscience. 2015 Nov 4;35(44):14822-8.
8. Isler B, von Burg N, Kleinjung T, Meyer M, Stämpfli P, Zölch N, Neff P. Lower glutamate and GABA levels in auditory cortex of tinnitus patients: a 2D-JPRESS MR spectroscopy study. Scientific Reports. 2022 Mar 8;12(1):4068.
9. Levitt MH, Madhu PK, and Hughes CE. Cogwheel phase cycling. Journal of Magnetic Resonance. 2002 Apr;155(2):300-6.
10. Landheer K, Juchem C. Dephasing optimization through coherence order pathway selection (DOTCOPS) for improved crusher schemes in MR spectroscopy. Magnetic resonance in medicine. 2019 Apr;81(4):2209-22.
11. Landheer K, Juchem C. Simultaneous optimization of crusher and phase cycling schemes for magnetic resonance spectroscopy: an extension of dephasing optimization through coherence order pathway selection. Magnetic Resonance in Medicine. 2020 Feb;83(2):391-402.
12. Tkáč I, Starčuk Z, Choi IY, Gruetter R. In vivo 1H NMR spectroscopy of rat brain at 1 ms echo time. Magnetic Resonance in Medicine: An Official Journal of the International Society for Magnetic Resonance in Medicine. 1999 Apr;41(4):649-56.
13. Gajdošík M, Landheer K, Swanberg KM. INSPECTOR: free software for magnetic resonance spectroscopy data inspection, processing, simulation and analysis. Sci Rep 11, 2094 (2021).
14. S. W. Provencher, "Estimation of metabolite concentrations from localized in vivo proton NMR spectra," Magn Reson Med, vol. 30, no. 6, pp. 672-9, Dec 1993, doi: 10.1002/mrm.1910300604.
15. Landheer K, Swanberg KM, Juchem C. Magnetic resonance Spectrum simulator (MARSS), a novel software package for fast and computationally efficient basis set simulation. NMR in Biomedicine. 2021 May;34(5):e4129.
16. Govindaraju V, Young K, Maudsley AA. Proton NMR chemical shifts and coupling constants for brain metabolites. NMR in Biomedicine: An International Journal Devoted to the Development and Application of Magnetic Resonance In Vivo. 2000 May;13(3):129-53.
17. Ernst T, Kreis R, Ross BD. Absolute quantitation of water and metabolites in the human brain. I. Compartments and water. Journal of magnetic resonance, Series B. 1993 Aug 1;102(1):1-8.
18. Provencher SW. LCModel & LCMgui user’s manual. LCModel version. 2014 Jun 15;6(3). http://s-provencher.com/pub/LCModel/manual/manual.pdf.
19. Wyss PO, Bianchini C, Scheidegger M, Giapitzakis IA, Hock A, Fuchs A, Henning A. In vivo estimation of transverse relaxation time constant (T2) of 17 human brain metabolites at 3T. Magnetic resonance in medicine. 2018 Aug;80(2):452-61.
20. Hasan KM, Walimuni IS, Kramer LA, Narayana PA. Human brain iron mapping using atlas-based T2 relaxometry. Magn Reson Med 2012; 67: 731– 739.
21. Lin A, Andronesi O, Bogner W, Choi IY, Coello E, Cudalbu C, Juchem C, Kemp GJ, Kreis R, Krššák M, Lee P. Minimum reporting standards for in vivo magnetic resonance spectroscopy (MRSinMRS): experts' consensus recommendations. NMR in Biomedicine. 2021 May;34(5):e4484.
Figures