1943
Studying Differences in Gray Matter Volume in Patients with Meige syndrome and Facial Paralysis Using a Normative Modeling Approach1China-Japan Friendship Hospital, Beijing, China
Synopsis
Keywords: Head & Neck/ENT, Head & Neck/ENT, Normative Modeling; Meige syndrome; Facial Paralysis; Machine Learning
Motivation: This study delves into the variations in gray matter volume among patients with Meige Syndrome (MS), facial paralysis (FP), and healthy controls.
Goal(s): It aims to unveil the neurological mechanisms underlying these conditions. With a sample of 53 FP patients, 31 MS patients, and 102 healthy controls, the research assesses disease severity and conducts high-resolution MRI imaging.
Approach: Normative modeling and machine learning algorithms are employed to identify differences in specific brain regions.
Results: Results reveal significant variations in gray matter volume, particularly in the anterior cingulate region, shedding light on the importance of this area in understanding these conditions.
Impact: This study's outcomes could transform clinical practice and research in Ménière's Syndrome and facial paralysis. Enhanced diagnostic and treatment methods may significantly improve patients' quality of life, fostering exploration of innovative therapies and a deeper understanding of these conditions.
Introduction
Facial paralysis (FP) is characterized by impaired facial muscle function resulting from facial nerve injuries [1]. Meige syndrome (MS), also known as blepharospasm-oromandibular dystonia, is a cranio-cervical dystonia disorder with a variable course that often leads to blepharospasm or oromandibular dystonia [2]. The pathogenesis and etiology of both MS and FP remain only partially understood, with some theories suggesting involvement of basal ganglia dysfunction while others propose inadequate inhibition within the central nervous system, leading to hyperactivity in patients [3]. Gray matter volume is a critical indicator of brain function, and analyzing gray matter volume can reveal potential abnormalities in brain regions associated with MS and FP. This study aims to explore these gray matter volume differences among individuals with MS, FP, and healthy controls, ultimately shedding light on the underlying neurological mechanisms of these conditions.Methods
Participants in this study included 53 patients with FP, 31 patients with MS, and 102 HC, all recruited from the Department of Neurosurgery at the China-Japan Friendship Hospital. For MS patients, disease severity was assessed using the Burke-Fahn-Marsden Dystonia Rating Scale (Motor Section) (BFMDRS-M) and the Blepharospasm Disability Index (BSDI). Facial function in FP patients was evaluated using the Toronto Facial Grading System (TFGS). High-resolution structural images were acquired through 3.0T magnetic resonance imaging (MRI), and data quality reports were generated using the MRI Quality Control (mri_qc) toolkit. These high-resolution T1 MRI scans were processed using Freesurfer, allowing for the calculation of gray matter volumes in 34 brain regions based on the Desikan-Killiany brain template for both patient and control groups. Differential analysis was conducted to identify distinct brain regions, and corrections for multiple comparisons were applied. Normalization and modeling were based on a collaborative international brain atlas known as "Brainchart" which estimated percentile differences for each participant from the China-Japan Friendship Hospital [4]. Machine learning techniques were implemented using the R programming language and the mlr3 package, incorporating four different algorithms: random forests, support vector machines, extreme gradient boosting, and K-nearest neighbors. These algorithms utilized differential brain region volumes to classify patients with olfactory dysfunction and healthy controls, with classification accuracy assessed through the area under the curve (AUC) and model performance evaluated through cross-validation.Results
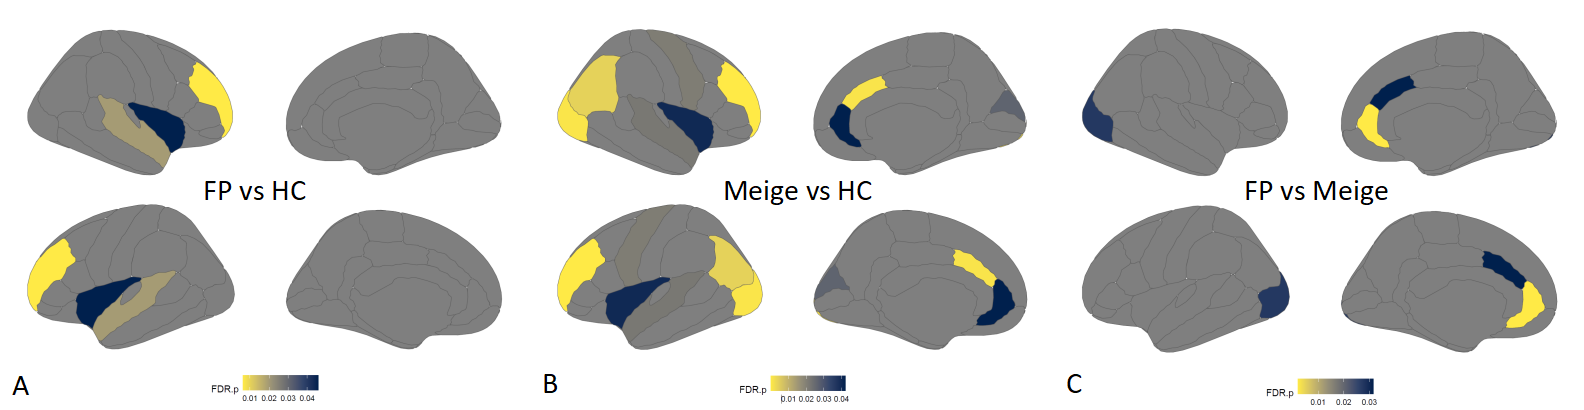
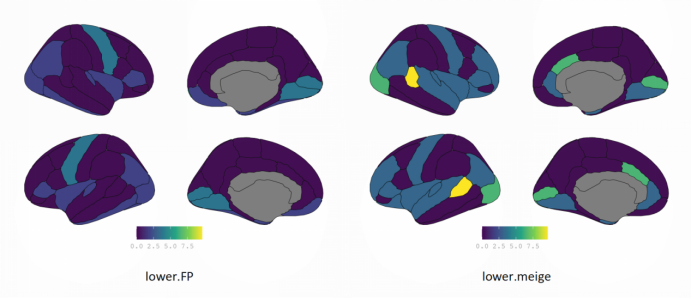
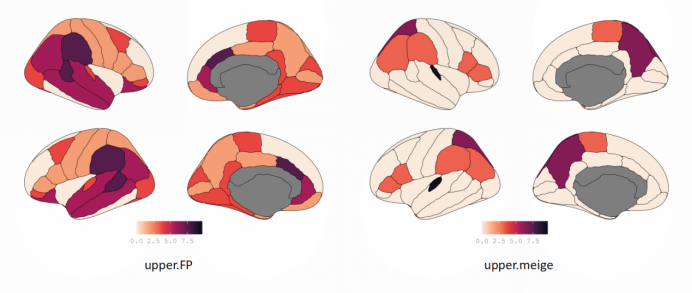
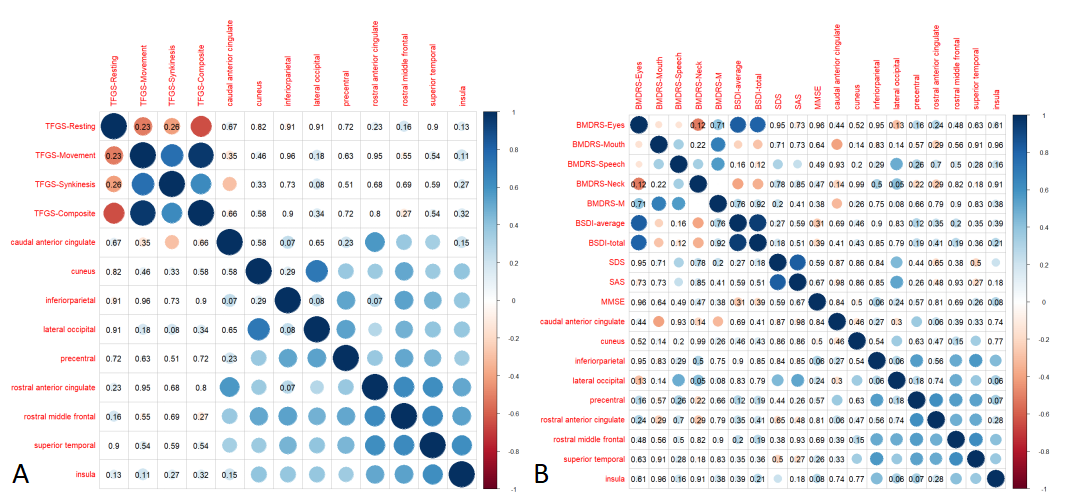
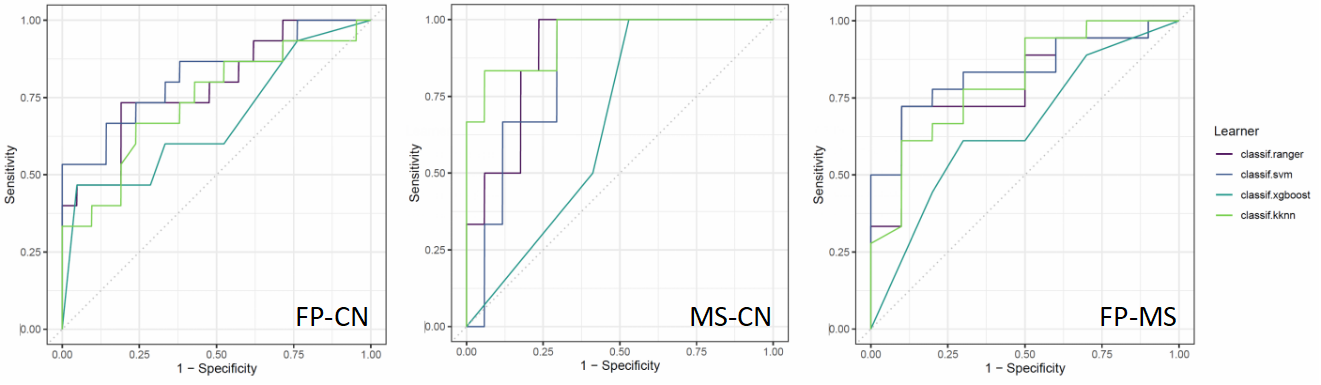
The study re-matched the FP, MS, and HC groups to ensure consistency in terms of age and gender, with the FP group (mean age: 43.6 years) and the corresponding HC group (mean age: 41.2 years), as well as the MS group (mean age: 58.3 years) and the corresponding HC group (mean age: 52.1 years). Comparing FP and MS patients revealed significant differences in brain regions such as the caudal anterior cingulate (P=0.032), rostral anterior cingulate (P=0.002), and lateral occipital (P=0.028) following Bonferroni correction (Figure 1).The normalization modeling study revealed that in less than 2.5% of MS and FP patients, the brain regions Bankssts (superior temporal sulcus), caudal anterior cingulate, and lateral occipital exhibited abnormalities (Figure 2). Conversely, in over 97.5% of MS and FP patients, the brain regions Bankssts, caudal anterior cingulate, and supramarginal displayed abnormalities (Figure 3). In FP patients, a notable correlation was found between the caudal anterior cingulate and the Unified Dystonia Rating Scale (UDRS) motor scores (r=-0.30, P=0.036). In MS patients, the caudal anterior cingulate demonstrated significant correlations with the BFMDRS-Oral (r=-0.40, P=0.014), BFMDRS-Lower Face (r=-0.37, P=0.036), and total BFMDRS scores (r=-0.33, P=0.047) (Figure 4). Additionally, machine learning classification utilizing differential brain region features consistently achieved AUC values exceeding 0.8 (Figure 5).Discussion
The results of this study provide valuable insights into the differences in gray matter volume among patients with MS, FP, and healthy controls, with particular emphasis on the caudal anterior cingulate region. These findings enhance our understanding of the pathophysiological mechanisms underlying these conditions, which have remained only partially elucidated in terms of their etiology and development [5]. These observations suggest that dysfunction within the basal ganglia and the central nervous system, as indicated by differences in gray matter volume, may contribute to the onset and severity of these conditions [6]. Moreover, the successful application of machine learning algorithms for classification demonstrates their potential clinical utility in aiding the diagnosis and differentiation of MS and FP, making them valuable tools for supporting clinical decision-making.Conclusion
This study has revealed differences in brain region volumes among individuals with facial paralysis, Meige Syndrome, and healthy controls, with the caudal anterior cingulate region identified as an important brain area.Furthermore, machine learning algorithms showed promising potential for classifying facial palsy and Meige syndrome, providing valuable tools for clinical decision support.Acknowledgements
The authors thank Dr. Lizhi Xie from GE Healthcare for help in solving MR technical problems.
References
[1] Basić-Kes V, Dobrota VD, Cesarik M, et al. Peripheral facial weakness (Bell's palsy). Acta Clin Croat 2013;52:195-202.
[2]. Zalyalova, Z. A. (2015). [Meige’s syndrome or segmental craniocervical dystonia: terminology, history and contemporary view]. Zh. Nevrol. Psikhiatr. Im. S S Korsakova 115, 133–136.
[3] Liu J, Li L, Li Y, Wang Q, Liu R, Ding H. Metabolic Imaging of Deep Brain Stimulation in Meige Syndrome. Front Aging Neurosci. 2022 Mar 17;14:848100.
[4] Bethlehem RAI, Seidlitz J, White SR, et al. Brain charts for the human lifespan. Nature. 2022 Apr;604(7906):525-533.
[5] Tolisano AM, Hunter JB, Sakai M, Kutz JW Jr, Moore W, Pinho M, Isaacson B. Determining Etiology of Facial Nerve Paralysis With MRI: Challenges in Malignancy Detection. Ann Otol Rhinol Laryngol. 2019 Sep;128(9):862-868.
[6] Su BM, Kuan EC, St John MA. What is the role of imaging in the evaluation of the patient presenting with unilateral facial paralysis? Laryngoscope. 2018 Feb;128(2):297-298.
Figures