1941
Diagnostic performance of synthetic MRI in distinguishing between benign and malignant pathologies in the oral cavity and oropharynx regions1Department of Radiology, Shanghai Ninth People’s Hospital, Shanghai JiaoTong University School of Medicine., Shang hai, China, 2MR Research, GE Healthcare, Shanghai, China, Shang hai, China
Synopsis
Keywords: Head & Neck/ENT, Tumor
Motivation: Malignancies originating from the mucosa of the oral cavity and oropharynx are considered as one of the most prevalent types of malignancies.
Goal(s): We intended to evaluate the diagnostic performance of MAGIC in distinguishing between benign and malignant pathologies in the oral cavity and oropharynx regions.
Approach: This study enrolled 45 patients with malignancies and 19 patients with benign pathologies. The quantitative values were measured and histogram features were extracted from lesion regions. ROC curves were constructed to evaluate the diagnostic efficiency.
Results: The quantitative mappings showed similar diagnostic performance as morphological images. The diagnostic efficacy was further improved with all images combined.
Impact: Considering the routine diagnosis of malignancies mainly based on morphologic and contrast-enhanced images, the present study validated the clinical value of MAGIC to acquire both of the morphological and quantitative images during a single scan without contast.
Introduction
Malignancies originating from the mucosa of the oral cavity and oropharynx are widely acknowledged as one of the most prevalent types of malignancies globally with an estimated 470,000 new cases and 225,000 deaths annually1. The accurate differentiation between benign and malignant pathologies is undeniably crucial in terms of treatment strategies and prognosis, as the selection of conservative therapy and surgical excision can significantly impact the vital function of the corresponding anatomical sites. A novel synthetic MRI technique, Magnetic Resonance Image Compilation (MAGiC) enables the acquisition of both synthetic morphologic and quantitative images in a single scanning session2. The motion artifact resulting from unconscious swallowing can be largely reduced during a single scan compared to conventional multiple scans to acquire individual morphologic and quantitative images. The routine diagnosis of malignancies has been based on morphologic images but MAGIC can provide additional quantitative magnetic properties of tissues. Thus, this study aims to evaluate the diagnostic performance of MAGIC in assessing benign and malignant pathologies within the oral cavity and oropharynx regions.Methods
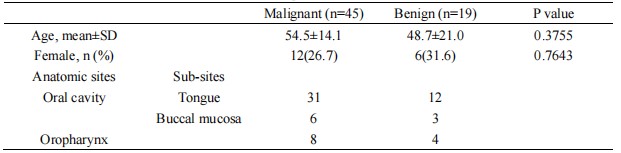
Our Institutional Review Board approved the scan protocol and written informed consent was obtained from all the participants. We prospectively enrolled 45 patients (mean age was 54.5 years, 13 females) with malignancies, 19 patients (mean age was 48.7 years,6 females) with benign pathologies in our hospitals from April to October, 2023. The examinations were conducted on a 3.0T MR scanner (Premier, GE Healthcare, WI) with a 21-channel head and neck coil. The scan parameters of the MAGIC sequence were: FOV = 240×192 mm2, acquisition matrix =320x256, TR/TE = 4648/21.5 ms, slice thickness/gap = 3.00/0.3 mm, NEX = 1.00, and scan time = 4min2s. The synthetic MR images were reconstructed offline using the dedicated workstation and lesion regions were manually delineated by an experienced radiologist. The T1, T2, and PD values of each lesion and the corresponding contralateral healthy areas were quantitatively measured for all the patients (Figure 1). Histogram features were extracted from the delineated ROIs of both morphologic and quantitative images by PyRadiomics (version 3.0.1). The histogram features were then selected through two-sample t test, which revealed significant distinctions between benign and malignant lesions. Subsequently, the ROC curves were constructed to evaluate the diagnostic efficiency. All statistical analyses were performed using Graphpad Prism and SPSS software. Differences were considered statistically significant at P<0.05.Results
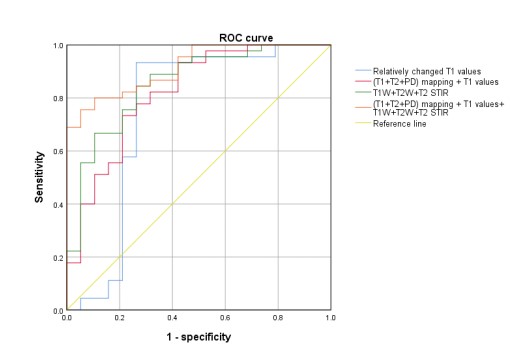
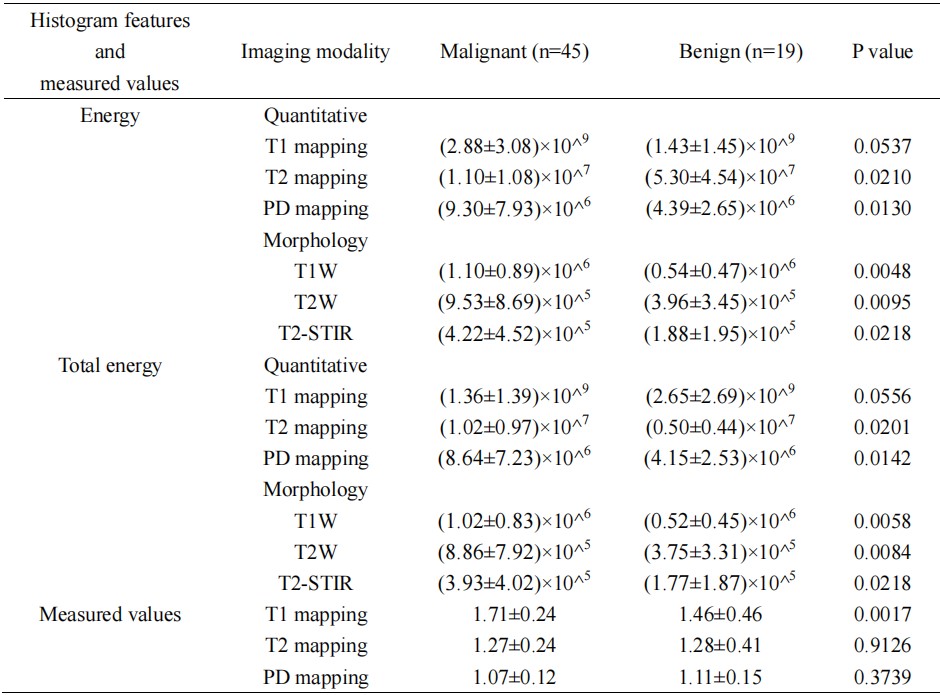
Table 1 shows the demographic data of the patients with different types of lesions. Two histogram features, Energy and Total Energy, demonstrated significant disparities in both quantitative and morphologic images derived from MAGIC (Table 2). For quantitative images, T1, T2 and PD values of the lesion regions relative to the corresponding contralateral healthy areas were used for comparison. Only T1 relative values showed significant differences between benign and malignant lesions (Figure 2) with a diagnostic efficacy of AUC = 0.750 and 95% CI = 0.578-0.922 (Figure 3). In terms of histogram features, the combined T1w, T2w and T2 STIR images showed the similar diagnostic efficacy (AUC = 0.821, 95% CI = 0.703-0.939) as compared to the combined T1, T2 and PD maps (AUC = 0.854, 95% CI = 0.750-0.957). The diagnostic efficacy could be further improved with combined T1w, T2w, T2 STIR, T1map, T2map, PD map and T1 relative values (AUC = 0.916, 95% CI = 0.850-0.982) (Figure 3).Discussion
The difference analysis revealed that the energy and total energy of the histogram in all morphologic and quantitative images exhibited significant differences among various pathologies. Energy, referring to the magnitude of voxel values in the image, is dependent on both volume and signal density3. Moreover, the total energy emphasized the impact of volume. Thus, the results validate the vital role of depth of invasion of malignances in the oral cavity and oropharynx in the eighth edition of the Cancer Staging Manual of the Joint Council on Cancer (AJCC)4. Additionally, malignancies exhibited a significantly increased T1 relaxation time, while there were no significant variations observed in T2 and PD values. The elevated T1 values are typically correlated with a more abundant extracellular matrix in malignant pathologies5. These quantitative images can provide additional micro-cellular information and demonstrate improved efficiency when combined with morphologic images.Conclusion
Although the quantitative relaxation maps showed similar diagnostic performance in differentiation of benign and malignant lesions as compared to morphological images, the diagnostic efficacy could be further improved if combined the morphological images and quantitative maps together, which validated the clinical value of the MAGIC technique.Acknowledgements
NoneReferences
1. International Agency for Research on Cancer. Global Cancer Observatory. Cancer Today. Lyon: IARC. https://gco.iarc.fr/, Accessed Date Accessed.
2. Warntjes JB, Leinhard OD, West J, Lundberg P. Rapid magnetic resonance quantification on the brain: Optimization for clinical usage. Magnetic resonance in medicine 2008; 60(2): 320-329.
3. van Griethuysen JJM, Fedorov A, Parmar C, Hosny A, Aucoin N, Narayan V et al. Computational Radiomics System to Decode the Radiographic Phenotype. Cancer research 2017; 77(21): e104-e107.
4. Lydiatt WM, Patel SG, O'Sullivan B, Brandwein MS, Ridge JA, Migliacci JC et al. Head and Neck cancers-major changes in the American Joint Committee on cancer eighth edition cancer staging manual. CA: a cancer journal for clinicians 2017; 67(2): 122-137.
5. Meng T, He N, He H, Liu K, Ke L, Liu H et al. The diagnostic performance of quantitative mapping in breast cancer patients: a preliminary study using synthetic MRI. Cancer imaging : the official publication of the International Cancer Imaging Society 2020; 20(1): 88.
Figures
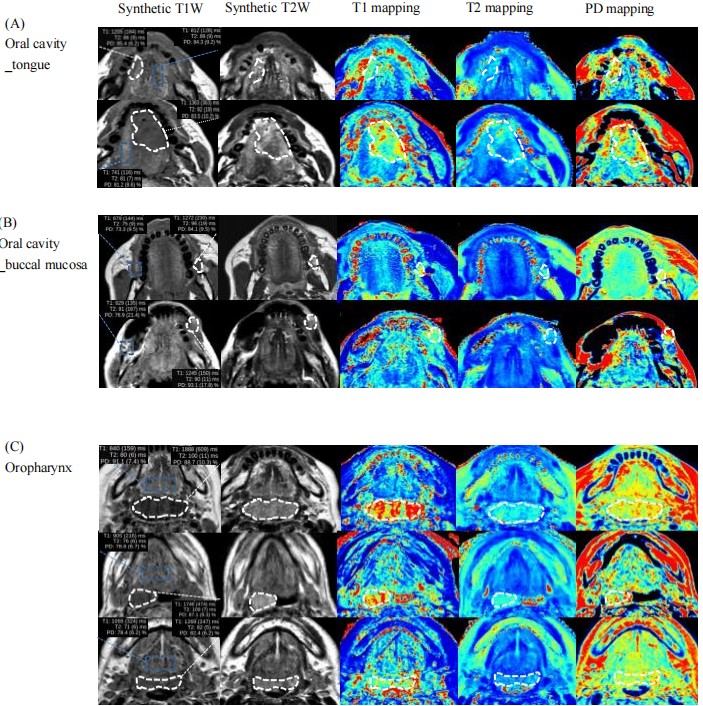
Fig.1 The exemplary images of different anatomical sites. According to pathology results, from top to down, (A) OSF (precancerous lesion), SCC; (B) Mucoepidermoid carcinoma, SCC (C) lymphoma, SCC , pharyngitis. The differential changes in quantitative mappings may aid in distinguishing similar morphologies between benign and malignant pathologies. Notably, the contralateral healthy area were also measured to eliminate the microenvironmental effects of the individual difference.
OSF, Oral submucous fibrosis; SCC, Squamous cell carcinomas
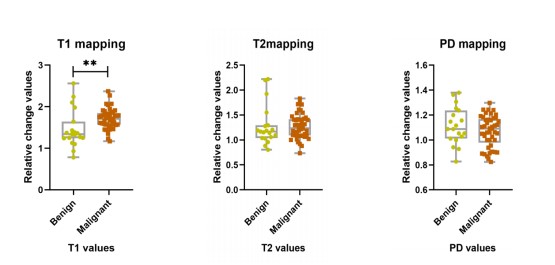
Fig.2 The difference analysis of measured variations in T1, T2, and PD values between benign and malignant pathologies.
*The values represented as the relative changes, namely (Sl-Sh)/Sh, Sl refers to the mean signal values of lesions, while Sh refers to the mean signal values of contralateral healthy area