1937
Magnetic Resonance Imaging of Advanced Bionics HiRes Ultra 3D Cochlear Implants1Sir Peter Mansfield Imaging Centre, School of Physics and Astronomy, University of Nottingham, Nottingham, United Kingdom, 2Hearing Sciences, Division of Mental Health and Clinical Neurosciences, School of Medicine, University of Nottingham, Nottingham, United Kingdom, 3National Institute for Health Research (NIHR) Nottingham Biomedical Research Centre, Nottingham, United Kingdom, 4Sir Peter Mansfield Imaging Centre, School of Medicine, University of Nottingham, Nottingham, United Kingdom, 5Radiological Sciences, Division of Mental Health and Clinical Neurosciences, School of Medicine, University of Nottingham, Nottingham, United Kingdom, 6Radiology, Nottingham University Hospitals NHS Trust, Nottingham, United Kingdom, 7Philips Healthcare N. V., Best, Netherlands, 8Advanced Bionics GmbH, Fellbach-Oeffingen, Germany, 9ENT, Nottingham University Hospitals NHS Trust, Nottingham, United Kingdom, 10Rinri Therapeutics Ltd., Sheffield, United Kingdom
Synopsis
Keywords: Head & Neck/ENT, Head & Neck/ENT, Cochlear Implant Artifacts
Motivation: A cochlear implant (CI) contains an implanted magnet placed under the scalp. Newer rotating magnet designs facilitate safe and comfortable scanning up to and including 3 T. However, MRI of the head is still confounded by image distortion.
Goal(s): To characterise CI artefacts at 3 T.
Approach: T2DRIVE and T1-weighted mDIXON images were acquired in CI users, normally-hearing participants, and a phantom.
Results: Visibility of bilateral internal auditory canals and cochleae varied across three CI users. Pre-surgical assessment will be beneficial on an individual basis to maximise the chances of successful post-operative MR acquisition.
Impact: Bilateral internal auditory canals can be visualised despite the presence of a cochlear implant (CI): an assessment of the effect of a CI on the usability of clinical MR images in CI users, normally-hearing individuals, and a phantom.
Motivation
Cochlear implants (CI) partially restore hearing to deaf individuals. A CI contains a small magnet implanted under the scalp, to hold the external radiofrequency transmitter coil in place. Due to advances in retaining magnet designs, it is now practical to conduct MR imaging in recipients of such CIs without the need for splinting/bandaging the head, with the only restriction being a specific absorption rate (SAR) limit used in scanning. While it is now feasible and ethical to include some CI users in research, the implanted magnet still presents significant challenges to image quality.This study aimed to assess the impact of the implanted magnet on the usability of optimised clinical sequences for post-implantation surveillance of bilateral internal auditory canals (IACs), as is required in the monitoring of multiple chronic health conditions (e.g., neurofibromatosis type 2) and to provide outcome measures for trials of novel adjunctive therapies, including cell-based treatments [1].
Methods
Four normally-hearing individuals (mean age 32 years; n=2 male) and three CI users (mean age 61 years; n=3 male; implant model = Advanced Bionics HiRes Ultra 3D CI) were imaged for one session each. Normally-hearing individuals were scanned wearing a swim cap holding a CI placed in 8 different plausible locations for surgical implantation, and once without the CI (control condition).MRI data were acquired on a Philips 3.0 T Ingenia MR scanner (Philips Healthcare, Best, Netherlands) using a 32-channel SENSE head coil. Software on the scanner (ScanWise Implant, Philips Healthcare) implemented the MR conditional requirements for the specific model of CI as published by Advanced Bionics. Data were collected using (1) a T2DRIVE (T2-weighted driven equilibrium, achieved using a TSE readout with 90° flip-back pulse) as this provides high contrast between CSF (high signal) and nerve tissue (low signal), and (2) a T1-weighted TSE with fat subtraction. These image acquisitions were selected following clinician consultation as these would be the likely sequences requested to perform the bilateral IAC surveillance described.
Acquisition parameters:
T2DRIVE: FOV=144×144×46mm3; acquisition voxel size=0.5×0.5×1mm3 reconstructed to 0.5mm3; compressed SENSE factor=7; 92 transverse slices; parallel 40-mm rest slab; TSE factor=56; flip angle=90°; TE/TR=240/2000ms; bandwidth=256.1Hz; scan duration=2:48.
T1-weighted TSE: FOV=120×150×30mm3; acquisition voxel size=1×1×1mm3 reconstructed to 0.5×0.5×1mm3; compressed SENSE factor=4; fat suppression=mDIXON; 27 transverse slices; TSE factor=4; flip angle=90°; 5 averages; TE/TR=9/538ms; bandwidth=947Hz; scan duration=2:55.
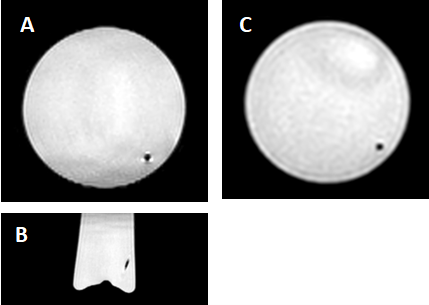
To assess the size of the artefact produced by the CI electrode alone, both acquisitions were also performed with the CI placed inside a 50-mm diameter cylindrical bottle (contents: CuSO4-5H2O).
Acquisitions were repeated nine times on each normally-hearing participant (8 CI locations, 1 control scan) and evaluated by two independent neuroradiologists for the impact of the artefact on the ability to visualise pathology if it were present.
Acquisitions were repeated once in each CI user in addition to further acquisitions including MARS (metal artefact reduction sequence) and a T1-weighted TSE with SEMAC (slice-encoding for metal artefact correction), as follows: FOV=250×417×51mm3; acquisition voxel size=1.2×1.3×3mm3 reconstructed to 0.6×0.6×3mm3; SENSE factor=2.4 (phase); fat suppression=SPIR; 17 coronal slices; SEMAC+VAT; TSE factor=3; flip angle=90°; TE/TR=11/750ms; bandwidth=1133.8Hz; scan duration=7:16.
Results
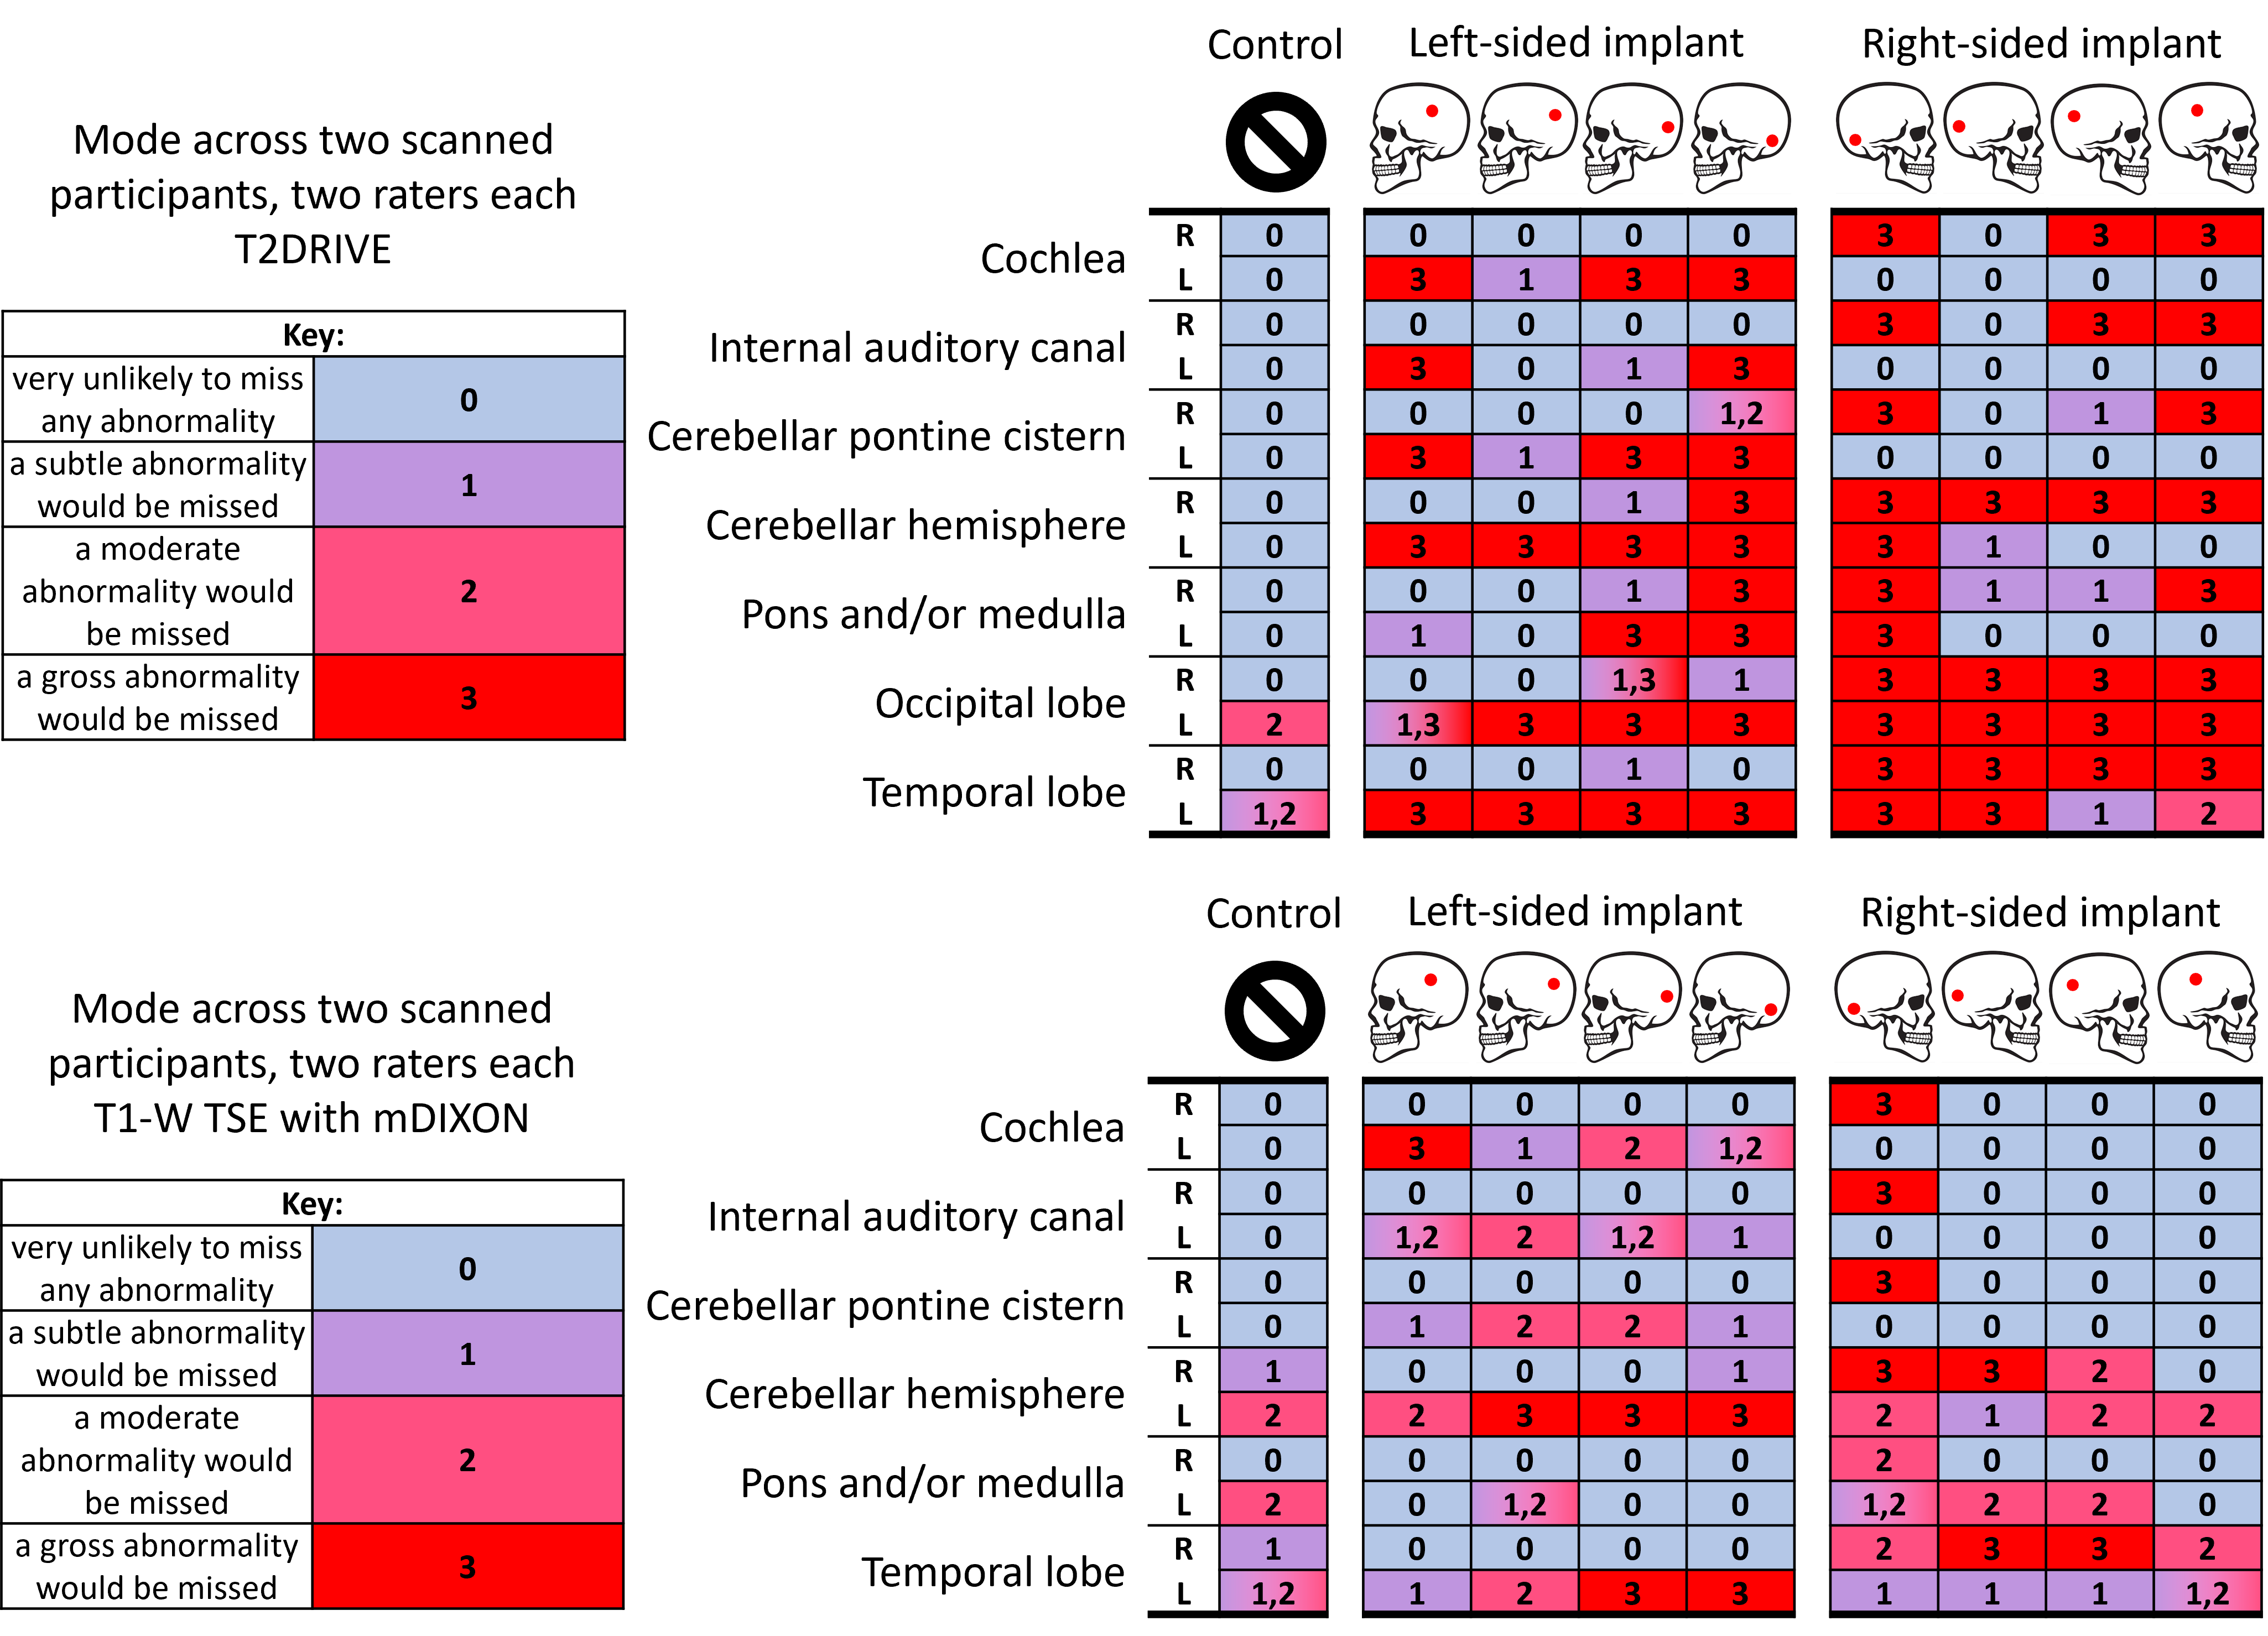
Figure 1 shows the image artefact in the phantom produced by the electrode. The diameter of the region of signal drop-out was measured to be 1.9 mm in the T2DRIVE and 1.6 mm in the T1-weighted mDIXON.Figure 2 shows the impact of the CI artefact on the likely detection of abnormalities for each brain region shown by the modal rating across raters and normally-hearing participants with CI placed under a swim cap. Higher values and red shading indicate higher likelihood of an abnormality being missed by radiological evaluation, whereas lower/blue indicates a low likelihood of missing pathology. Inter-rater agreement was statistically “substantial” for both sets of T2DRIVE images (κ=0.82, 0.88), and one participant’s set of T1-weighted mDIXON images (κ=0.62), while the T1-weighted mDIXON images from the other participant only achieved “fair” inter-rater agreement (κ=0.36).
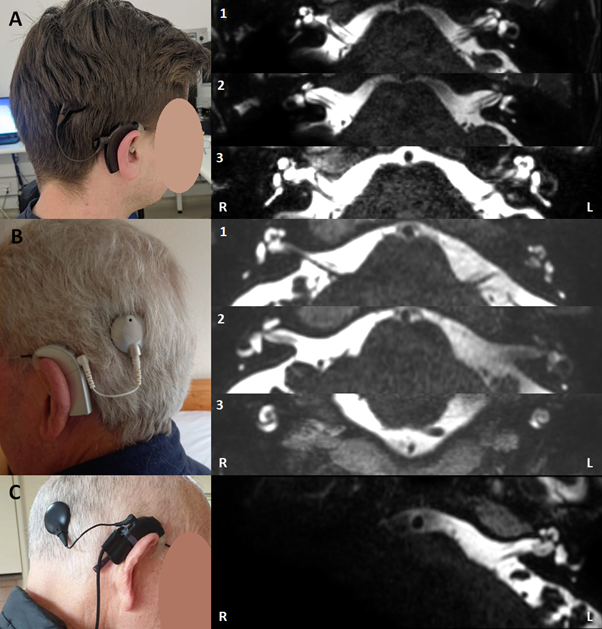
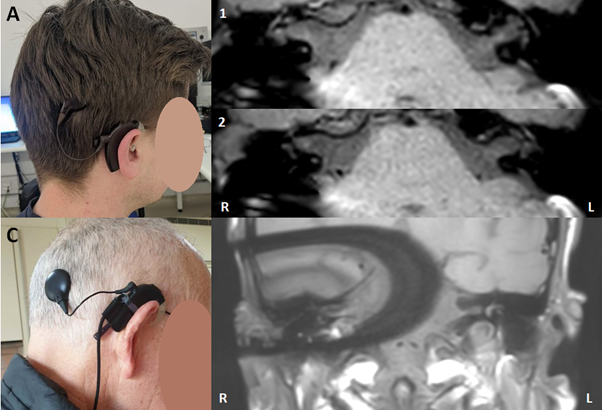
Images of CI users are shown in Figures 3 (T2DRIVE) and 4 (T1-weighted TSE with fat-suppression).
Discussion
Visibility of bilateral IACs and cochleae varied across three CI users, with images in participant A being broadly usable, B being somewhat usable, and C being more challenging and providing less confidence, likely due to differences in implant locations and cranial/neuroanatomical variations. Ratings of images in normally-hearing participants showed that more anterior CI locations were associated with lower likelihoods of missing a gross abnormality. Individual pre-surgical assessment using these methods may maximise the suitability of MRI for the assessment of bilateral IACs in the monitoring of chronic health conditions and as outcome measures for safety monitoring in clinical trials.Acknowledgements
The authors would like to acknowledge Advanced Bionics GmbH and Rinri Therapeutics Ltd. for their support. This work was supported by the National Institute for Health Research (NIHR) Nottingham Biomedical Research Centre.References
[1] Chen W, et al. Nature. 2012 Oct 11;490(7419):278-82.Figures