1933
Quantitative 3D T1rho and T2 Mapping for Radiotherapy Treatment Response Monitoring in Head and Neck Cancer1Department of Medical Physics, Memorial Sloan Kettering Cancer Center, New York, NY, United States, 2Department of Radiology, Albert Einstein College of Medicine and Montefiore Medical Center, Bronx, NY, United States, 3Department of Radiology, Memorial Sloan Kettering Cancer Center, New York, NY, United States, 4Department of Radiation Oncology, Memorial Sloan Kettering Cancer Center, New York, NY, United States
Synopsis
Keywords: Head & Neck/ENT, Cancer, Head and Neck Cancer, T1rho mapping, T2 mapping, Radiotherapy, Treatment responses
Motivation: Early assessment of response to radiotherapy may be useful to crucial for effectively managing head and neck cancer (HNC).
Goal(s): To evaluate the response to radiotherapy in HNC using quantitative 3D T1rho and T2 mapping.
Approach: T1rho and T2 mapping was performed on a healthy volunteer and three HNC patients, one of whom was scanned before, during, and after radiotherapy.
Results: Significant decrease in T1rho and T2 values of the tumor were observed two weeks after starting and completing radiotherapy. However, the values in other tissues, such as muscles, remained relatively stable across the three scans.
Impact: This study evaluates the feasibility of using quantitative T1rho and T2 mapping to assess the treatment response to radiotherapy for head and neck cancer. This information could be valuable in tailoring individualized treatments for patients with head and neck cancer.
INTRODUCTION
Head and neck cancer (HNC) incidence is expected to increase significantly by 2030, largely due to human papillomavirus-related oropharyngeal carcinoma (HPV+OCP)1. One standard care for HPV+OPC is concurrent chemotherapy with radiation2. Imaging biomarkers can be useful in clinical practice for tumor detection and early monitoring of treatment responses. Diffusion-weighted imaging (DWI) and dynamic contrast-enhanced (DCE) MRI have shown promise in assessing tumor cellularity and vascularity for monitoring and predicting treatment response3. However, susceptibility differences limit DWI and rely on b-value selection for ADC quantification, and DCE-MRI is not sufficiently robust due to nonspecific vessel leakage3. Therefore, alternative imaging biomarkers are needed to detect early treatment responses accurately. T1rho-imaging has shown sensitivity to HNC4 and other cancer therapeutical responses5,6 and could detect tumor response from cell apoptosis caused by radiotherapy (RT)7. Besides, the potential of T2-mapping for HNC is yet to be established and needs further evaluation. This study aimed to develop and evaluate quantitative T1rho/T2-mapping to monitor radiotherapy treatment response in HNC patients.METHODS
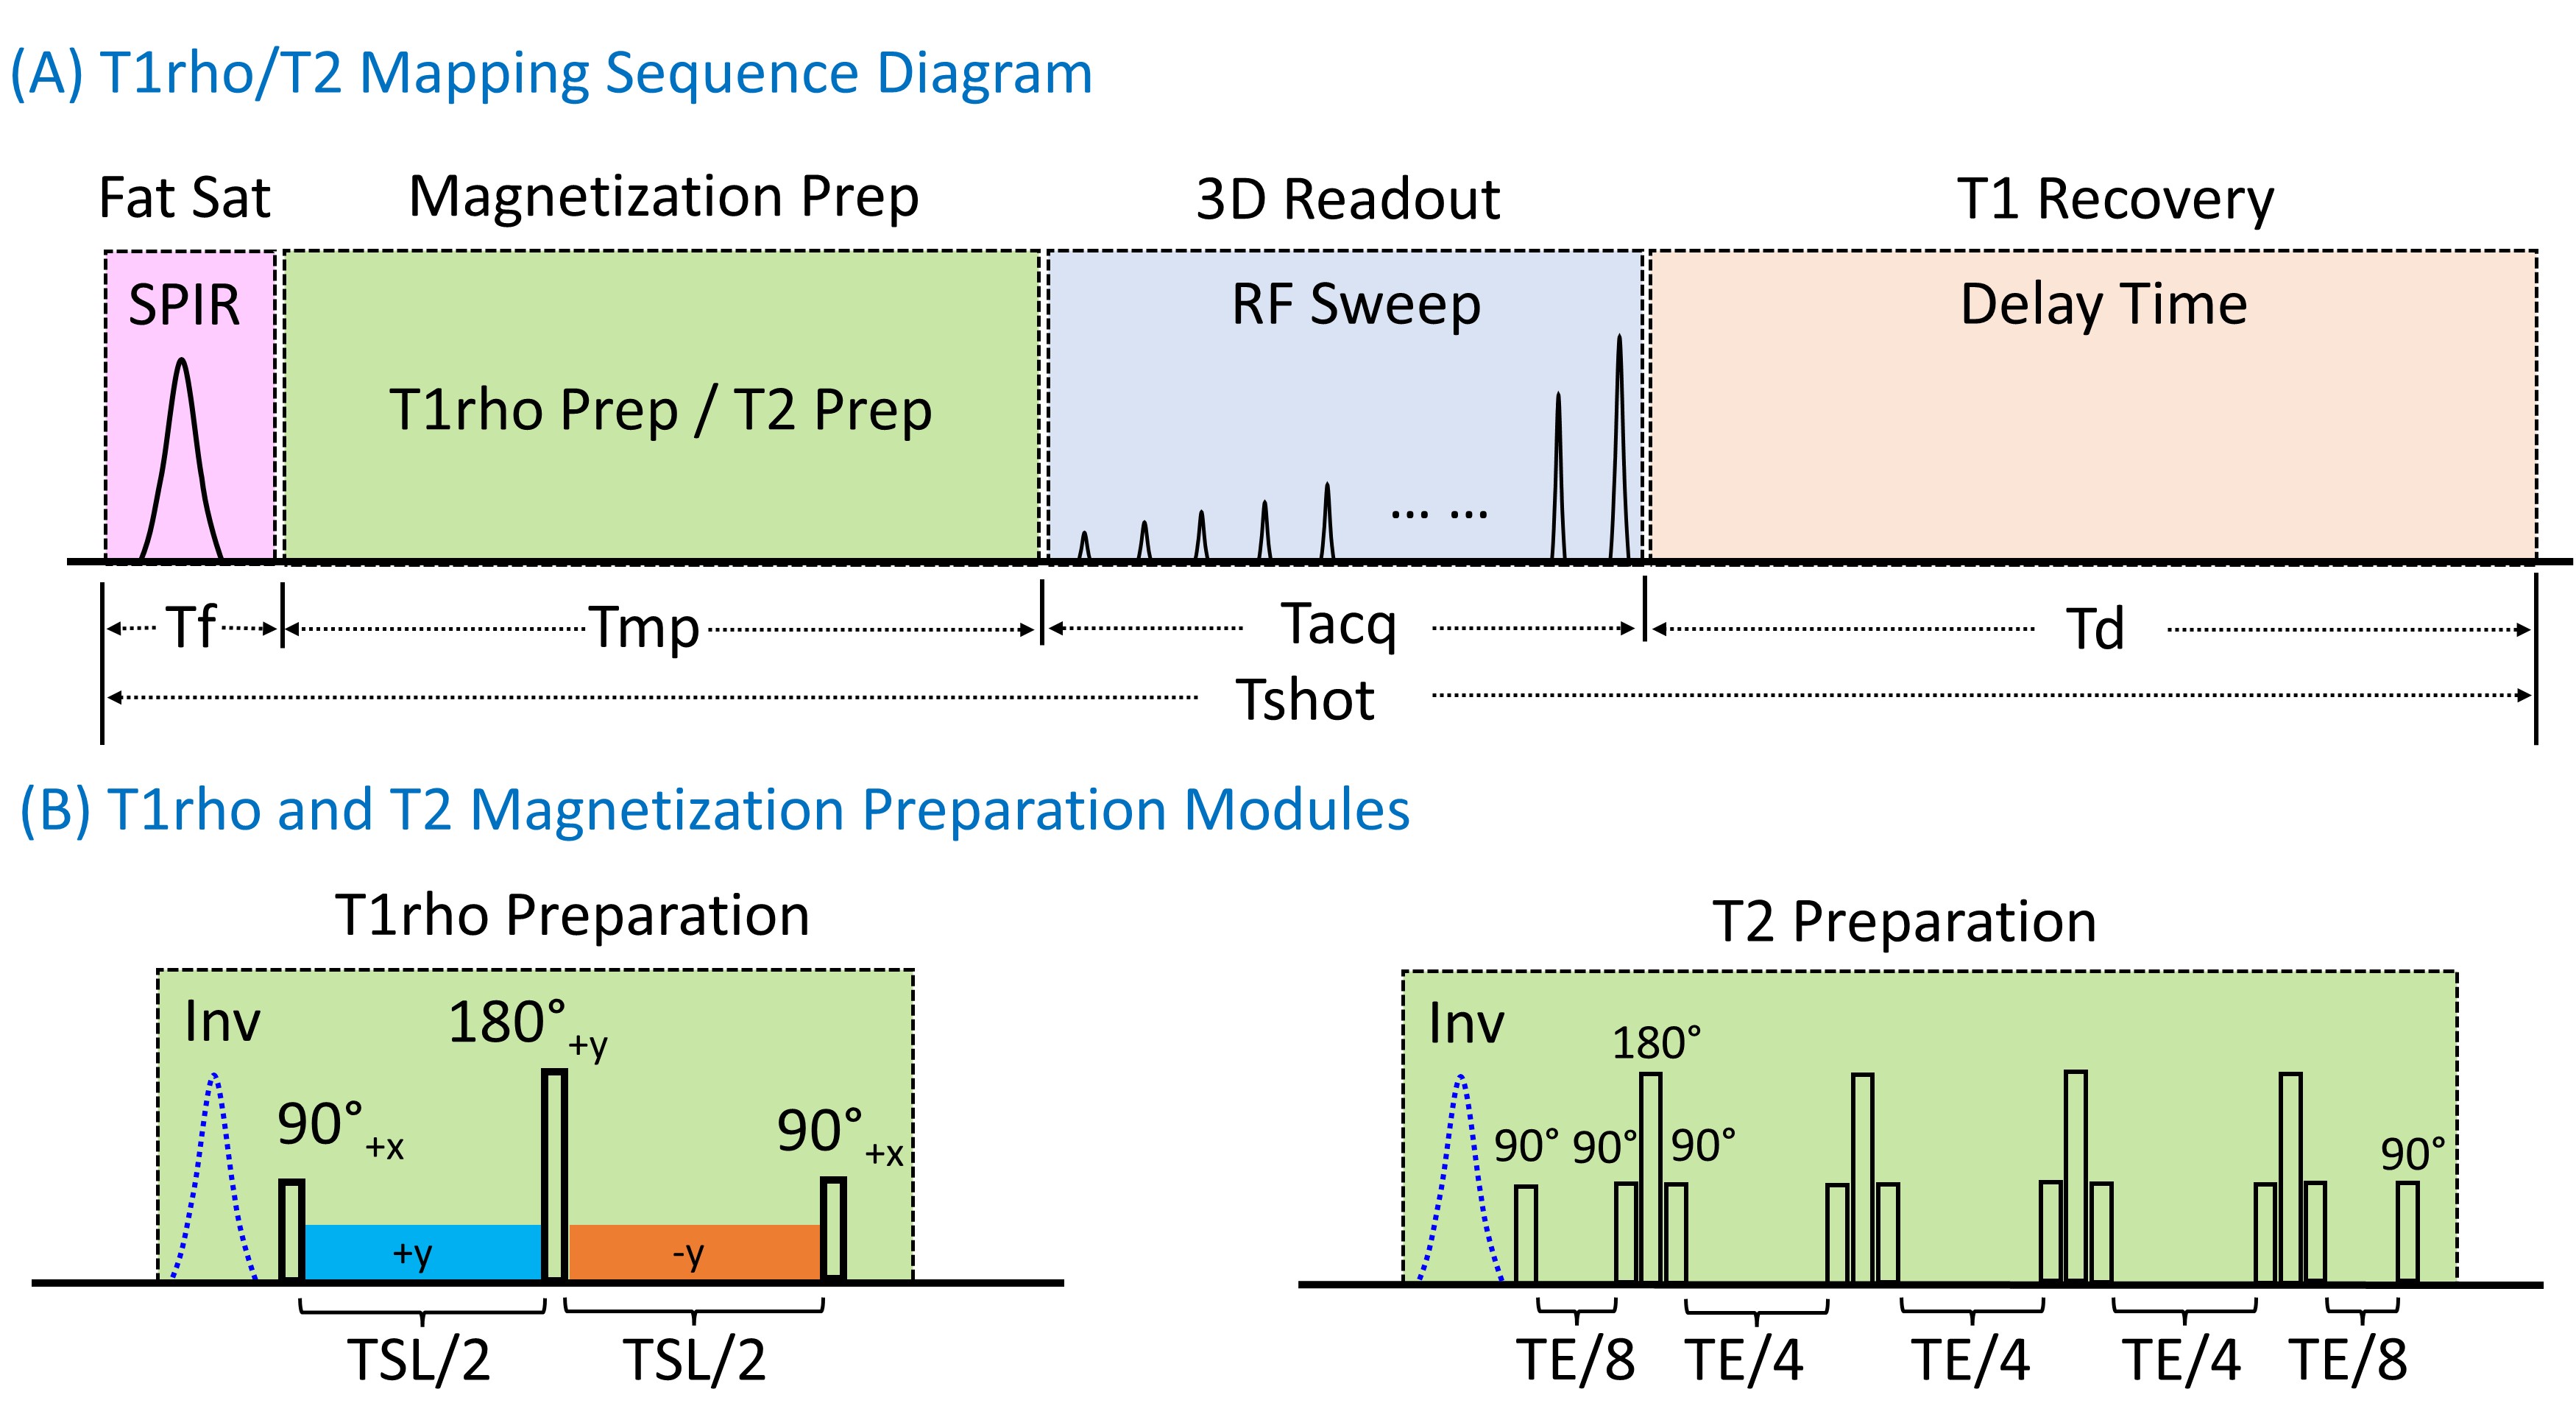
One volunteer and three HNC patients were scanned using a 3T MRI scanner (Philips Elition). One of the patients was scanned pre-RT (within one week of RT initiation), mid-RT (two weeks after RT initiation), and post-RT (within a week of RT completion) to assess changes in MR parameters.The T1rho/T2-mapping sequences included: fat-saturation, magnetization-preparation (MP), 3D-readout, and T1-recovery modules (Figure 1). T1rho-mapping used composite spin-locking pulses to compensate for B0/B1-inhomogeneities8. For T2-mapping, four self-compensated refocusing pulses were employed with MLEV phase cycling (PC)9. PC and variable flip angles were used for MAPSS (MP angle-modulated partitioned k-space spoiled gradient-echo snapshots) acquisitions10. PC was achieved by adding an adiabatic-inversion pulse before spin-locking (T1rho) and refocusing (T2) pulses11.
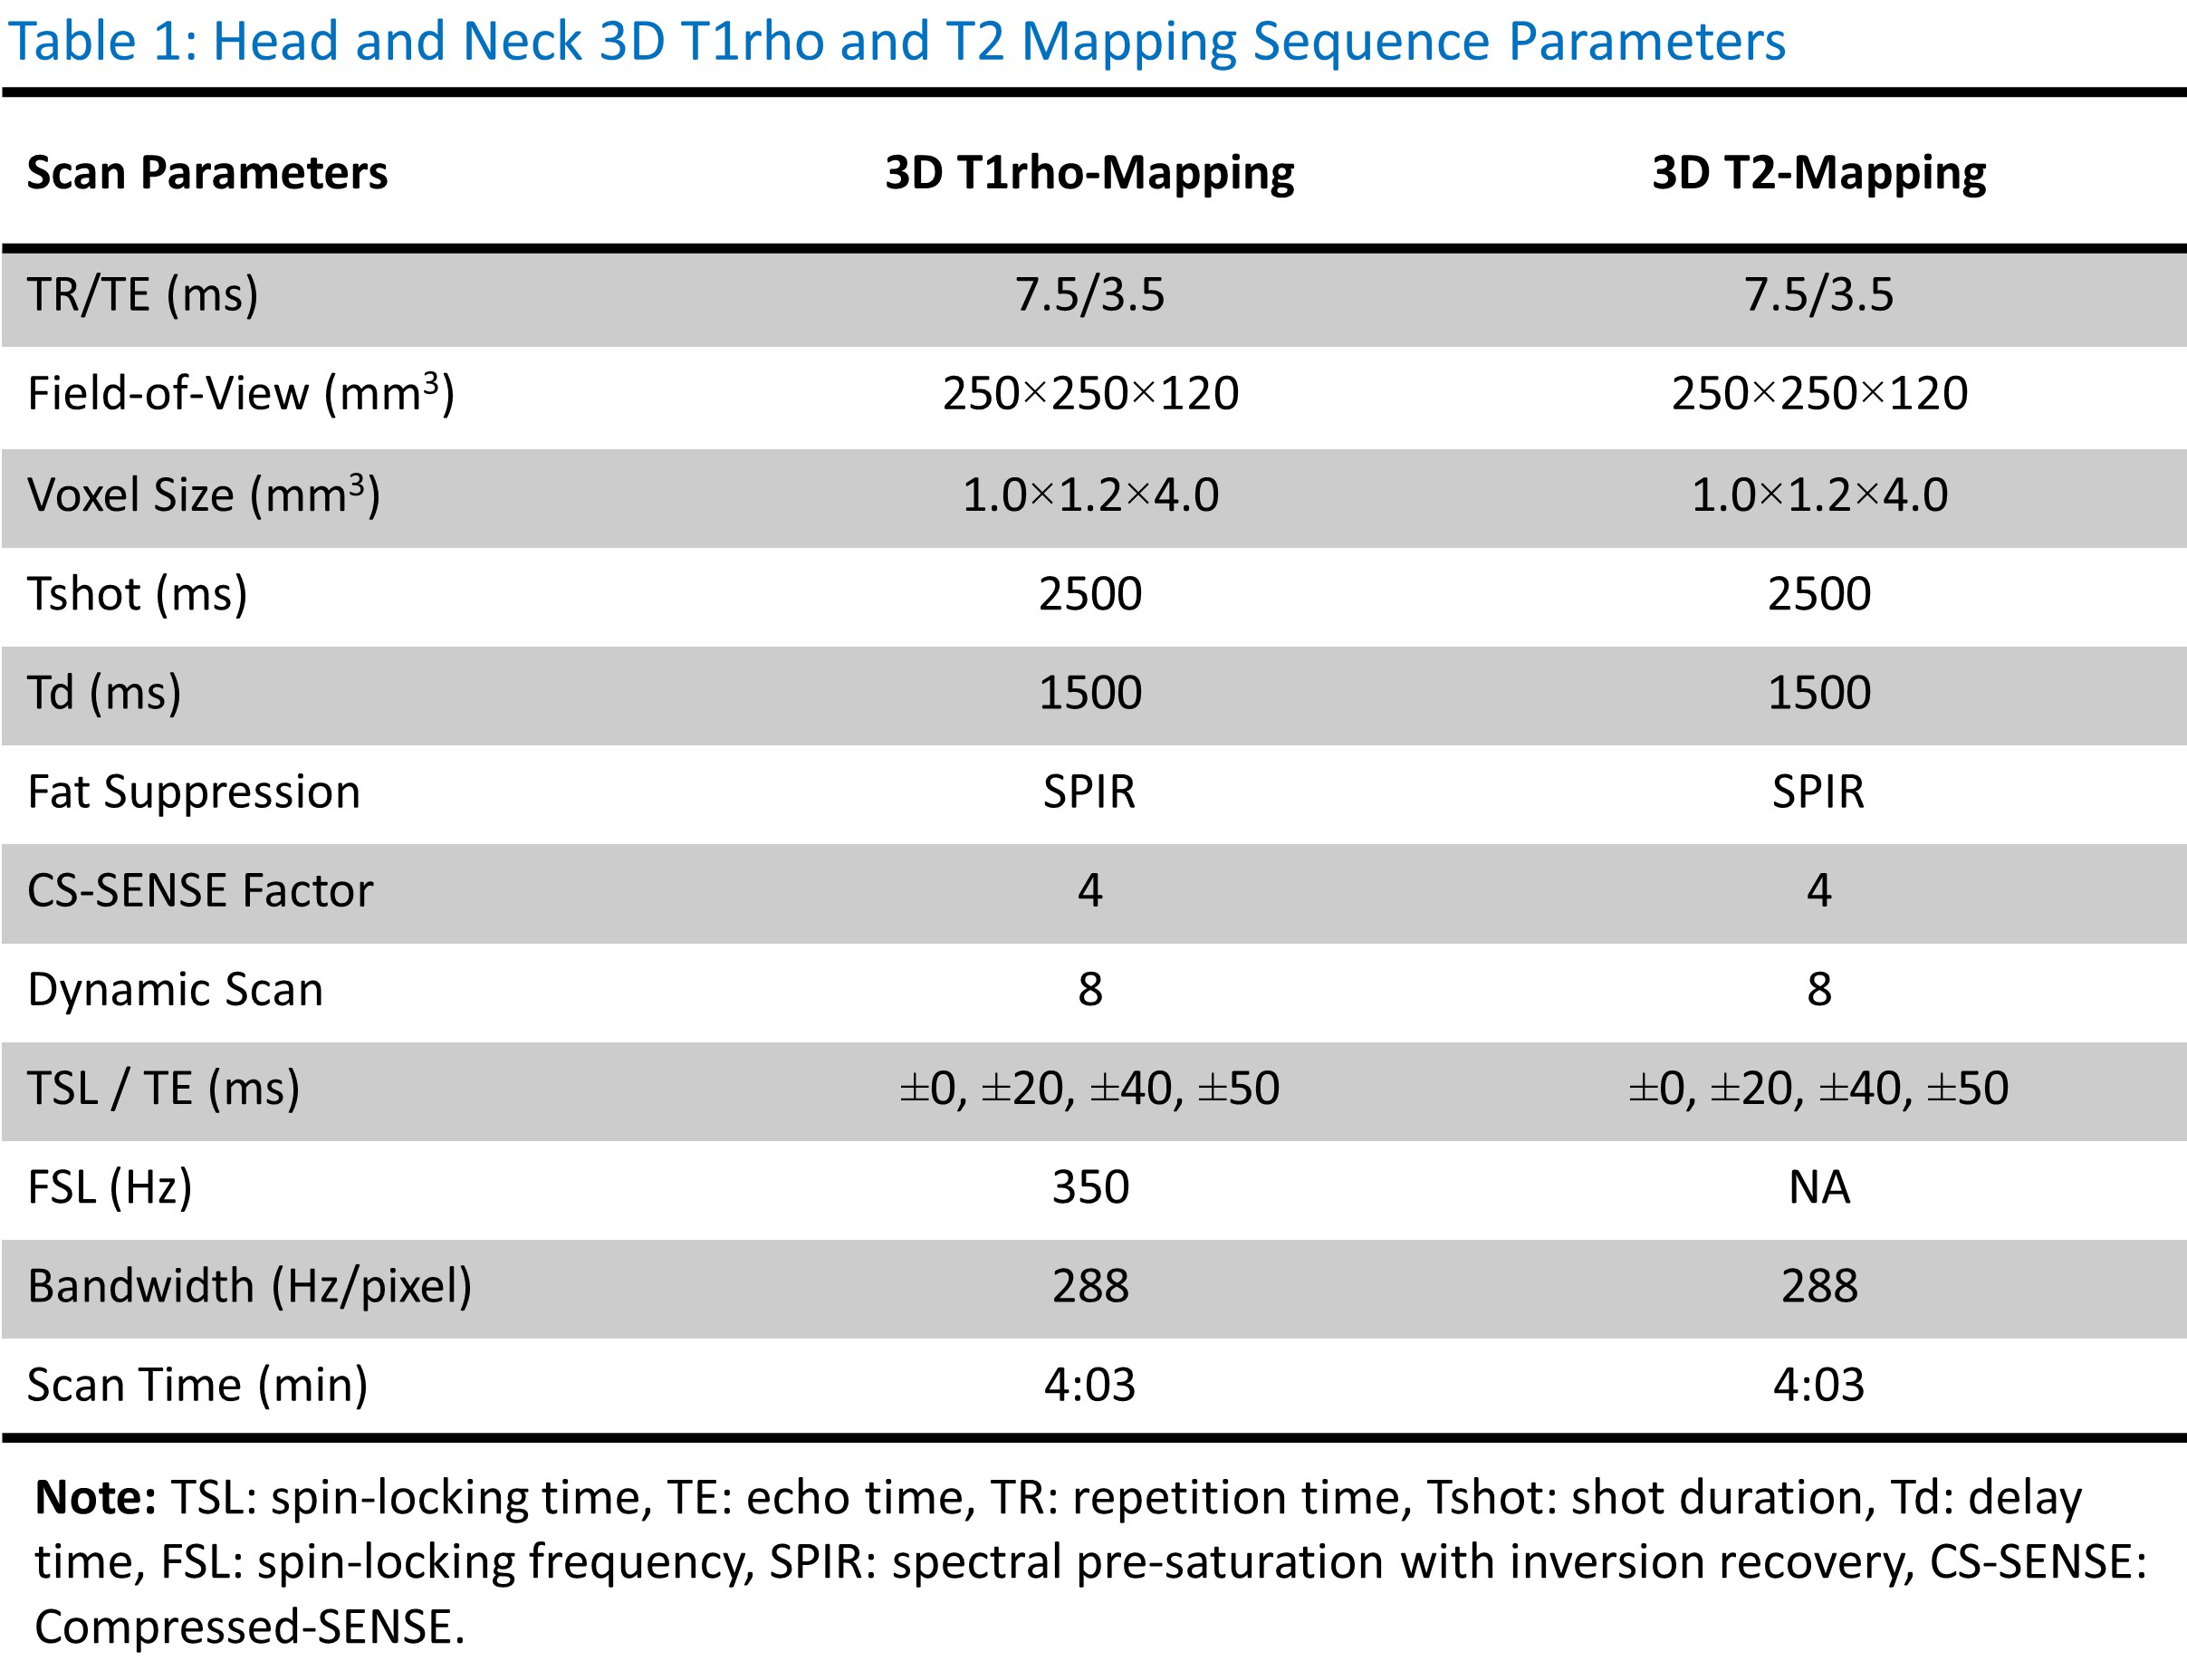
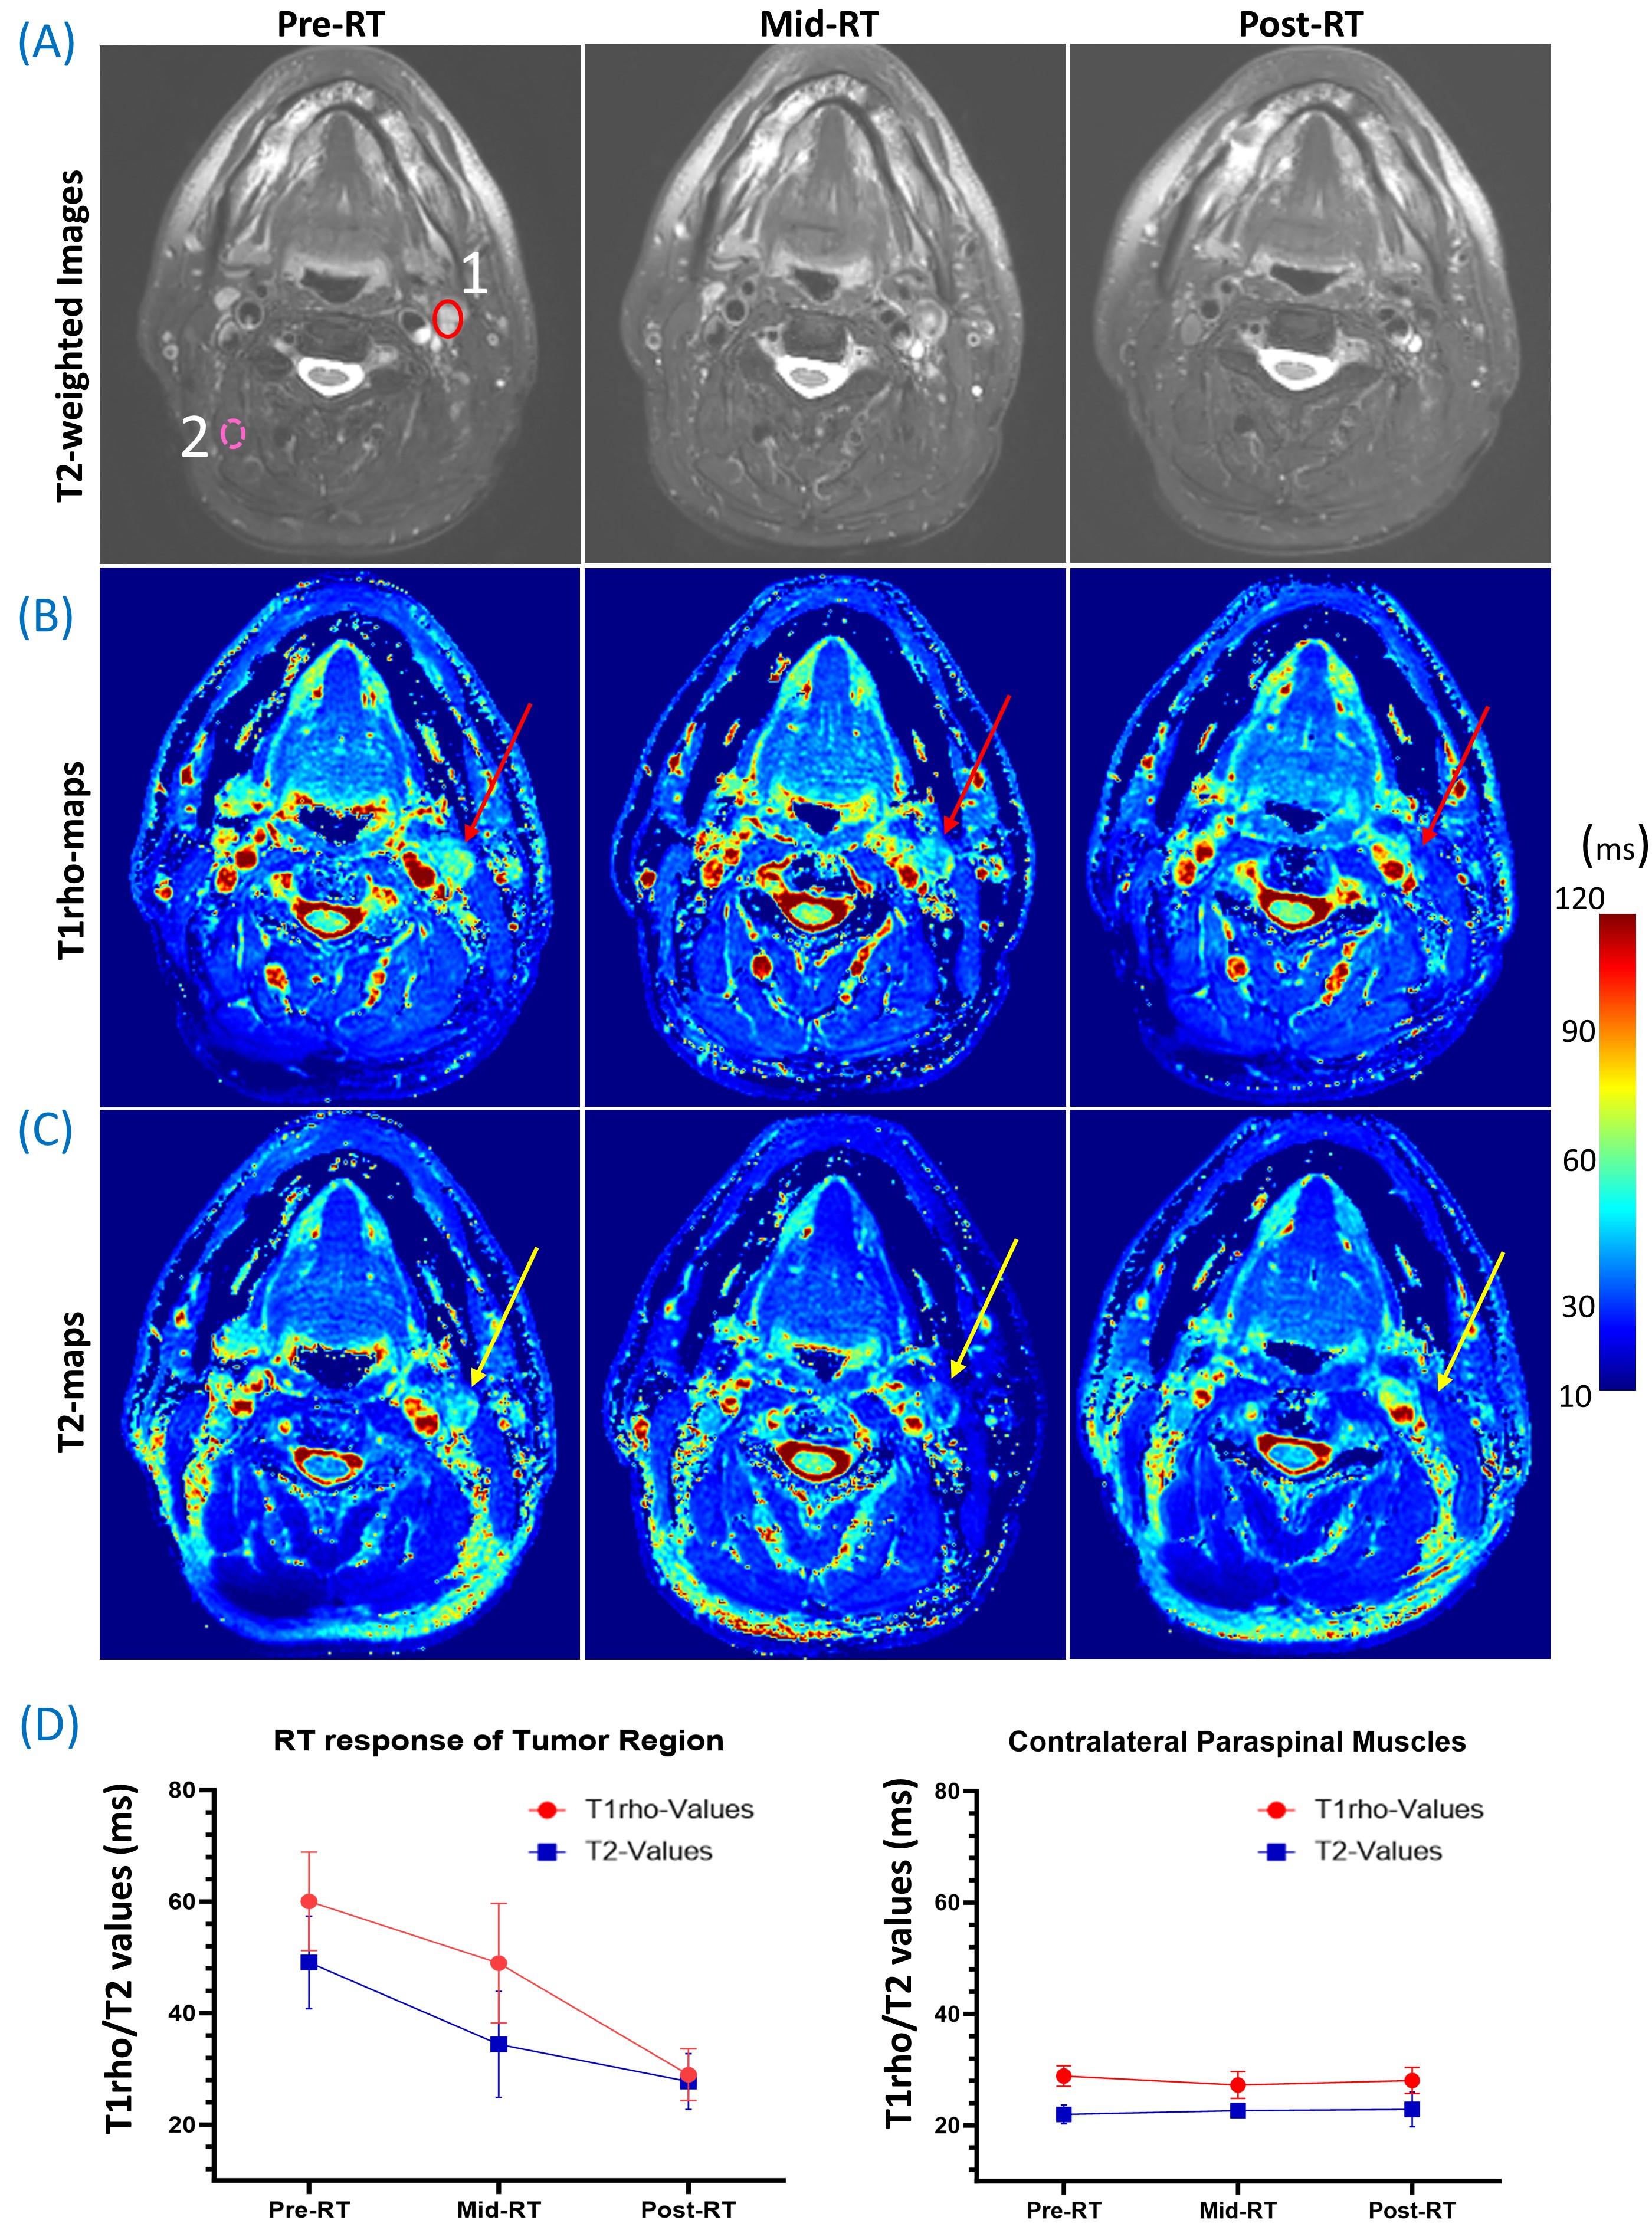
Acquisition parameters for 3D T1rho/T2 scans are presented in Table 1. Prior to the generation of T1rho/T2-map using a mono-exponential signal relaxation model with complex-valued data10, the 3D-volumes were registered using Elastix12. The mean and standard deviation of T1rho/T2-values were measured from regions of interest (ROIs) delineated by a radiologist (AS). ROIs were contoured on the bilateral masseter muscles, parotid gland, and sternocleidomastoid muscles on the volunteer MRI data (Figure 2) and for tumor and contralateral paraspinal muscles on HNC patients’ MRI data (Figures 3 and 4A).
RESULTS
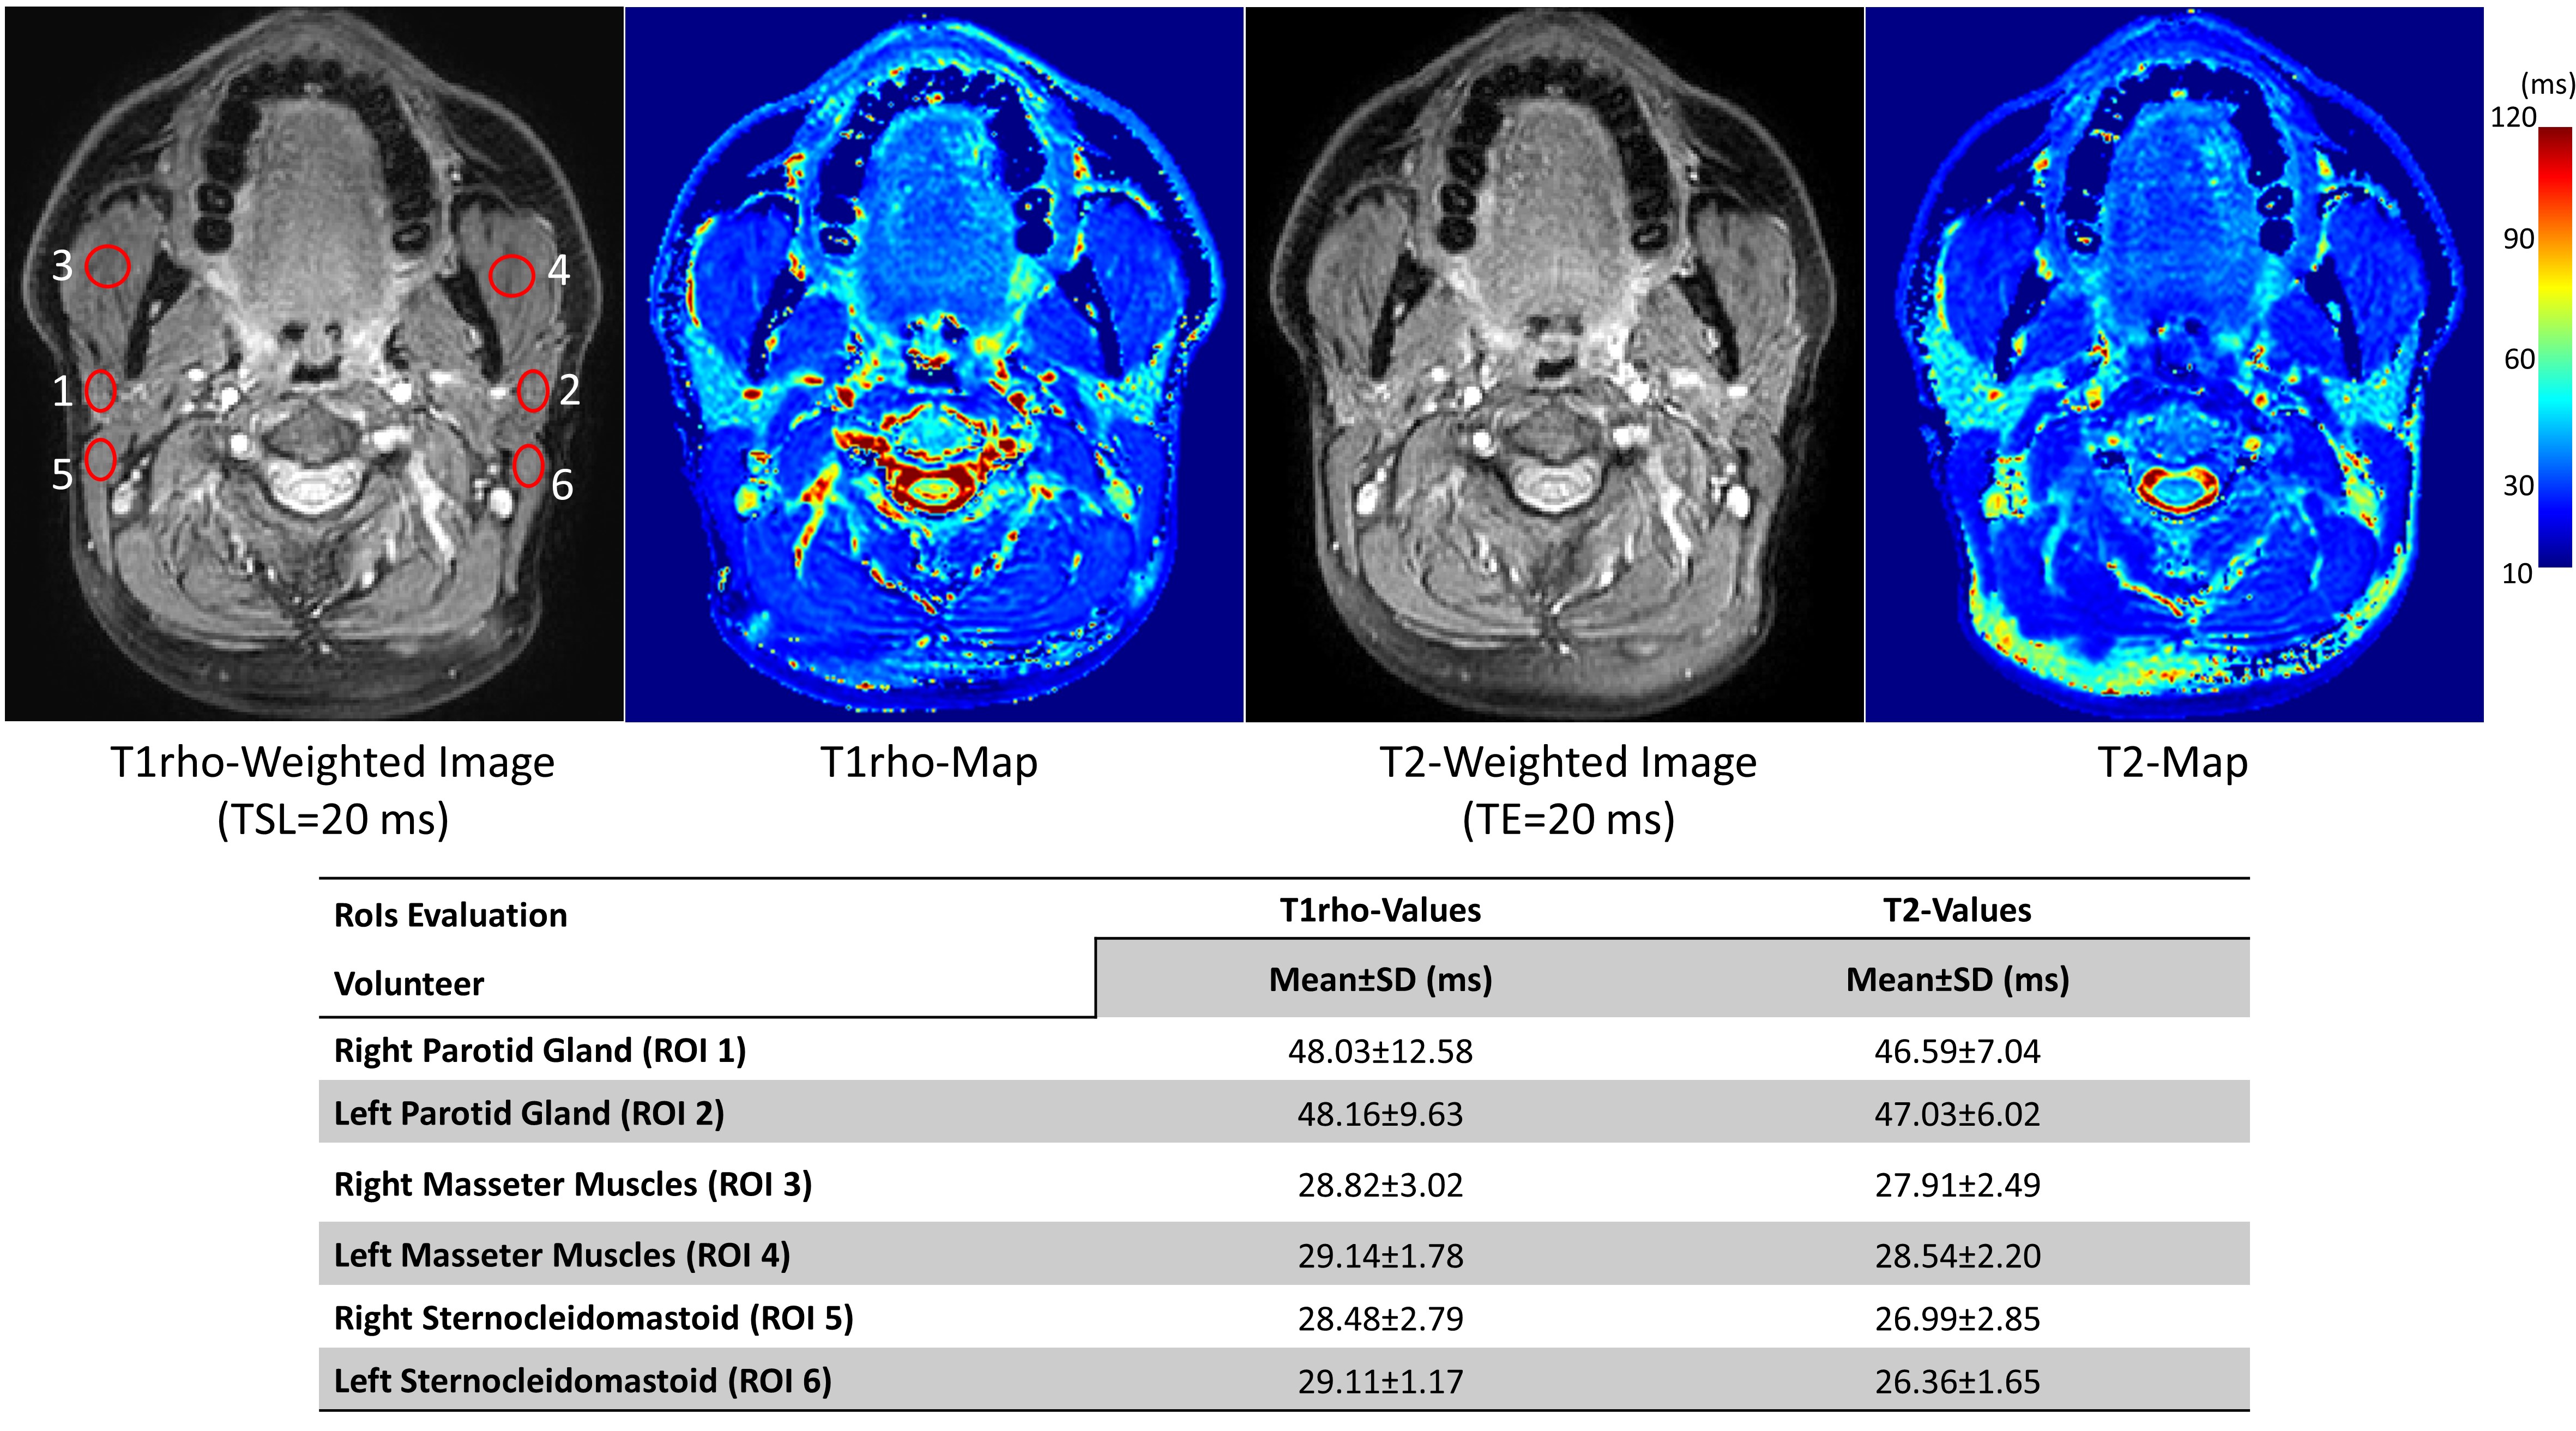
The average T1rho and T2-values in various tissues of the healthy volunteer were as follows: 48.09ms and 46.81ms in the parotid gland, 28.98ms and 28.22ms in the masseter-muscles, and 28.80ms and 26.68ms in the sternocleidomastoid-muscles (Figure 2). It was observed that these values were similar on both sides for all three tissue types.Figure 3 shows the T1rho and T2-maps and quantifications for two patients. Patient-1 has a right metastatic neck lymph node (size: 2.8x2.0cm), while patient-2 has a left metastatic lymph node (size: 5.1x2.6cm). In patient-1, the tumor T1rho and T2-values were 74.16ms and 63.55ms, respectively, while the contralateral paraspinal muscles showed 32.64ms and 27.32ms, respectively. Patient-2 exhibited a similar pattern with tumor T1rho and T2 values of 76.46ms and 70.46ms, and contralateral paraspinal muscles showed 22.92ms and 27.91ms.
The response to RT for a left metastatic lymph node (size: 1.6x1.3cm) in patient-3 is shown in Figure 4. The tumor T1rho and T2-values decreased from Pre-RT (60.06±8.82ms and 49.11±8.30ms) to mid-RT (48.98±10.73ms and 34.45±9.53ms) and further reduced at post-RT (28.98±4.63ms and 27.78±5.03ms), as indicated by the arrows in Figure 4B and Figure 4C. In contrast, the values in the contralateral paraspinal muscles remained relatively stable from pre-RT to post-RT (Figure 4D).
DISCUSSION
T1rho and T2-values in healthy head and neck tissues were consistent, with a <5% difference between the left and right sides. In contrast, tumor ROI values were significantly higher for all patients. Similar changes were observed in the T2-weighted images, but T1rho and T2-mapping provide quantitative measurements that may enable the evaluation of tumor progression and help guide treatment planning. Moreover, tumor T1rho and T2-values consistently decreased from pre-RT to post-RT, suggesting the potential in assessing treatment response. Future studies will include a larger number of patients and multiple time points to investigate further the ability of T1rho and T2-mapping in detecting early response to RT. It would also be valuable to explore the correlation of these parameters with those obtained from DWI and DCE-MRI.CONCLUSION
This work demonstrates the ability of T1rho and T2-mapping to effectively measure early treatment response in patients with HNC following radiotherapy.Acknowledgements
The work was supported by NIH Grant R01-AR076328.References
- Chaturvedi AK, Engels EA, Pfeiffer RM, et al. Human papillomavirus and rising oropharyngeal cancer incidence in the United States. J Clin Oncol. 2023;41(17):3081-3088.
- Kang JJ, Yu Y, Chen L, et al. Consensuses, controversies, and future directions in treatment deintensification for human papillomavirus-associated oropharyngeal cancer. CA Cancer J Clin. 2023;73(2)
- Jansen JF, Parra C, Lu Y, et al. Evaluation of head and neck tumors with functional MR imaging. Magn Reson Imaging Clin N Am. 2016;24(1):123-133
- Ai QYH, Chen W, So TY, et al. Quantitative T1ρ MRI of the Head and Neck Discriminates Carcinoma and Benign Hyperplasia in the Nasopharynx. AJNR Am J Neuroradiol. 2020;41(12):2339-2344
- Gröhn OH, Valonen PK, Lehtimäki KK, Väisänen TH, Kettunen MI, Ylä-Herttuala S, Kauppinen RA, Garwood M. Novel magnetic resonance imaging contrasts for monitoring response to gene therapy in rat glioma. Cancer Res. 2003;63(22):7571-4
- Duvvuri U, Poptani H, Feldman M, Nadal-Desbarats L, Gee MS, Lee WM, Reddy R, Leigh JS, Glickson JD. Quantitative T1rho magnetic resonance imaging of RIF-1 tumors in vivo: detection of early response to cyclophosphamide therapy. Cancer Res. 2001 Nov;61(21):7747-53
- Hubenak JR, Zhang Q, Branch CD, et al. Mechanisms of injury to normal tissue after radiotherapy: a review. Plast Reconstr Surg. 2014;133(1):49e-56e.
- Witschey II WR, Borthakur A, Elliott MA, et al. Artifacts in T1ρ-weighted imaging: Compensation for B1 and B0 field imperfections. J Magn Reson 2007; 186(1), 75-85.
- Levitt M, Freeman R, Frenkiel T. Broadband heteronuclear decoupling. J Magn Reson 1969;47(2):328-330
- Peng Q, Wu C, Kim J, et al. Efficient phase-cycling strategy for high-resolution 3D gradient-echo quantitative parameter mapping. NMR in Biomed 2022;35(7):e4700
- Peng G, Wu C, Peng Q. Improved phase-cycling preparations in quantitative T1rho mapping. Proc Intl Soc Mag Reson Med 2022; (30): 4063
- Klein S, Staring M, Murphy K, et al. Elastix: a toolbox for intensity-based medical image registration. IEEE transactions on medical imaging. 2009;29(1):196-205.(https://elastix.lumc.nl/)
Figures