1932
Reproducibility of GABA and Glx measurements in the midbrain and basal ganglia using MEGA-PRESS1Department of Radiology, Ruijin Hospital, Shanghai Jiao Tong University School of Medicine, Shanghai, China, 2Faculty of Medical Imaging Technology, College of Health Science and Technology, Shanghai Jiao Tong University School of Medicine, Shanghai, China, 3Philips Healthcare, Shanghai, China
Synopsis
Keywords: Neurotransmission, Spectroscopy, GABA, Glx
Motivation: Reproducibility is critical in longitudinal studies to monitor subtle alterations of GABA and Glx concentration in neurodegenerative disorders.
Goal(s): To evaluate the reproducibility of GABA and Glx measurements of the midbrain and basal ganglia regions in healthy subjects.
Approach: The MEGA-PRESS sequence was scanned twice with a two-week gap for each subject to obtain the GABA and Glx level in the left basal ganglia and bilateral midbrain. The reproducibility was evaluated.
Results: We observed good agreement between two scans for the GABA and Glx quantification based on the Bland-Altman analysis.
Impact: The reproducibility analysis of GABA and Glx measurements in the basal ganglia and midbrain regions are needed for the follow-up studies. The preliminary results informed that applying 1H-MRS to investigate the progression of GABA and Glx levels is applicable.
Introduction
γ-aminobutyric acid (GABA) and the glutamate-glutamine complex (Glx) are the primary inhibitory and excitatory neurotransmitters in the central nervous system, respectively, and their imbalance is implicated in neurodegenerative and neuropsychiatric disorders1. In vivo measurements of GABA and Glx are prone to be affected by many factors, therefore, to investigate their alterations in the progress of diseases, it is essential to validate the reproducibility of GABA and Glx measurements in healthy populations. In the current study, aimed to evaluate the reproducibility of GABA and Glx measurements, we take advantage of proton magnetic resonance spectroscopy (1H-MRS) with spectral editing technique MEscher-Garwood Point RESolved Spectroscopy (MEGA-PRESS)2 to access the concentration of GABA and Glx in the basal ganglia and midbrain regions in the same group of healthy individuals in different period.Methods
This study was approved by the local ethics committee (No: KY2022-266) and written informed consent was obtained from all participants. 23 young healthy individuals were enrolled and underwent the first scan, among them 16 subjects underwent the second scan after 2 weeks.All scan was conducted on a 3.0 T scanner (Elition X, Philips Healthcare) with a 32-channel head coil. A transverse T1-weighted sequence was scanned to produce the anatomical reference images. Detailed imaging parameters were: field-of-view = 256×192×150 mm3; acquired voxel size = 0.67×1.00×1.34 mm3; reconstructed voxel size = 0.67×0.67×1.34 mm3; repetition time/echo time = 27/4.7 ms; pixel bandwidth = 362 Hz. The acquired images were reconstructed to coronal and sagittal planes for MRS localization. Two volumes of interest (VOIs) were placed on the basal ganglia and midbrain regions to acquire the spectral-edited data, respectively. Detailed parameters were VOI = 30 ×30 ×30 mm3 (basal ganglia) or 25×35×30 mm3 (midbrain); TR/TE = 2000/130 ms; spectral bandwidth = 2000 Hz; readout duration = 512 ms; edit on/off frequency = 1.89/7.46 ppm, 9 dynamics with 16 signal average each.
Spectral-edited data were processed using the GANNET 3.1 version to get the GABA, Glx and Cr concentration3. Fit error larger than 15% was considered unreliable and excluded. Visual inspection of the remaining edited spectrum was done to confirm the correctness of the result. The final relative quantification results were expressed as the ratio of GABA/Cr and Glx/Cr.
A paired t-test was applied to compare the longitudinal changes in GABA and Glx level. P values < 0.05 were considered statistically significant. The range of agreement between two scans was visualized with Bland–Altman plots4. Results were given as mean ± SD. The statistical analysis was performed using IBM SPSS Statistics (version 24; IBM Corp., Armonk, NY).
Results
Based on the spectral quality inspection, 5.1% (2/39) of the MRS data from basal ganglia and 23% (9/39) of the MRS data from the midbrain were excluded. The demographic and the available MRS features of the participants are shown in Table 1.The spectra with fitting error < 15% for the basal ganglia and midbrain are shown in Figure 1. According to the Bland-Altman plot analysis (Figure 2), all data points for GABA and Glx level in the midbrain and Glx level in the basal ganglia were located within the limit of agreement, and 2/14 data points for GABA level in the basal ganglia region fall outside the 95% confidence region (bias±1.96 SD). Although, the group levels showed no statistical differences (Table 2), the GABA and Glx levels of two scans in intra-subjects are fluctuating (Figure 3).
Discussion and Conclusion
The reproducibility of GABA and Glx measurements in vivo in the midbrain and basal ganglia regions is essential which is beneficial to the longitudinal study in neurodegenerative and neuropsychiatric disorders. The preliminary results demonstrated that applying 1H-MRS to investigate the progression of GABA and Glx level in vivo is applicable. Fluctuations of GABA and Glx levels could be seen for each subject, this could be a result of many factors: e.g. female menstrual cycle, circadian rhythm, or insomnia5. Cares should be taken for the choice of scanning time. The exclusion ratio for the midbrain is higher than the basal ganglia region. Vascular pulsation, and field inhomogeneity could be the potential confounding factor for the GABA quantification6, which could be improved by careful positioning to avoid vessels and air-tissue interfaces.In conclusion, the reproducibility of GABA and Glx measurements is beneficial to the longitudinal study in neurodegenerative and neuropsychiatric disorders, the preliminary results informed that applying 1H-MRS to investigate the progression of GABA and Glx levels in vivo is applicable.
Acknowledgements
This work was supported, in part, by the National Natural Science Foundation of China (grant number: 82271954, 81971576); Chinese National Science & Technology Pillar Program (grant number: 2022YFC2009900/2022YFC2009905) and the Innovative Research Team of High-level Local Universities in Shanghai.References
Figures
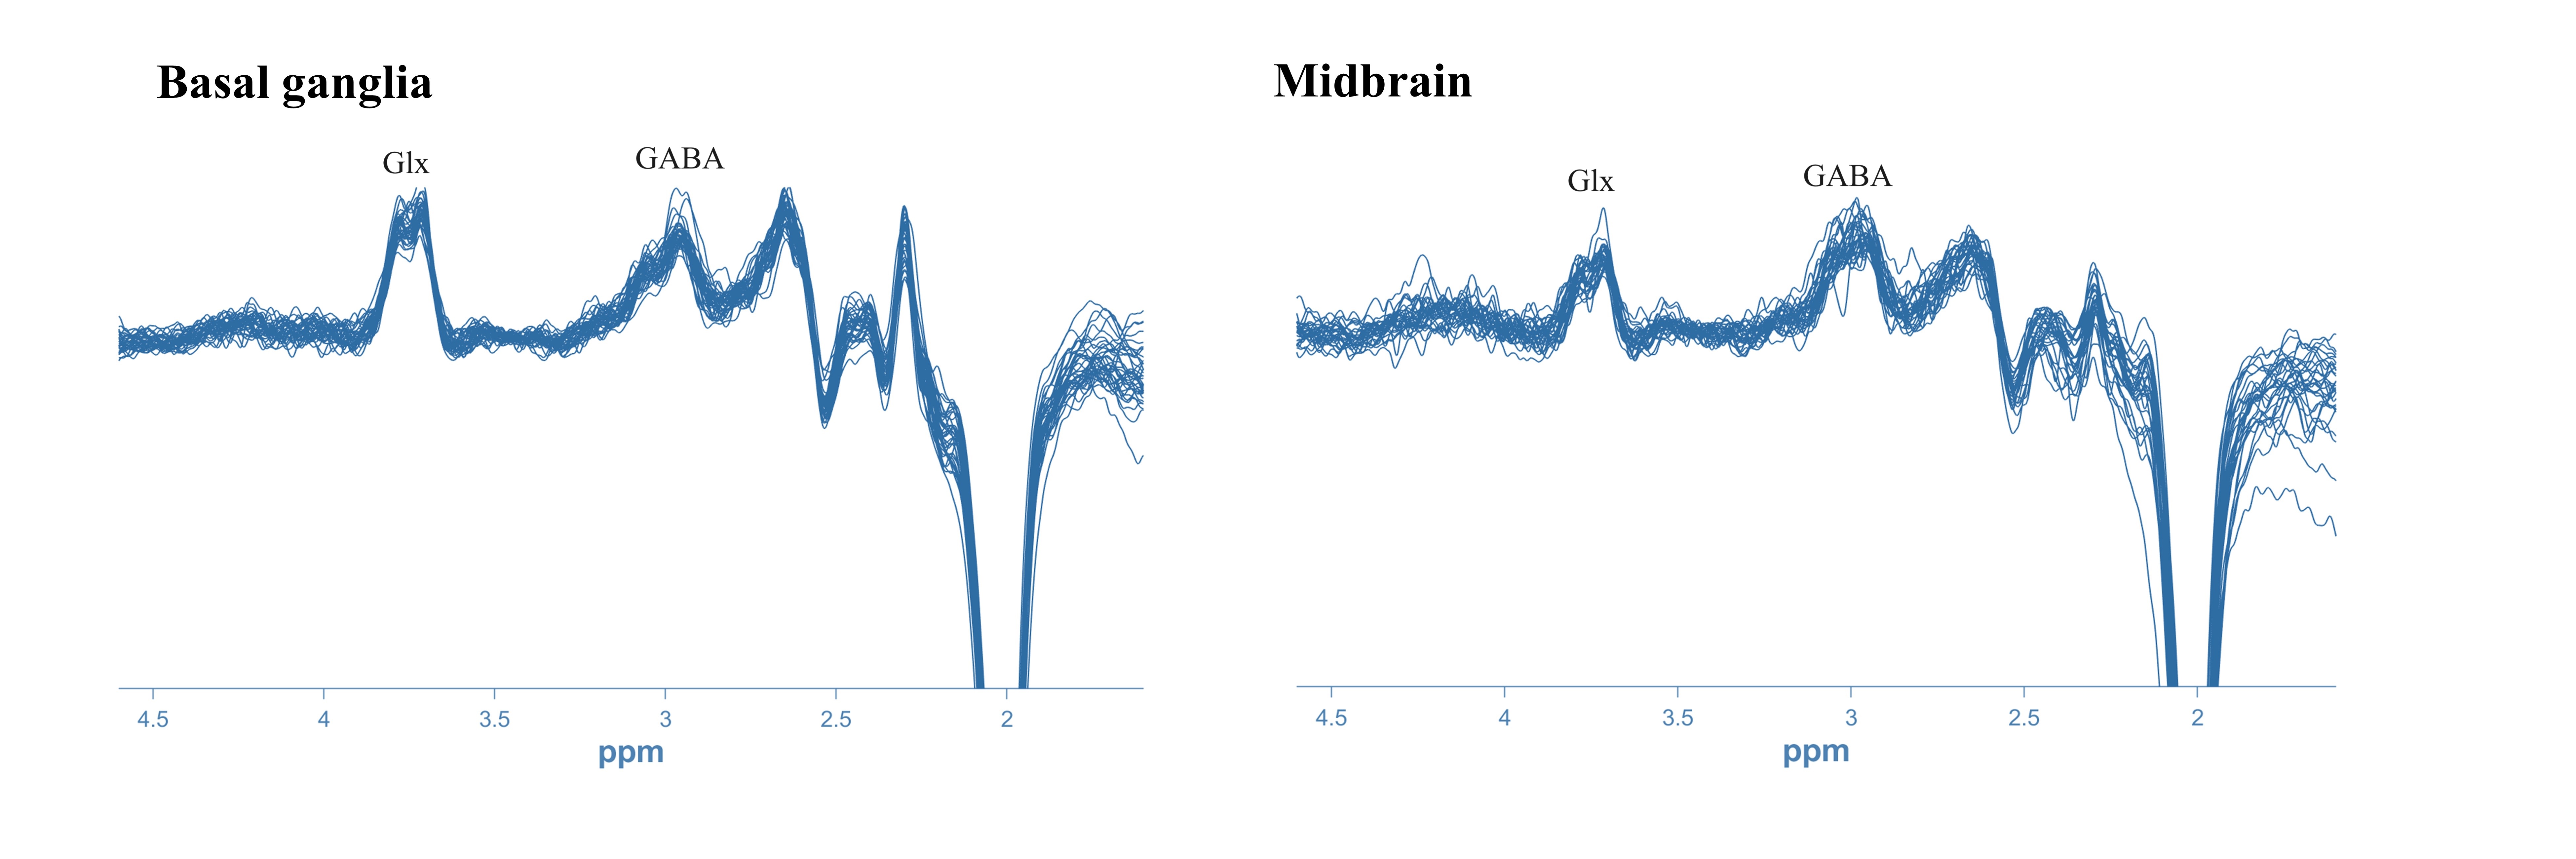
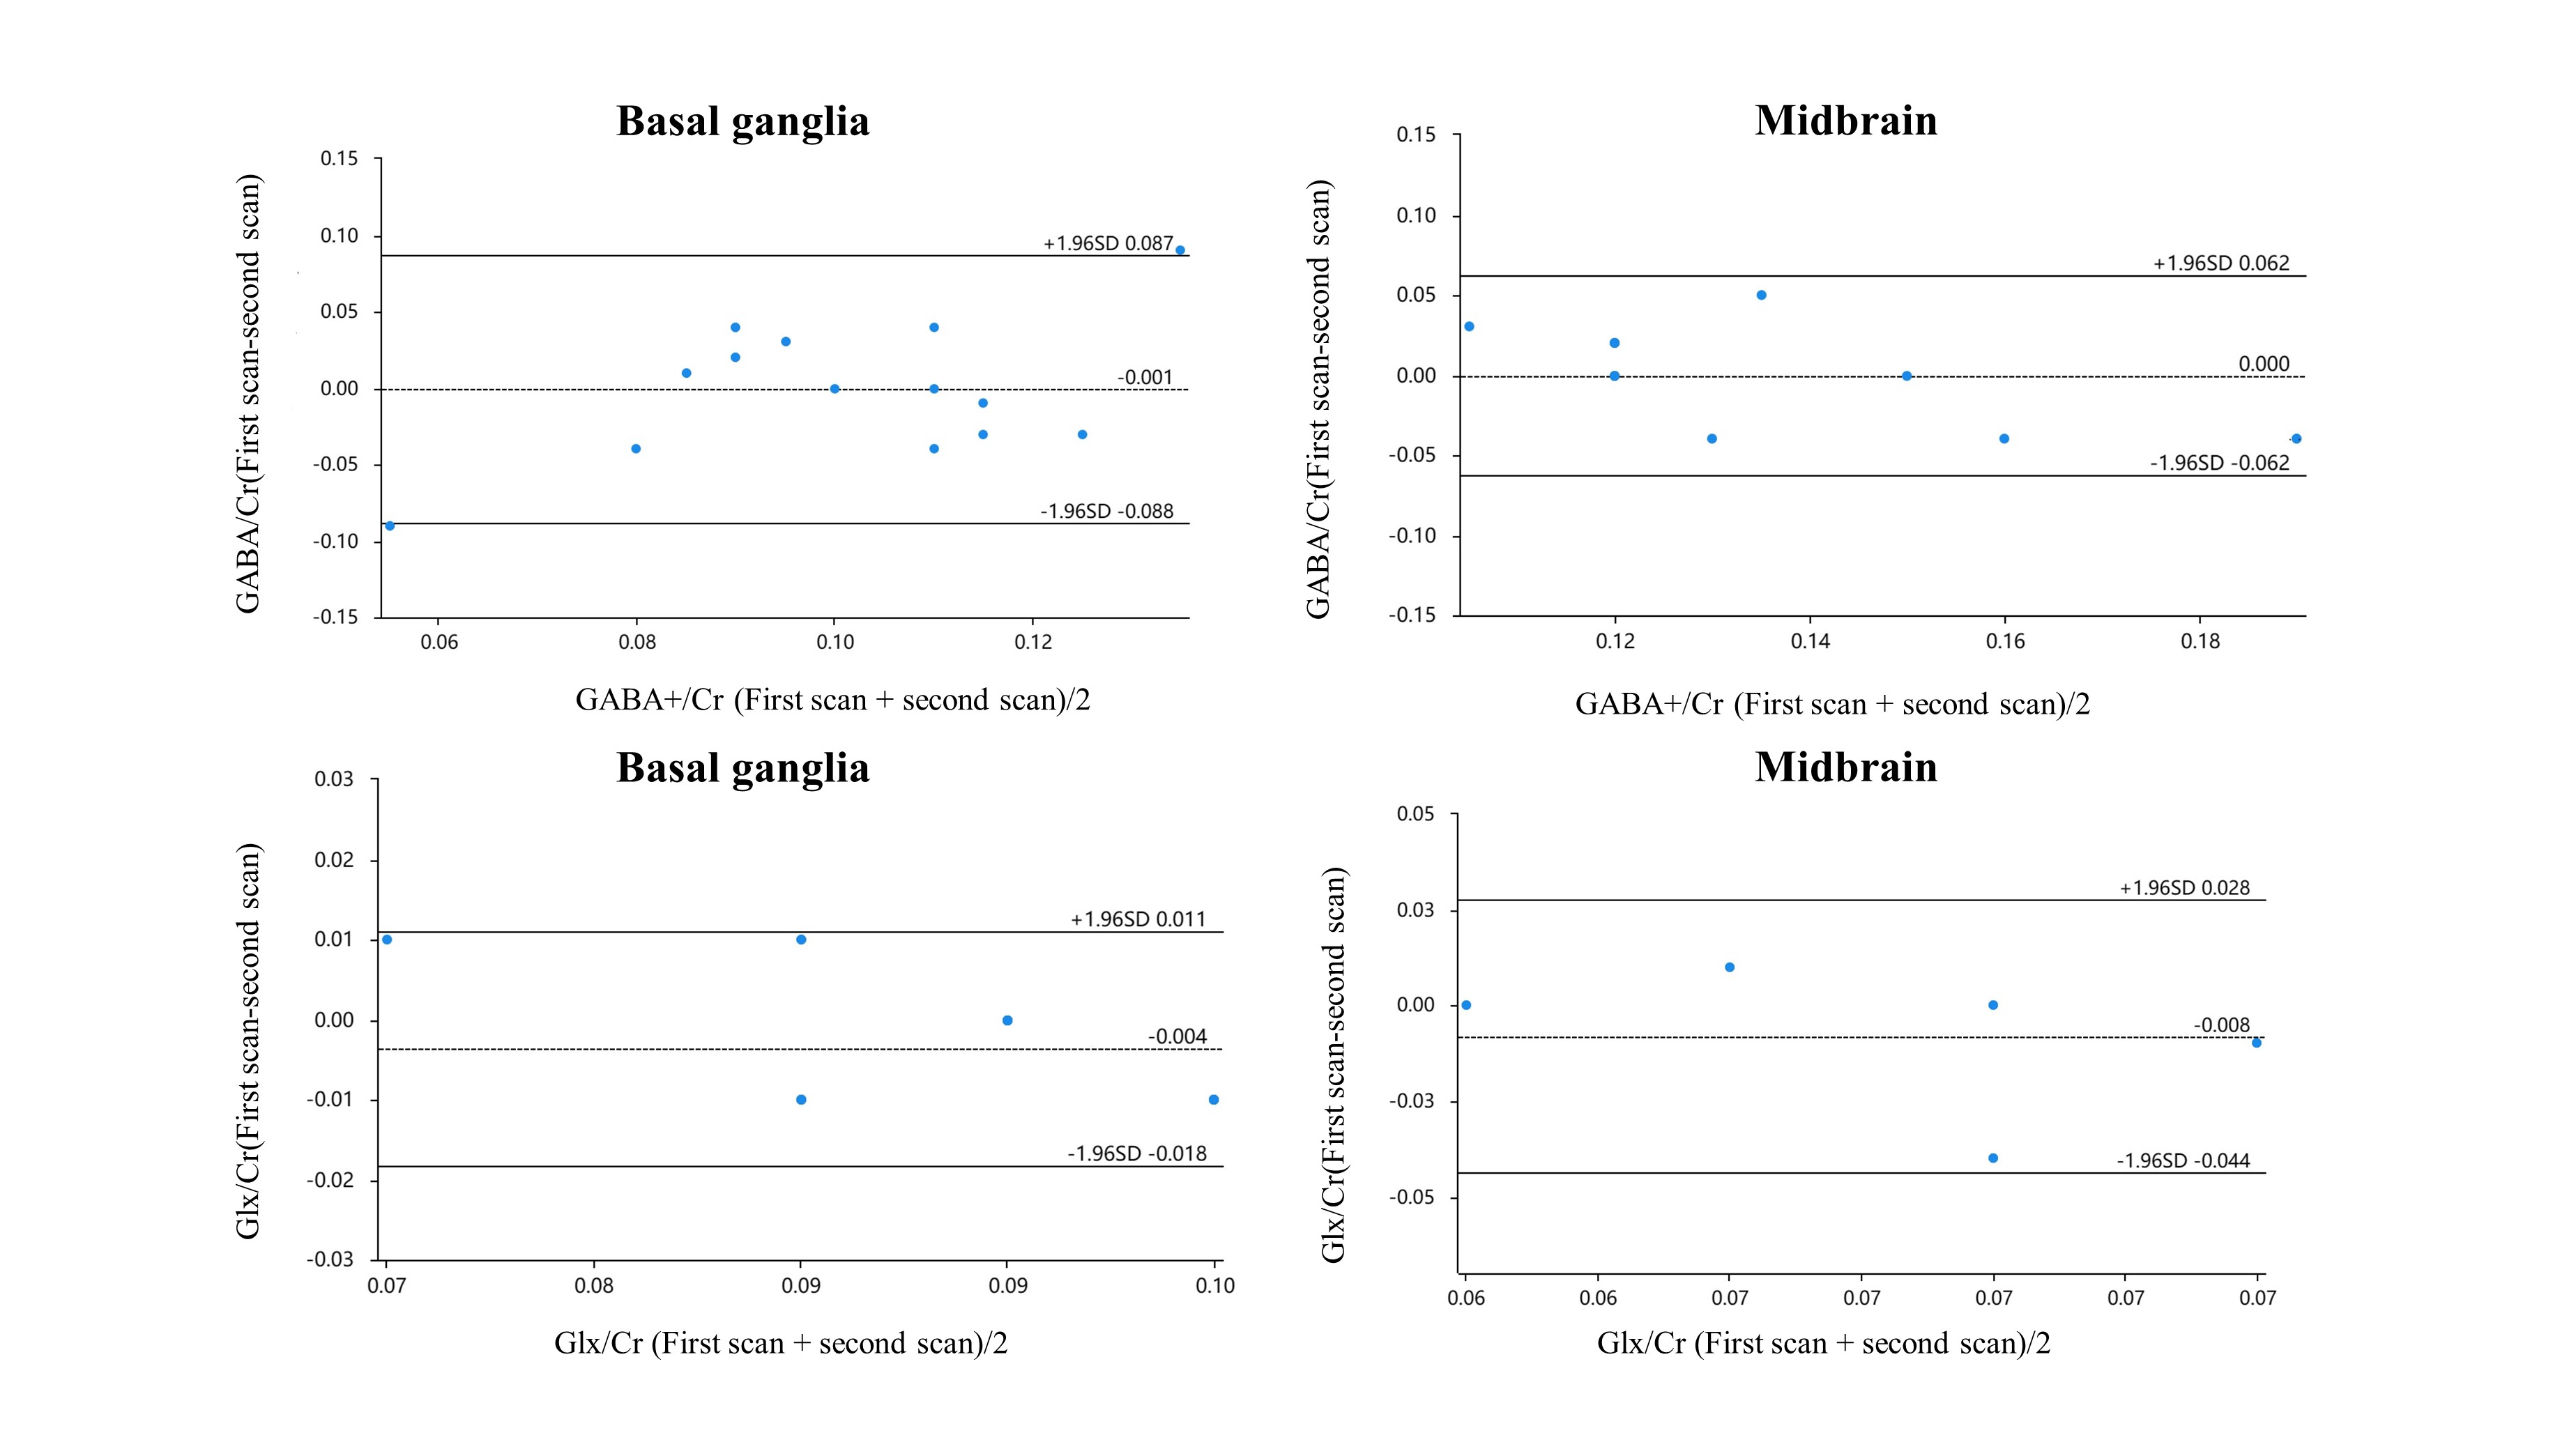
Figure 2. Bland-Altman plots show agreement between the repetitive two scans. Dash lines represent the mean difference between two methods of measurement (bias). The 95% confidence interval (bias±1.96SD) was also marked by solid lines.
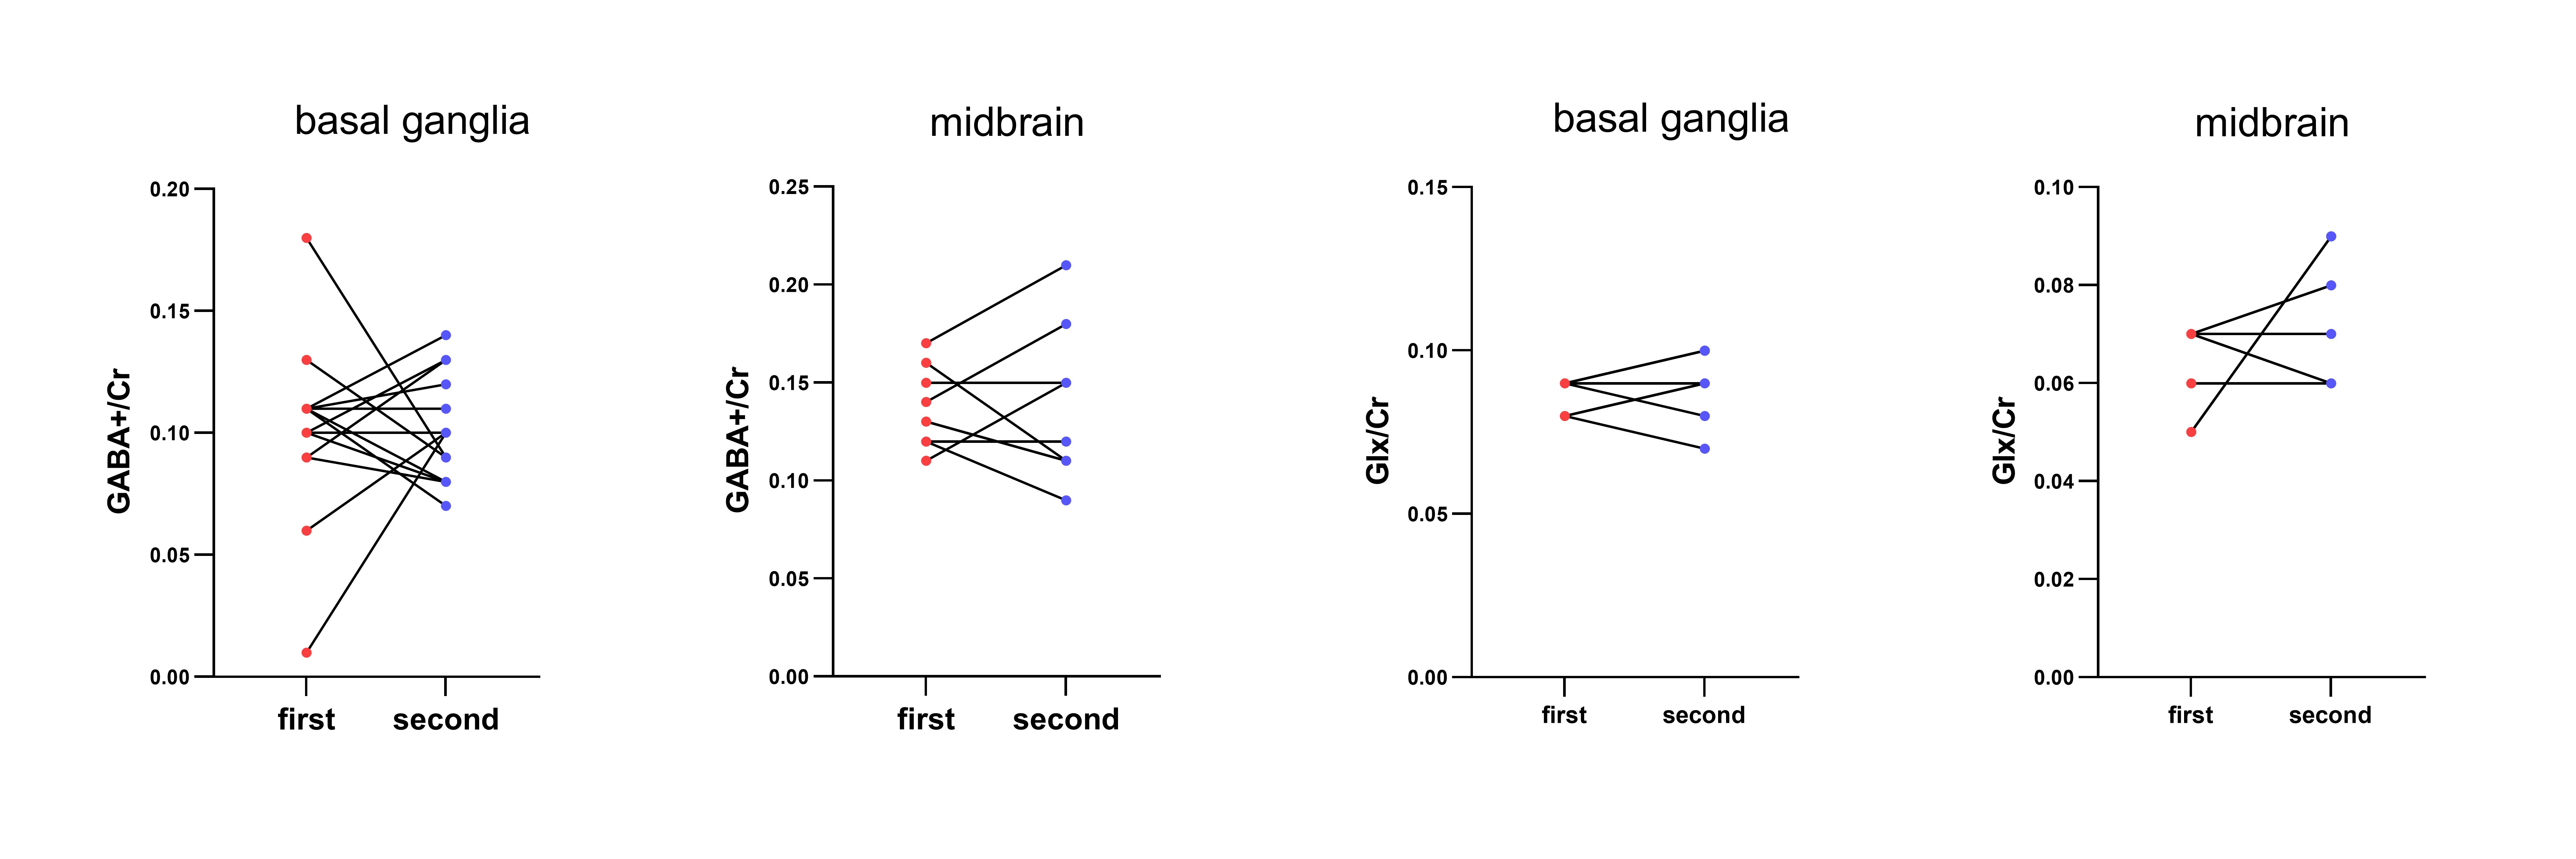
Figure 3. Changes of intra-subjects GABA/Cr and Glx/Cr in the basal ganglia and midbrain region after 2 weeks.
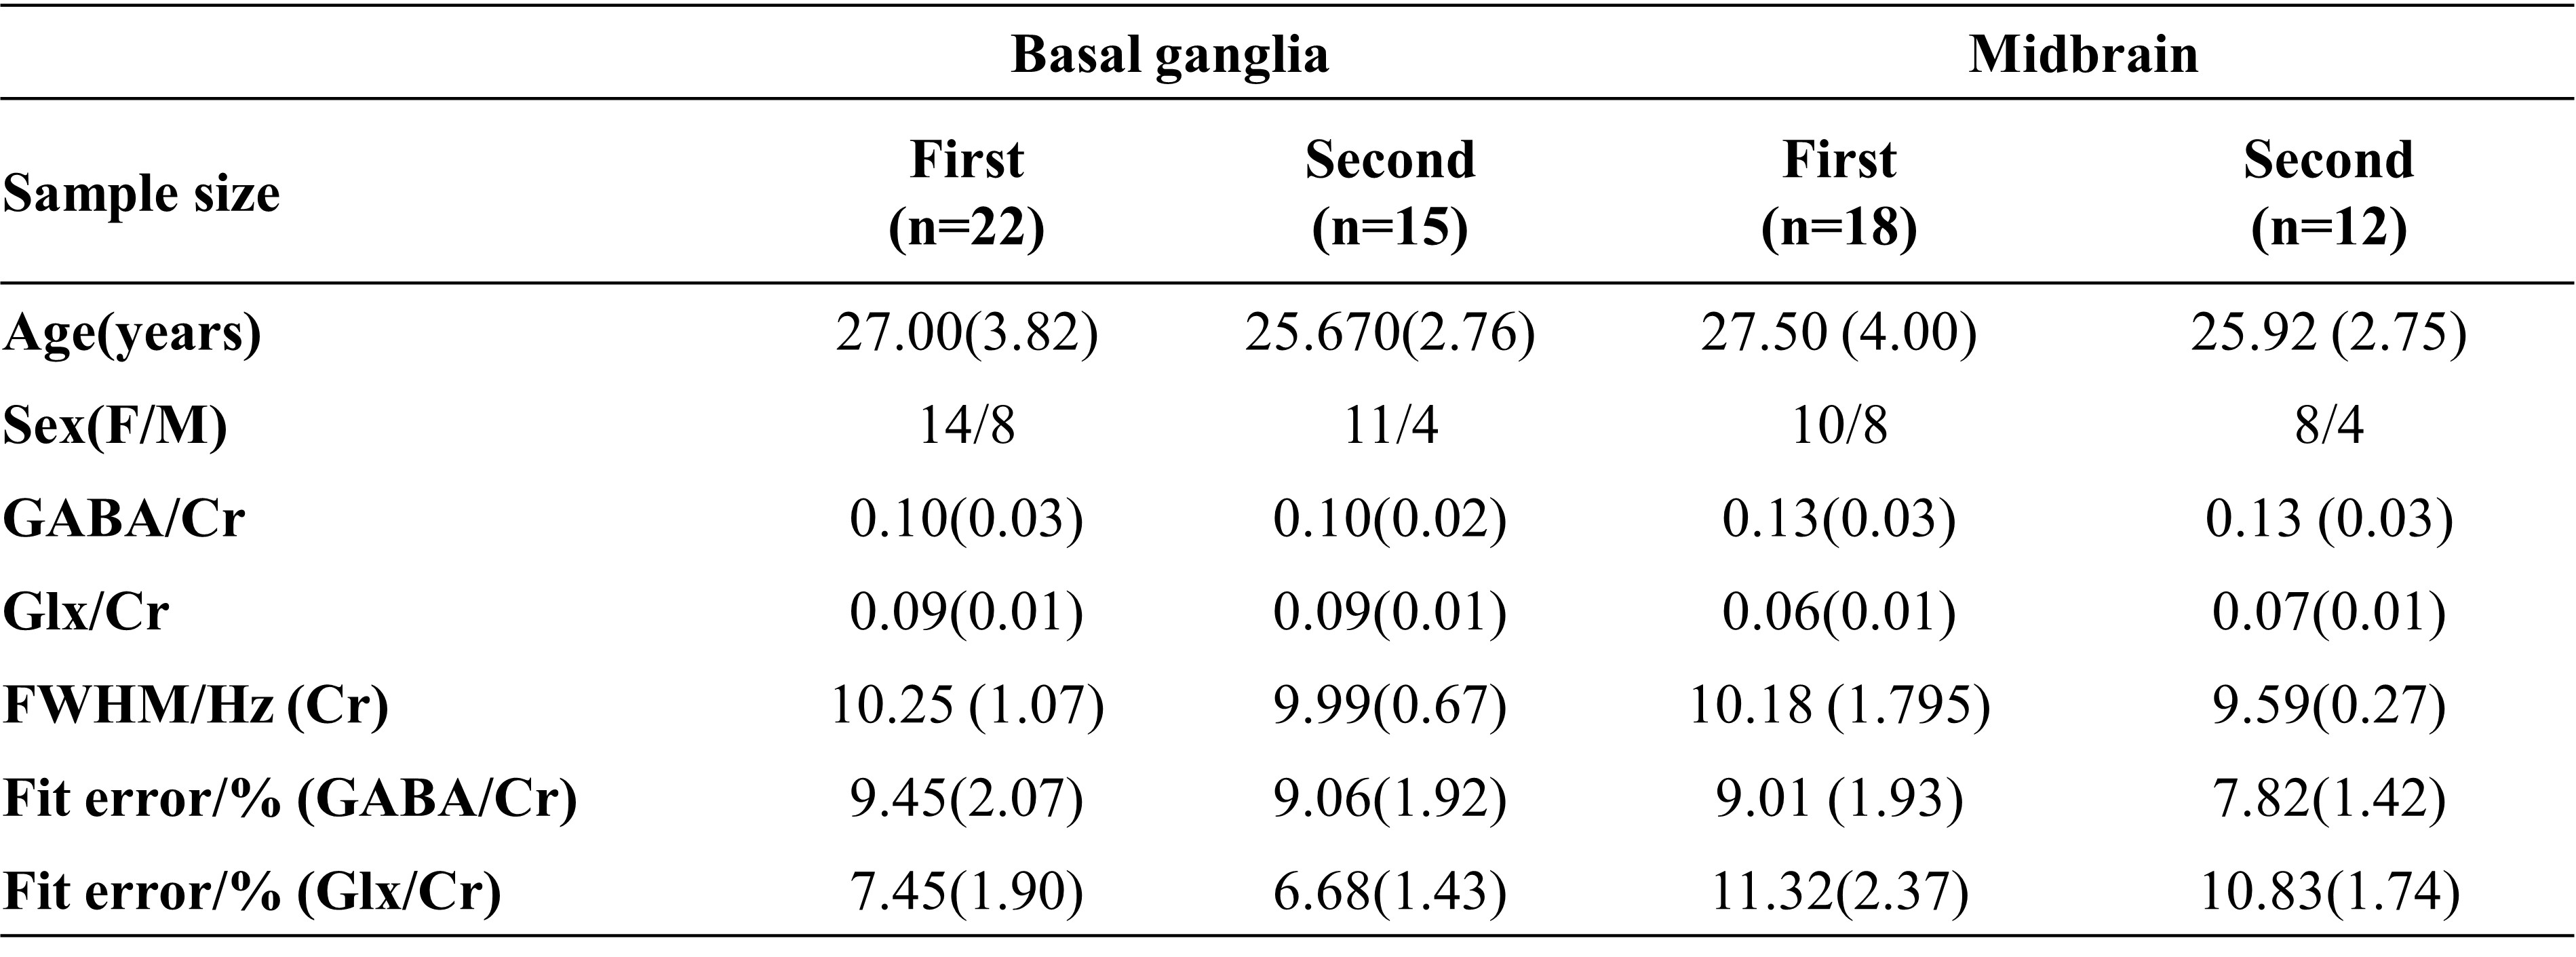
Table 1. The demographic and imaging features of the participants.
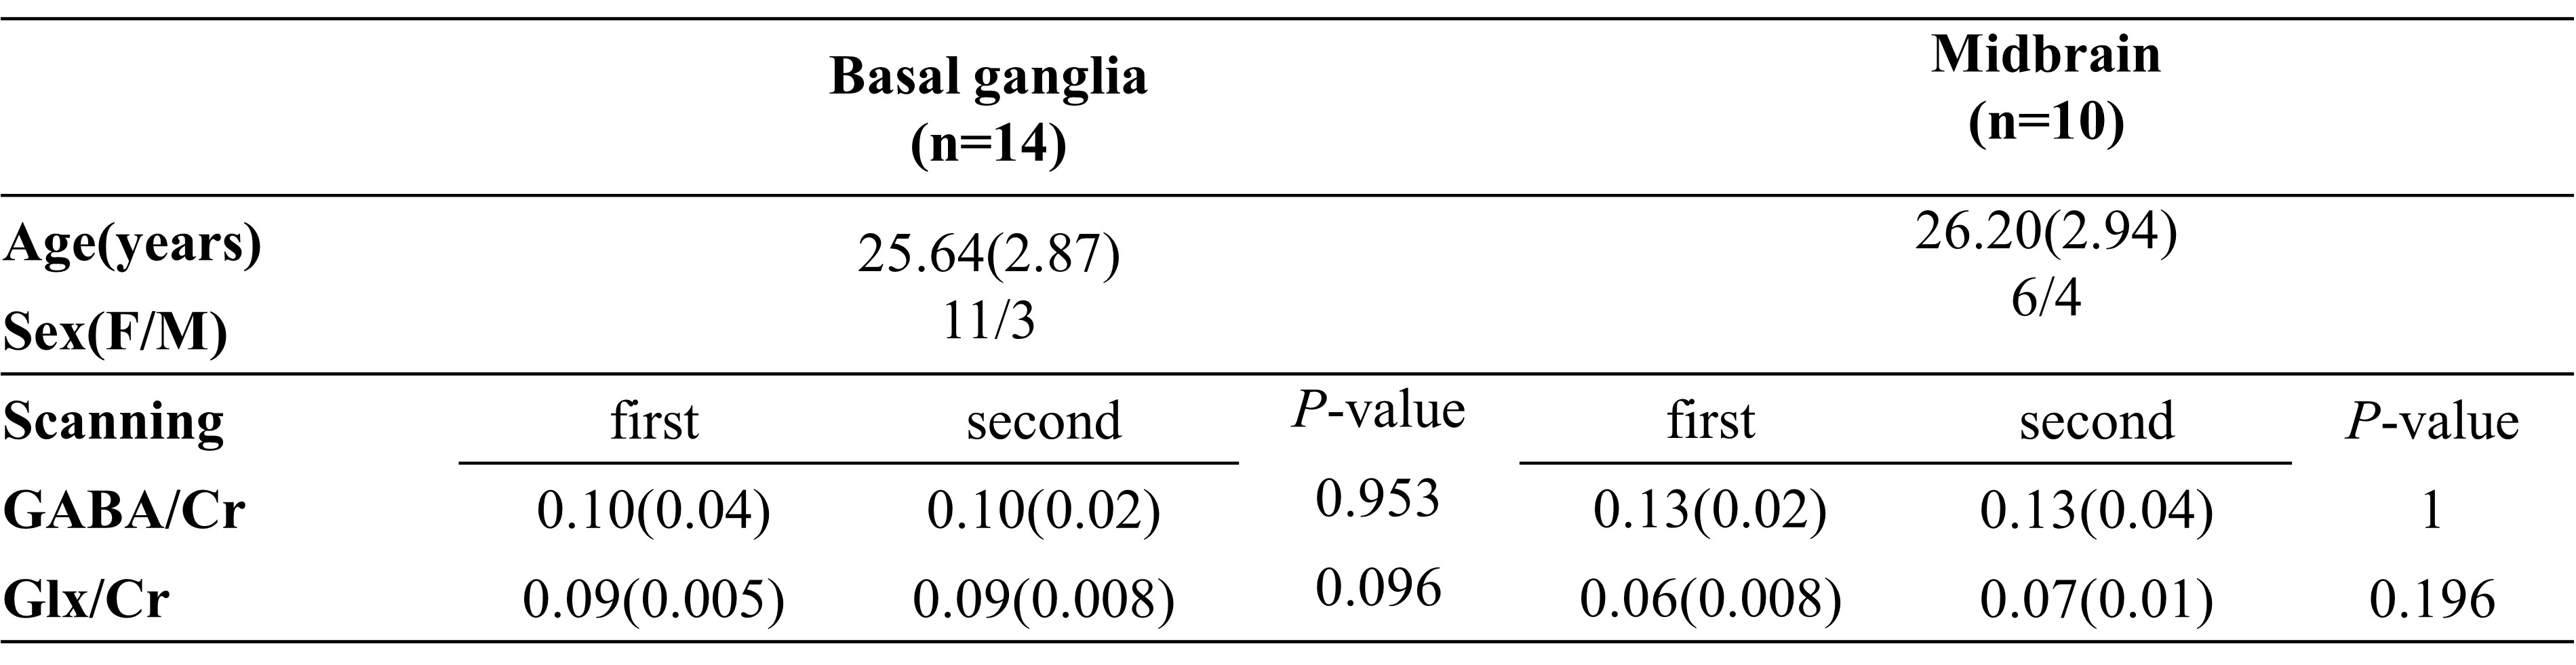
Table 2. The results of two scans in basal ganglia and midbrain regions.