1931
Alteration of intracerebral metabolites and subjective sleepiness by acute caffeine administration in adults.1Basic Medical Sciences, Xiamen University, Xiamen, China, 2Radiology, The Second Affiliated Hospital of Xiamen Medical College, Xiamen, China, 3Medical Imaging, Shantou University, Shantou, China, 4MR Research, GE Healthcare, Beijing, China, 5Morphological Experiment, Yanbian University, Yanji, China, 6Pediatrics, Yanbian University, Yanji, China
Synopsis
Keywords: Head & Neck/ENT, Metabolism, coffee, MEGA-PRESS, GABA, MRS, sleepiness
Motivation: The effects of acute caffeine intake on brain metabolite levels remain largely unknown.
Goal(s): Illustrate the sensitivity of MRS to fluctuations in brain metabolites, investigate the difference among different caffeine consumption habit groups and to explore the association between metabolite changes and sleepiness.
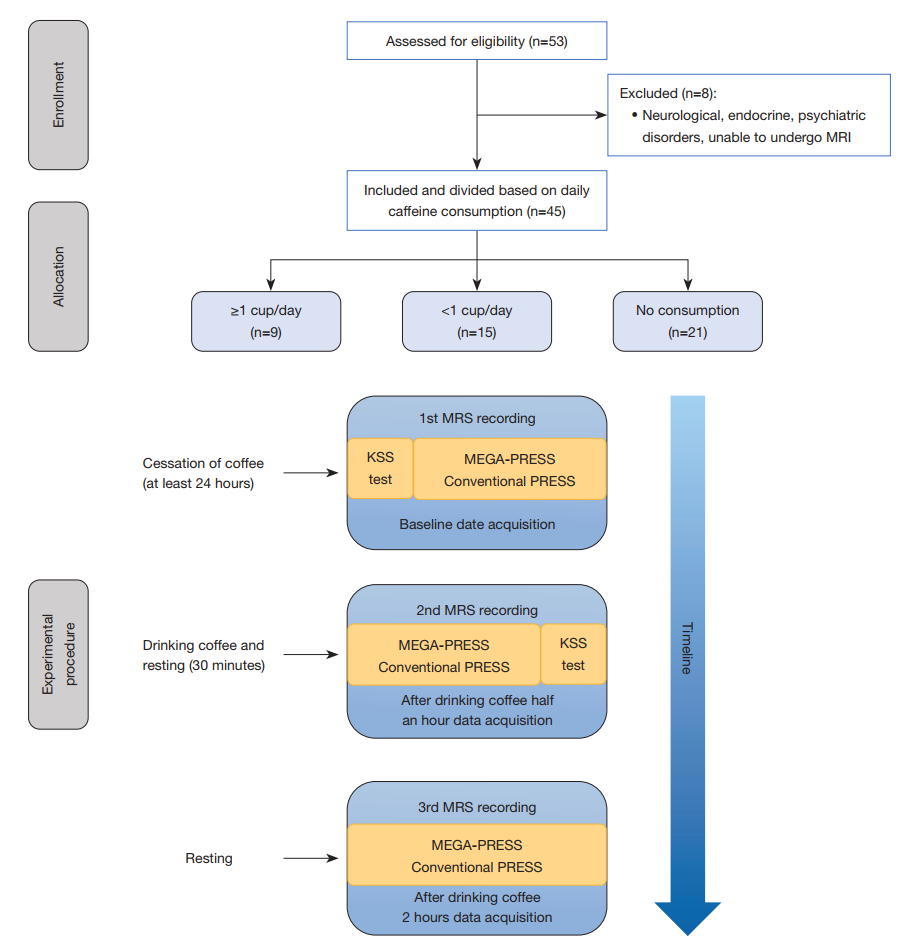
Approach: MRS was performed at three time point after the participants consumed coffee.
Results: GABA+, GPC/GPC + PCH, Ins, Glu, and Glx levels were significantly altered after caffeine consumption. The levels of Glu, GPC, Cr + PCr, Glx, and Ins were significantly influenced by caffeine consumption habits. GABA+ levels in TH voxels significantly correlate with subjective sleepiness.
Impact: This study should prove valuable in the study of the sensitivity of MRS to fluctuations in brain metabolites, the brain metabolites alteration differences among different coffee consumption habits, and MRS studies of GABA.
Introduction
Caffeine is the most widely consumed psychostimulant1. Despite this, the effects of acute caffeine intake on brain metabolite levels remain largely unknown. We aimed to investigate the effect of acute caffeine intake on brain metabolite concentrations in different caffeine consumption habit groups and to explore the association between metabolite changes and sleepiness.Method
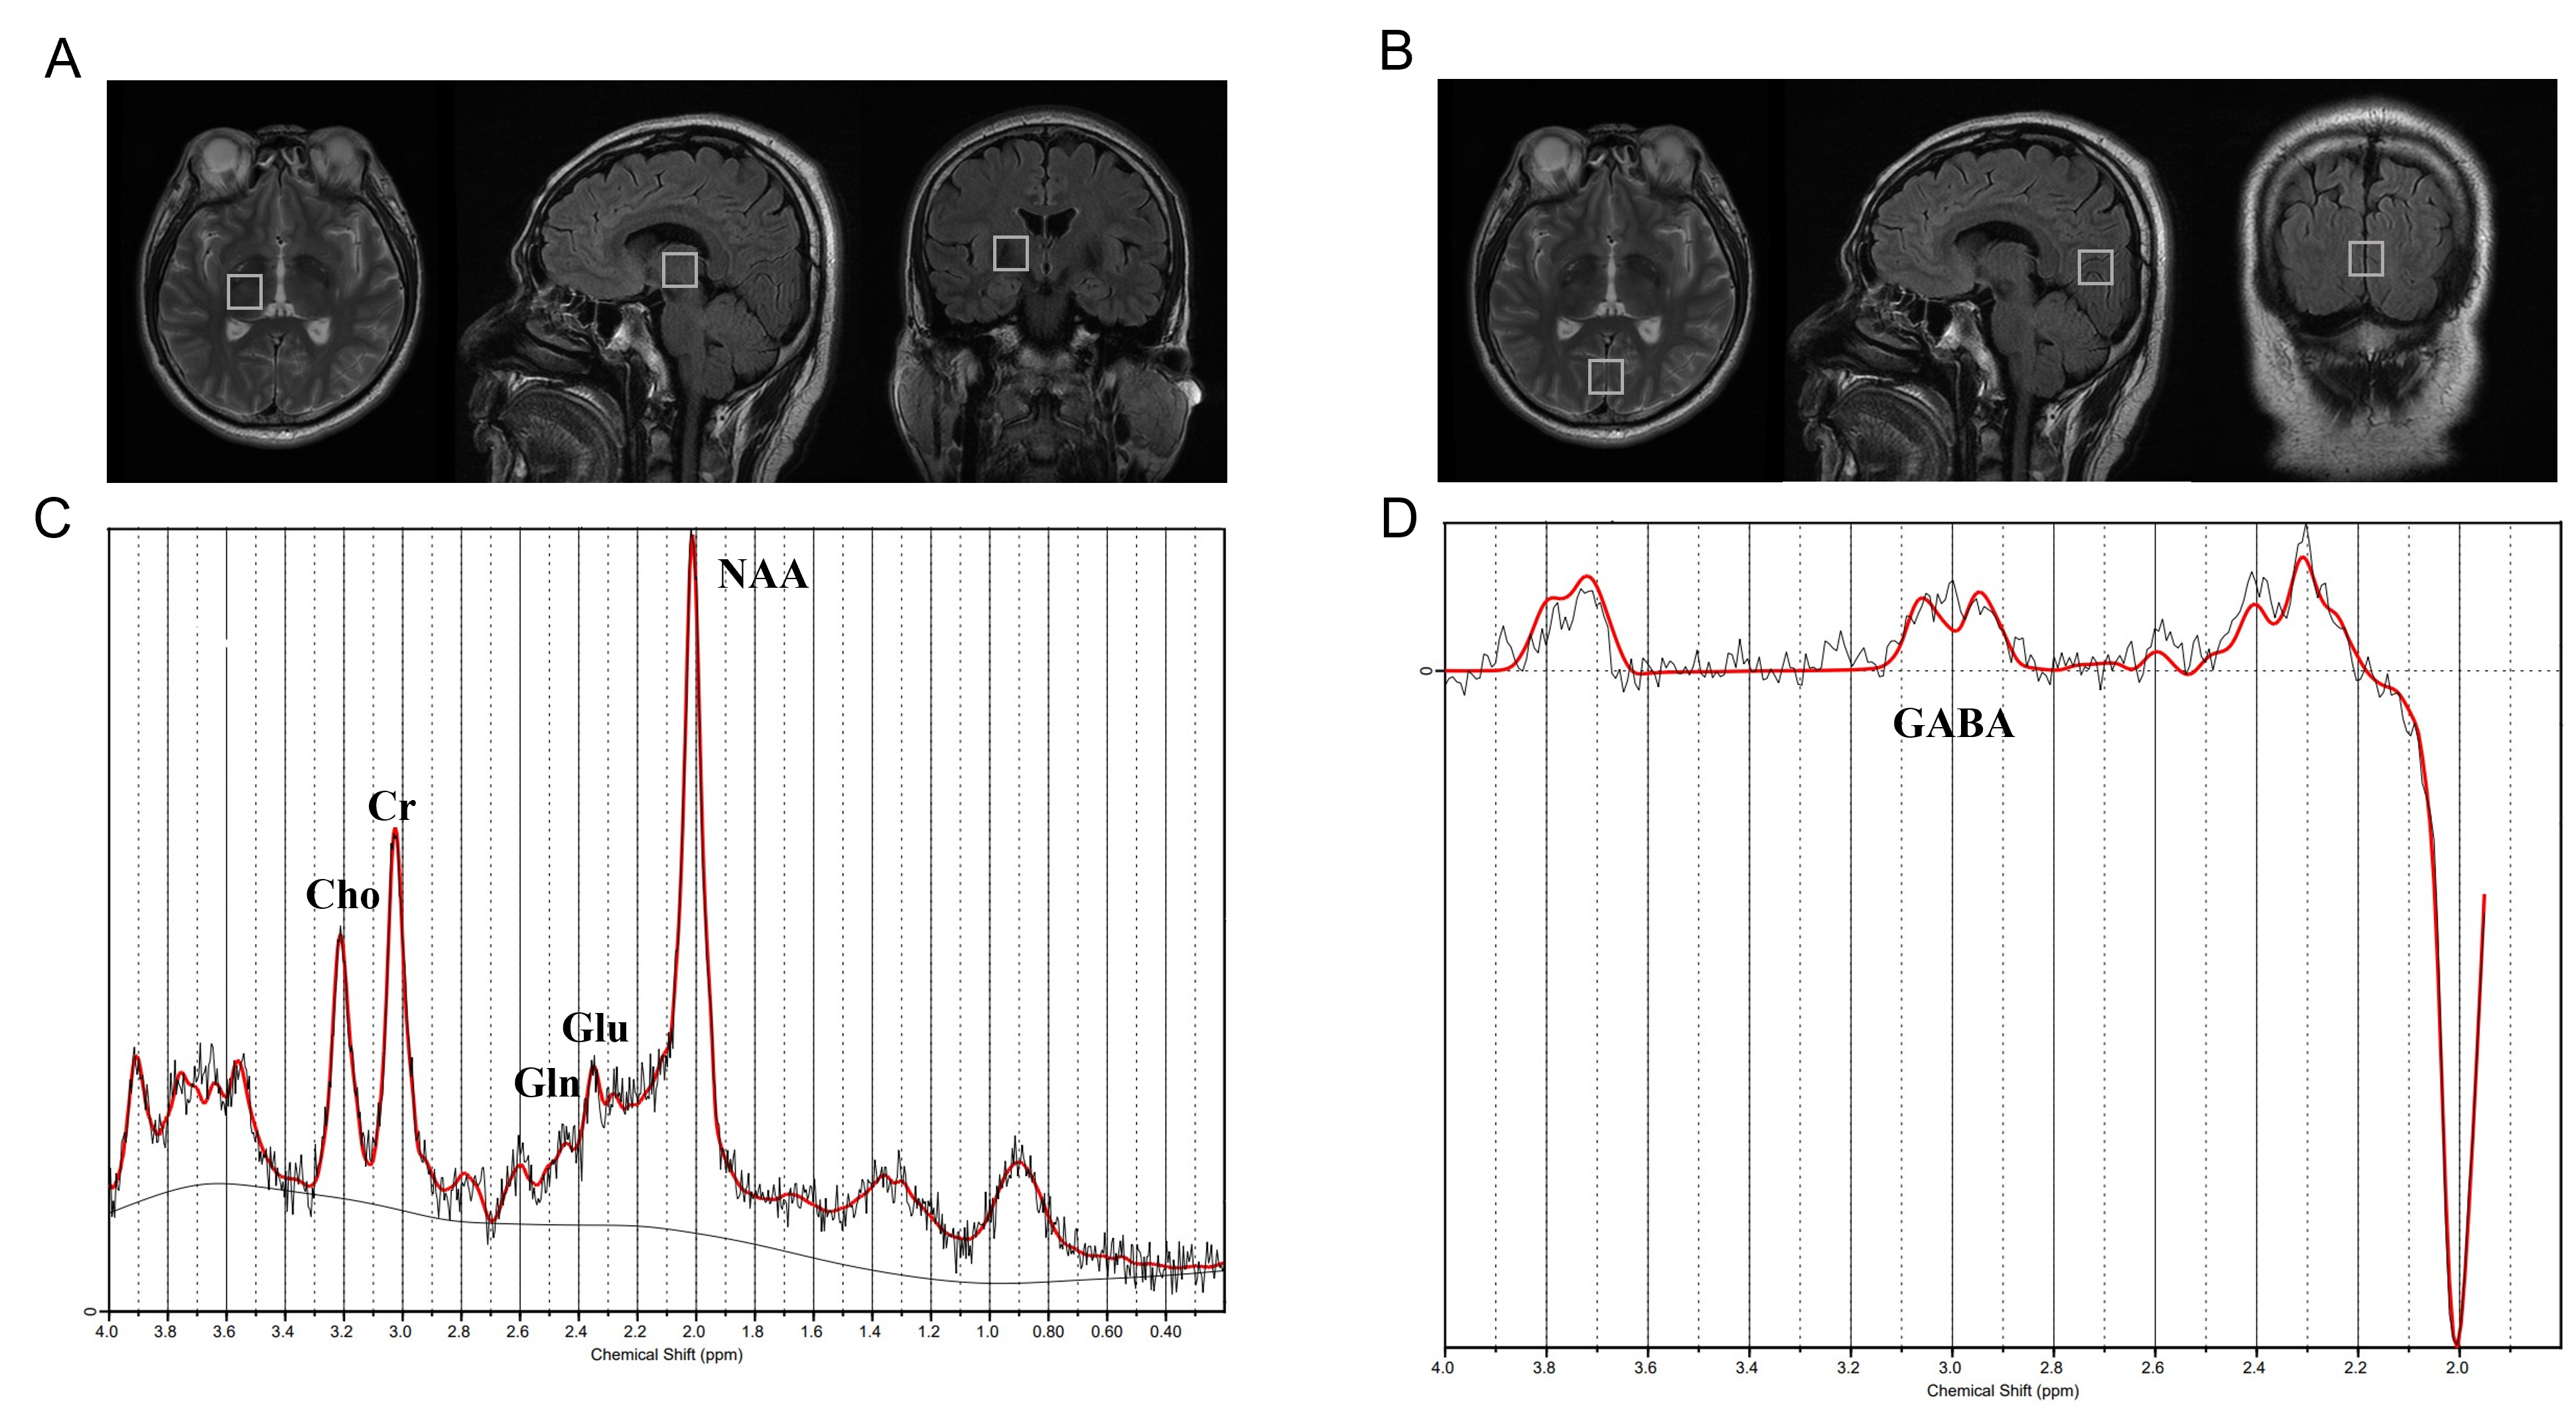
Forty-five healthy adults were divided into groups based on their daily caffeine consumption: ≥1 cup/day, <1 cup/day, and no consumption. Mescher-Garwood point resolved spectroscopy and conventional spectroscopy data were acquired at 3 Tesla from voxels in the thalamus and posterior cingulate cortex (PCC). Subjective sleepiness was measured with the Karolinska Sleepiness Scale. Associations among metabolic concentrations, time, and caffeine consumption habits were evaluated using two-way repeated-measures analyses of variance (ANOVAs). Correlations between metabolite concentrations and KSS was analyzed by bivariate correlation analysis.Results
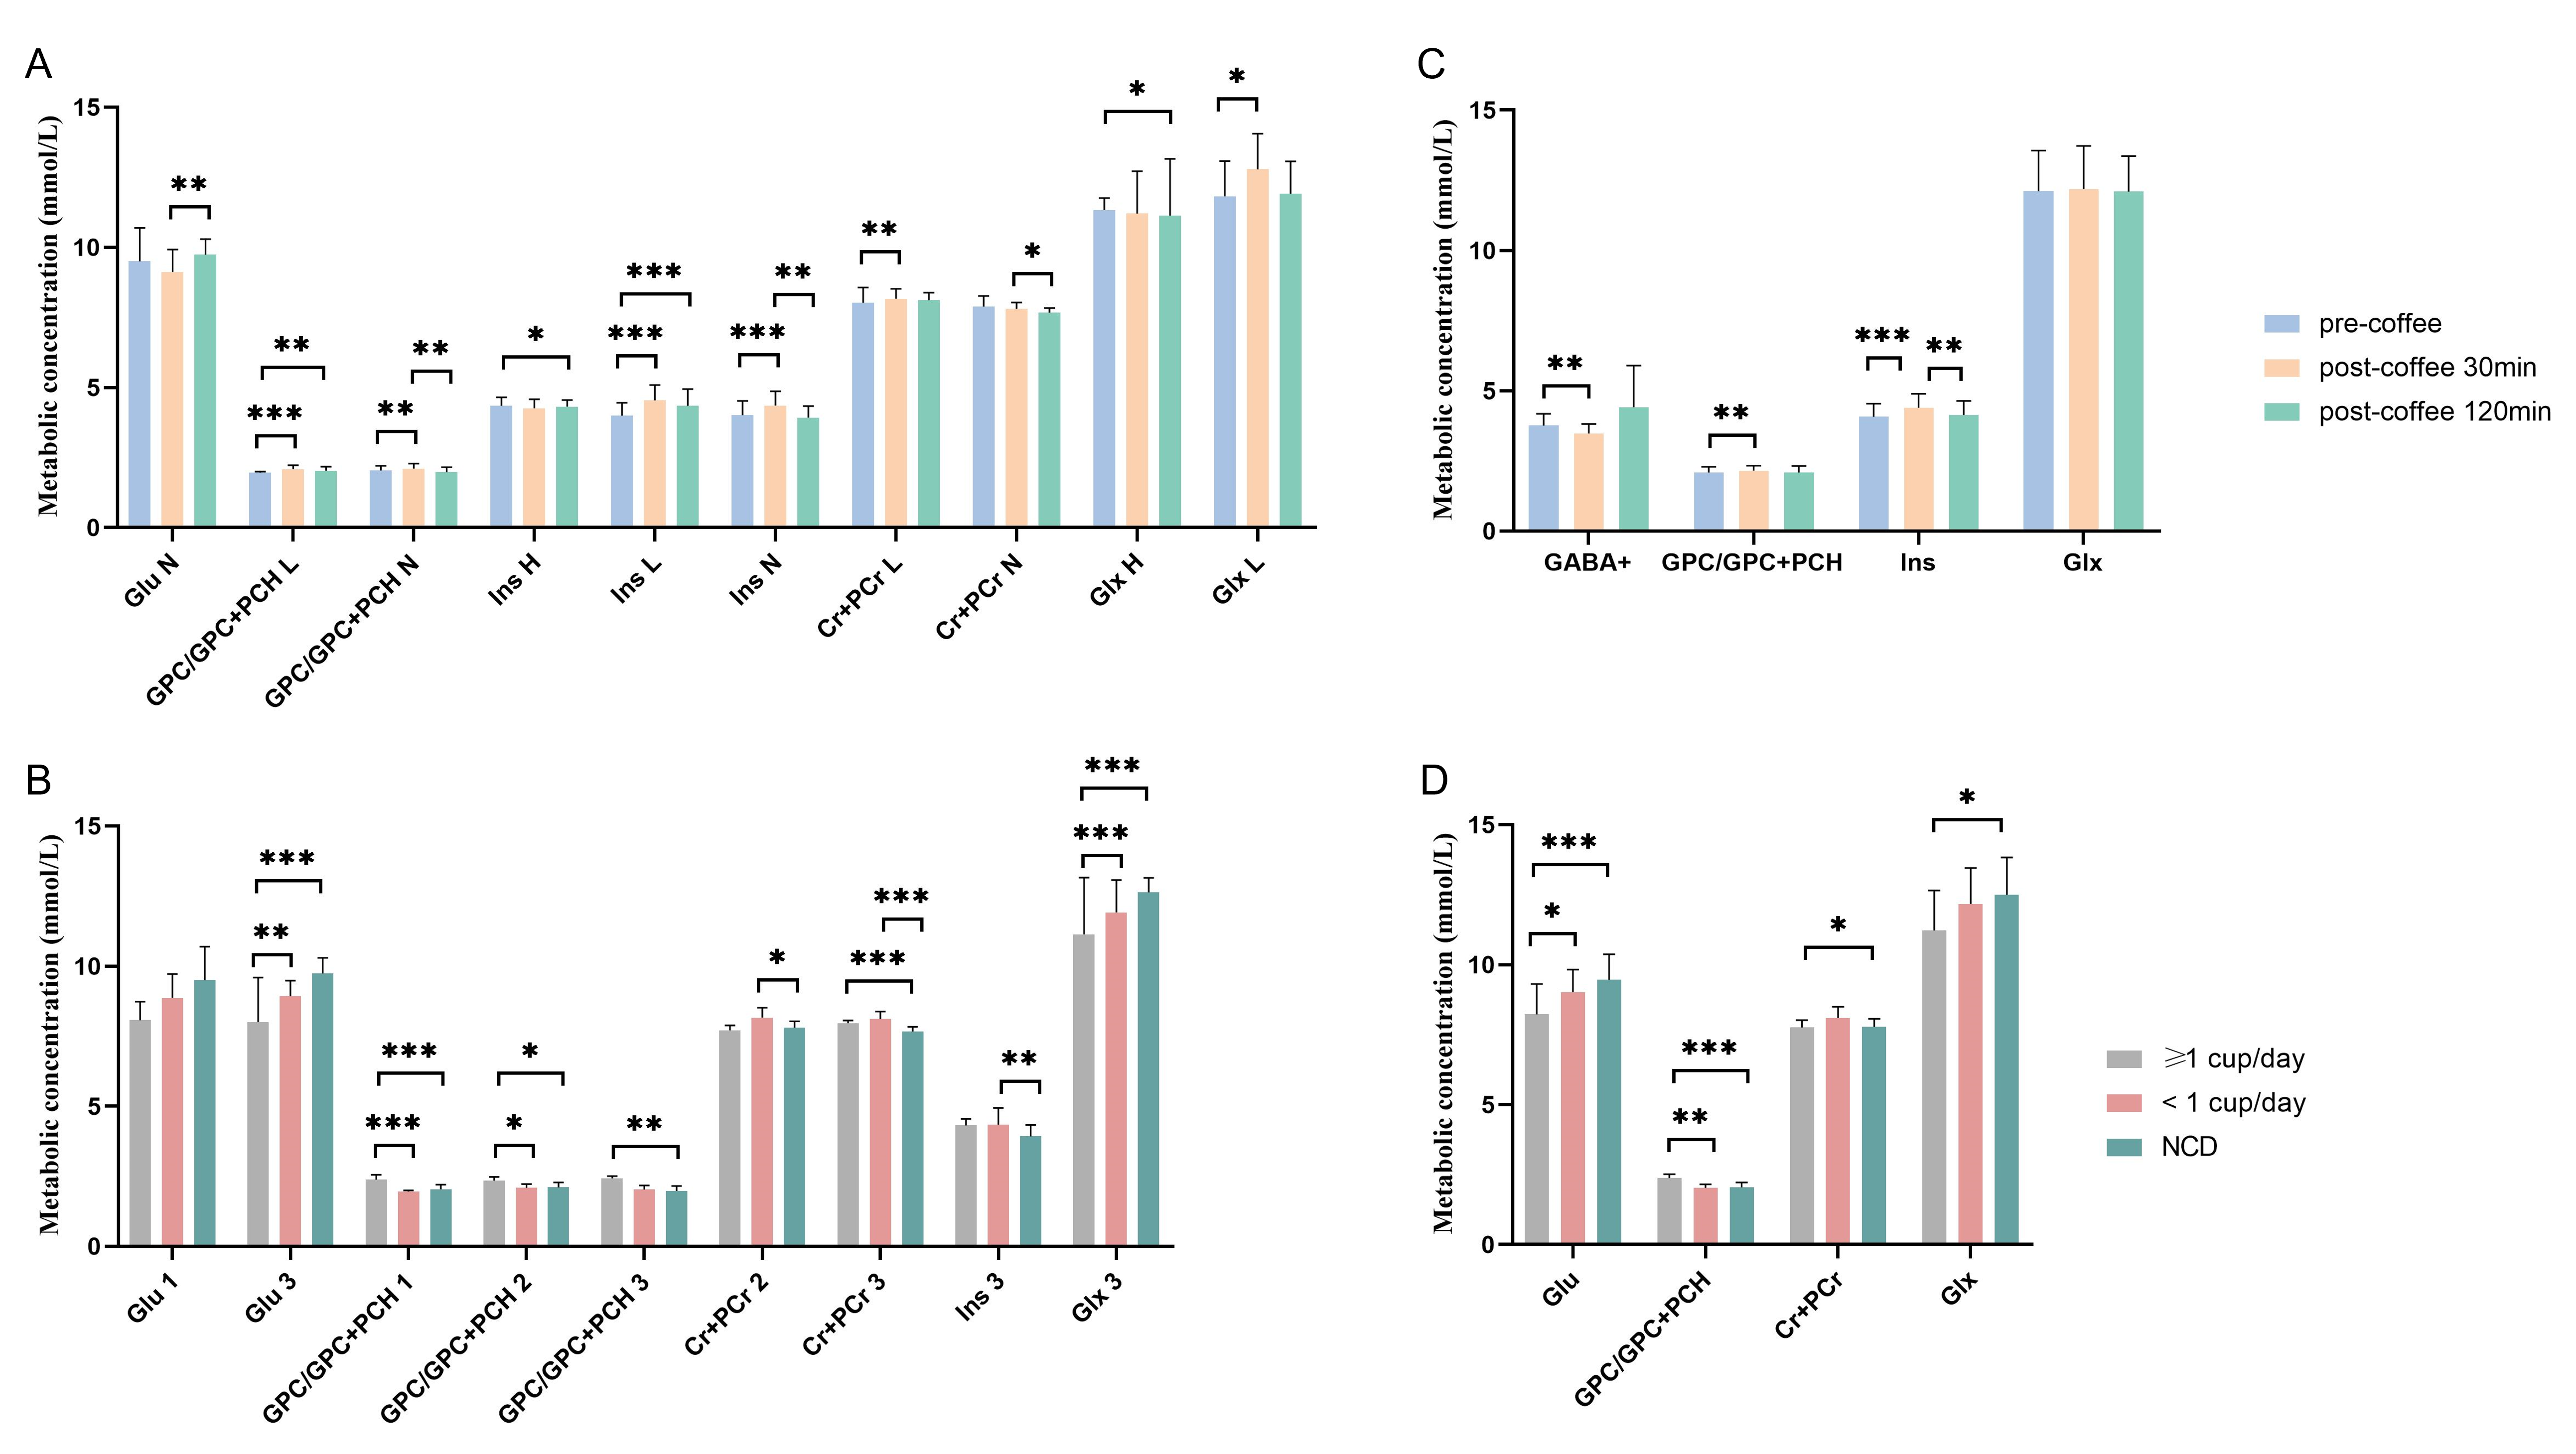
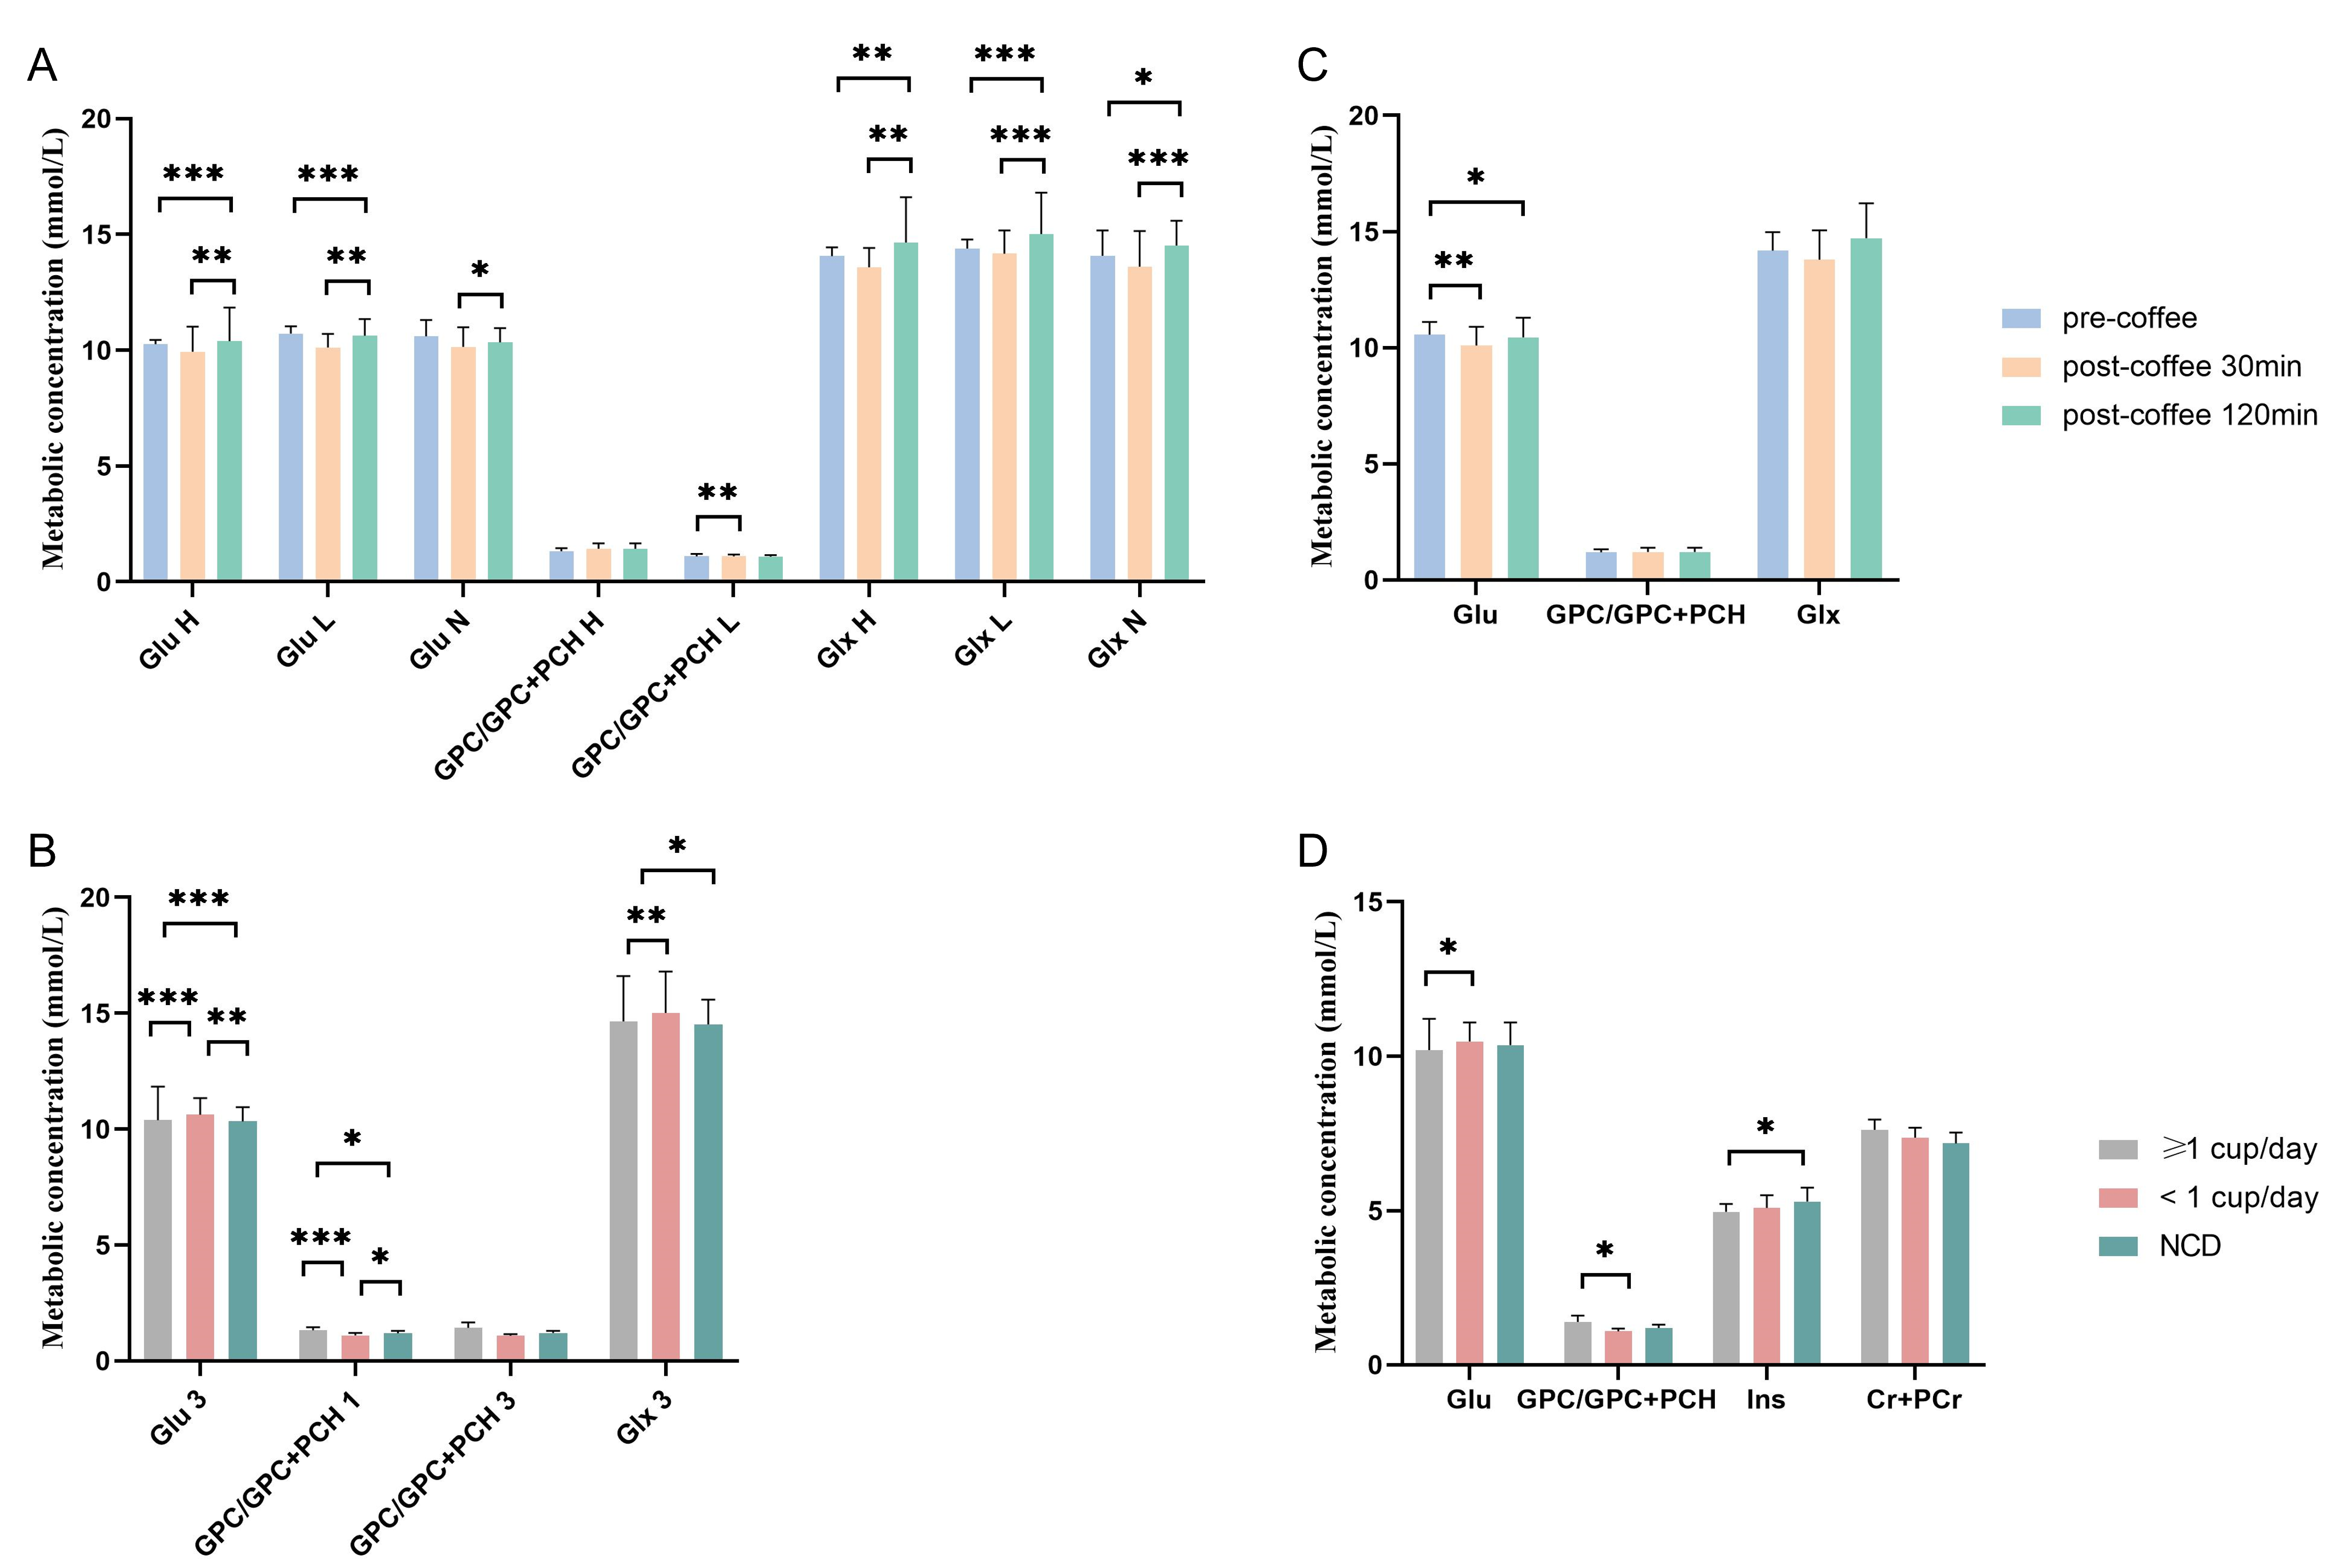
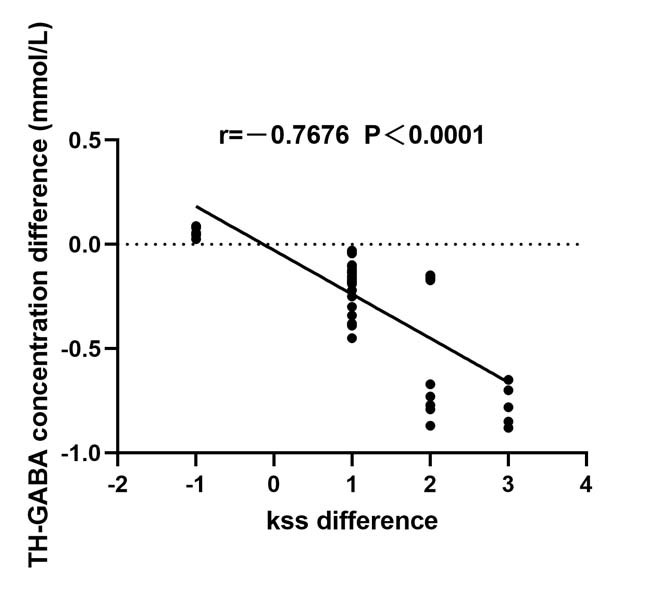
The results of two-way repeated measures analysis of variance indicated a significant interaction effect between time and group for glutamate (Glu), glycerylphosphocholine and phosphocholine (GPC + PCH), myo-inositol (Ins), glutamate + glutamine (Glx), and creatine and phosphocreatine (Cr + PCr) of the thalamus (all P<0.01), and Glu (P<0.0001), GPC + PCH (P=0.016), and Glx (P<0.0001) of the PCC. The change between pre- and post-caffeine intake results with significant reductions in γ-aminobutyric acid-positive macromolecule (GABA+) (thalamus, P=0.011), Glx (thalamus, P=0.002), Glu (PCC, P<0.0001), and significant increments in GPC + PCH (thalamus, P=0.012 and PCC, P<0.0001), Ins (thalamus, P=0.009), and Glx (PCC, P<0.0001). The change among the groups, with the ≥1 cup/day was significantly higher than the <1 cup/day or no consumption for glutamate (PCC, P=0.028), GPC (thalamus, P=0.001; PCC, P=0.026), and Cr + PCr (PCC, P=0.035); ≥1 cup/day was significantly lower than <1 cup/day and no consumption for Glu (thalamus, P<0.0001), Cr + PCr (thalamus, P=0.003), Glx (thalamus, P=0.014), and Ins (PCC, P=0.009). Bivariate correlation analysis revealed that GABA+ in the thalamus voxel (r=-0.7676; P<0.0001) was negatively correlated with subjective sleepiness.Discussion
We found that metabolite levels significantly changed 30 min after ingestion of caffeine, where GABA+ decreased, GPC/GPC + PCH increased, Glx increased, and Ins increased in the TH voxel; Glu decreased, GPC/ GPC + PCH increased, and Glx decreased in the PCC voxel; while a significant increase in Glx was seen in the PCC voxel after 120 min. Caffeine modulates many neurotransmitter systems, including acetylcholine, glutamine, and GABA, with the overall effect of reducing inhibition and increasing activity2. Caffeine may influence cerebral osmoregulation, a mechanism with pivotal involvement in Ins metabolism. Additionally, Cr and caffeine are among the most widely available and used compounds by competitive and recreational athletes3, for being able to improve strength and sprint performance. Regarding caffeine consumption habits, we found the ≥1 cup/day group to be significantly different from the <1 cup/day and NCD groups in the levels of Ins in the PCC voxel and Glu, GPC and Cr + PCr in both voxels. In vivo, the most important physiological function of GPC is to cross the blood-brain barrier and provide the choline necessary for acetylcholine and phospholipid synthesis. Cr is an important neuroprotective agent that increases the survival rate of nerve cells during an external attack. Coffee and its components have several neuroprotective properties that reduce the risk of cognitive decline and other neurodegenerative diseases4. Finally, GABA+ levels in the TH voxel were found to be negatively correlated with subjective sleepiness. This correlates with caffeine’s known ability to reduce sleepiness, prolong sleep latency, and enhance the wake period after sleep onset5.Conclusion
Higher caffeine consumption had a significant impact on brain metabolites. Magnetic resonance spectroscopy was sensitive in measuring brain metabolite fluctuations after caffeine intake, particularly the levels of GABA+ in the thalamus, which was significantly correlated with sleepiness.Acknowledgements
The authors thank the volunteers who participated in this study.
Funding: This research was supported by Joint Funds for the Health and Education of Fujian Province (No. 2019- WJ-31); and the Institute of Respiratory Diseases, Xiamen Medical College (No. HXJB-15).
References
1. Korekar, G., A. Kumar, and C. Ugale, Occurrence, fate, persistence and remediation of caffeine: a review. Environ Sci Pollut Res Int, 2020. 27(28): p. 34715-34733.
2. Sun, H., F. Gonzalez, and P.S. McQuillen, Caffeine Restores Background EEG Activity Independent of Infarct Reduction after Neonatal Hypoxic Ischemic Brain Injury. Dev Neurosci, 2020. 42(1): p. 72-82.
3. Elosegui, S., et al., Interaction Between Caffeine and Creatine When Used as Concurrent Ergogenic Supplements: A Systematic Review. Int J Sport Nutr Exerc Metab, 2022. 32(4): p. 285-295.
4. Wasim, S., et al., Neuroprotective and Neurodegenerative Aspects of Coffee and Its Active Ingredients in View of Scientific Literature. Cureus, 2020. 12(8): p. e9578.
5. Weibel, J., et al., The impact of daily caffeine intake on nighttime sleep in young adult men. Sci Rep, 2021. 11(1): p. 4668.
Figures