1927
Long-term ketamine usage affects mood, cognition, and neurometabolism in mice1Department of NMR microimaging and spectroscopy, CSIR-Centre For Cellular and Molecular Biology, Hyderabad, India, 2Academy of Scientific and Innovative Research (AcSIR), Ghaziabad, India
Synopsis
Keywords: Neurotransmission, Metabolism, Spectroscopy, Brain, Animal
Motivation: Recently FDA has approved S-ketamine for the treatment of drug-resistant depression. However, the impact of long-term use of ketamine on mood, cognition, and neurotransmitter pathways is not clear.
Goal(s): To assess the impacts of chronic ketamine administration on mood, cognition, and neurometabolism in the mice model.
Approach: 1H-[13C]-NMR spectroscopy in conjunction with an intravenous [1,6-13C2]glucose infusion was used for neurometabolic measurements.
Results: Ketamine administered mice showed hyperactivity, reduced cognition, and depression-like phenotypes. Moreover, chronic ketamine exposure increased the metabolic activity of glutamatergic and GABAergic neurons in the cerebral cortex.
Impact: Ketamine, a rapid-acting antidepressant, has been abused as a party drug historically. This study was performed to uncover the adverse effects of chronic ketamine administration and will be useful in designing better treatment approaches for depression.
Introduction
A sub-anesthetic dose of Ketamine (KET), a non-competitive NMDA channel blocker, induces rapid antidepressant effects, within hours of administration, which lasts for several days1. However, the use of ketamine is limited, mainly because of its addictive properties and cognitive adverse effects2,3. Additionally, the long-term effects of Ketamine on cognitive function, and other behaviors remain largely unexplored4,5. In this study, we have assessed the impact of chronic ketamine exposure on cognitive function, anxiety, and neurometabolic activity in the mouse model.Methods
All animal experiments were approved by the Animal Ethics Committee of CCMB, Hyderabad. Two months old C57BL6 mice (n=28) were divided into two groups: KET (n=14) and Control (n=14). KET group mice were injected with ketamine (10 mg/kg, intraperitoneally) daily for 30 days, while control mice were injected with 0.9% saline solution. The Elevated Plus Maze (EPM) test and Open Field Test (OFT) were performed to measure the anxiety phenotypes in the mice6,7. The depression-like phenotype in mice was evaluated using the Tail suspension test (TST)8. Moreover, the Y-maze test and Novel Object Recognition Test (NORT) were used to assess the cognition and short-term memory of mice9,10. For neurometabolic analysis, mice were infused with [1,6-13C2]glucose via the tail vein for 2 min using a pre-programmed infusion protocol11. The brain metabolism was arrested by the focused beam microwave system (3KW, 1.2s) after 7 min of the infusion. The brain metabolites were extracted from different brain regions. The concentration and 13C labeling of metabolites were measured in 1H-[13C]-NMR spectra of brain tissue extracts acquired at 600 MHz NMR. The cerebral metabolic rates of glucose oxidation were calculated based on the 13C label trapped into different amino acids12.Results
Ketamine resulted in increased locomotor activity in the mice for 10 min post-injection from the first day to the 28th day (Fig. 1B and 1C). Ketamine administered mice spent significantly more time (p=0.01) in the open arms and center zone (KET 76.2±39.8 s, n=14; CON 44.6±18.2 s, n=14) of the EPM test (Fig. 2A), and exhibited increased time in the center zone (KET 49.3±16 s; CON 28.9±11.5 s; p=0.001) of OFT (Fig. 2B). Moreover, KET treated mice were immobile for longer duration (KET 109.7±35 s; CON 89.1±21.8 s; p=0.08) in TST (Fig. 2C). Furthermore, KET group of mice (56.9±17.0%, n=14) showed significant (p=0.02) decrease in recognition index when compared with controls (67.6±17.8%, n=14) in NORT (Fig. 2D). The spatial memory was unperturbed in ketamine-treated mice as revealed by the spontaneous alternation (KET 60.8±8.4 %; CON 62.9±6.9 %; p=0.48) in Y-Maze Test.A typical 1H-[13C]-NMR spectrum of the cerebral cortex of ketamine-treated mice is presented in Fig. 3. The concentrations of glutamate (p=0.001), N-acetyl aspartate (NAA, p=0.001) and inositol (p=0.003) were increased significantly in the cerebral cortex of ketamine treated mice (Table 1). There was no significant difference in the levels of metabolites in the prefrontal cortex, hippocampus, and striatum. Although the concentrations of 13C labeled amino acids were higher in the cerebral cortex, they did not reach statistical significance, probably due to higher variations in the ketamine-treated mice (Table 2). The cerebral metabolic rate of glucose oxidation (CMRGlc(Ox)) in glutamatergic neurons was found to be increased significantly (p=0.01) in the cerebral cortex (KET 0.519±0.058 µmol/g/min; CON 0.444±0.037 µmol/g/min) of ketamine treated mice. Similarly, CMRGlc(Ox) in GABAergic neurons was increased in the cerebral cortex (0.120±0.014 vs 0.103±0.009 µmol/g/min, p=0.01). Moreover, the CMRGlc(Glu) in the hippocampus (0.457±0.071 vs 0.407±0.023 µmol/g/min, p=0.06) (Fig. 4B), and CMRGlc(GABA) in the prefrontal cortex (0.124±0.015 vs 0.111±0.009 µmol/g/min, p=0.06) exhibit a trend of increase. There was no significant impact of ketamine on CMRGlc on other brain regions (Fig. 4A, B).
Discussion
KET-treated mice displayed hyperactivity post-injection. These mice spent more time in the open arms of EPM, and the center zone of the open field box, which suggests hyper-anxiety in these mice. Moreover, NORT and TST analyses revealed impaired memory and depression-like phenotype in ketamine-administered mice. Most importantly, ketamine-treated mice exhibit hyper-metabolism of glucose in neurons in the cerebral cortex, prefrontal cortex, and hippocampus, a phenomenon reported to occur before the onset of Alzheimer’s disease13 and amyotrophic lateral sclerosis14. These findings suggest that chronic ketamine exposure will have consequences for neurodegenerative disorders.Conclusion
These results show that long-term ketamine usage has an adverse impact on anxiety, cognitive function, and neuronal metabolic activity. Understanding these changes will be useful to minimize these characteristics of ketamine use in the future.Acknowledgements
This work was supported by the Council for Scientific and Industrial Research (CSIR), Government of India (Health Care Theme FBR/MLP0150). AS thanks the Department of Biotechnology for the award of Junior Research Fellowship (DBT/2019/CCMB/1230).References
1. Berman, R. M. et al. Antidepressant effects of ketamine in depressed patients. Biol. Psychiatry 47, 351–354 (2000).
2. Andrade, C. Ketamine for Depression, 4: In What Dose, at What Rate, by What Route, for How Long, and at What Frequency?: J. Clin. Psychiatry 78, e852–e857 (2017).
3. Short, B., Fong, J., Galvez, V., Shelker, W. & Loo, C. K. Side-effects associated with ketamine use in depression: a systematic review. Lancet Psychiatry 5, 65–78 (2018).
4. Smith-Apeldoorn, S. Y., Veraart, J. K., Spijker, J., Kamphuis, J. & Schoevers, R. A. Maintenance ketamine treatment for depression: a systematic review of efficacy, safety, and tolerability. Lancet Psychiatry 9, 907–921 (2022).
5. Strous, J. F. M. et al. Brain Changes Associated With Long-Term Ketamine Abuse, A Systematic Review. Front. Neuroanat. 16, 795231 (2022).
6. Walf, A. A. & Frye, C. A. The use of the elevated plus maze as an assay of anxiety-related behavior in rodents. Nat. Protoc. 2, 322–328 (2007).
7. Gould, T. D., Dao, D. T. & Kovacsics, C. E. The Open Field Test. in Mood and Anxiety Related Phenotypes in Mice (ed. Gould, T. D.) vol. 42 1–20 (Humana Press, 2009).
8. Juszczak, G. et al. The usage of video analysis system for detection of immobility in the tail suspension test in mice. Pharmacol. Biochem. Behav. 85, 332–338 (2006).
9. Kraeuter, A.-K., Guest, P. C. & Sarnyai, Z. The Y-Maze for Assessment of Spatial Working and Reference Memory in Mice. in Pre-Clinical Models (ed. Guest, P. C.) vol. 1916 105–111 (Springer New York, 2019).
10. Leger, M. et al. Object recognition test in mice. Nat. Protoc. 8, 2531–2537 (2013).
11. Soni, N. D., Ramesh, A., Roy, D. & Patel, A. B. Brain energy metabolism in intracerebroventricularly administered streptozotocin mouse model of Alzheimer’s disease: A 1 H-[ 13 C]-NMR study. J. Cereb. Blood Flow Metab. 41, 2344–2355 (2021).
12. Bagga, P. et al. Characterization of Cerebral Glutamine Uptake from Blood in the Mouse Brain: Implications for Metabolic Modeling of 13 C NMR Data. J. Cereb. Blood Flow Metab. 34, 1666–1672 (2014).
13. Ashraf, A., Fan, Z., Brooks, D. J. & Edison, P. Cortical hypermetabolism in MCI subjects: a compensatory mechanism? Eur. J. Nucl. Med. Mol. Imaging 42, 447–458 (2015).
14. Roy, D., Puvvada, M., Kapanaiah, S. K. T. & Patel, A. B. Enhanced Cortical Metabolic Activity in Females and Males of a Slow Progressing Mouse Model of Amyotrophic Lateral Sclerosis. Neurochem. Res. 47, 1765–1777 (2022).
Figures
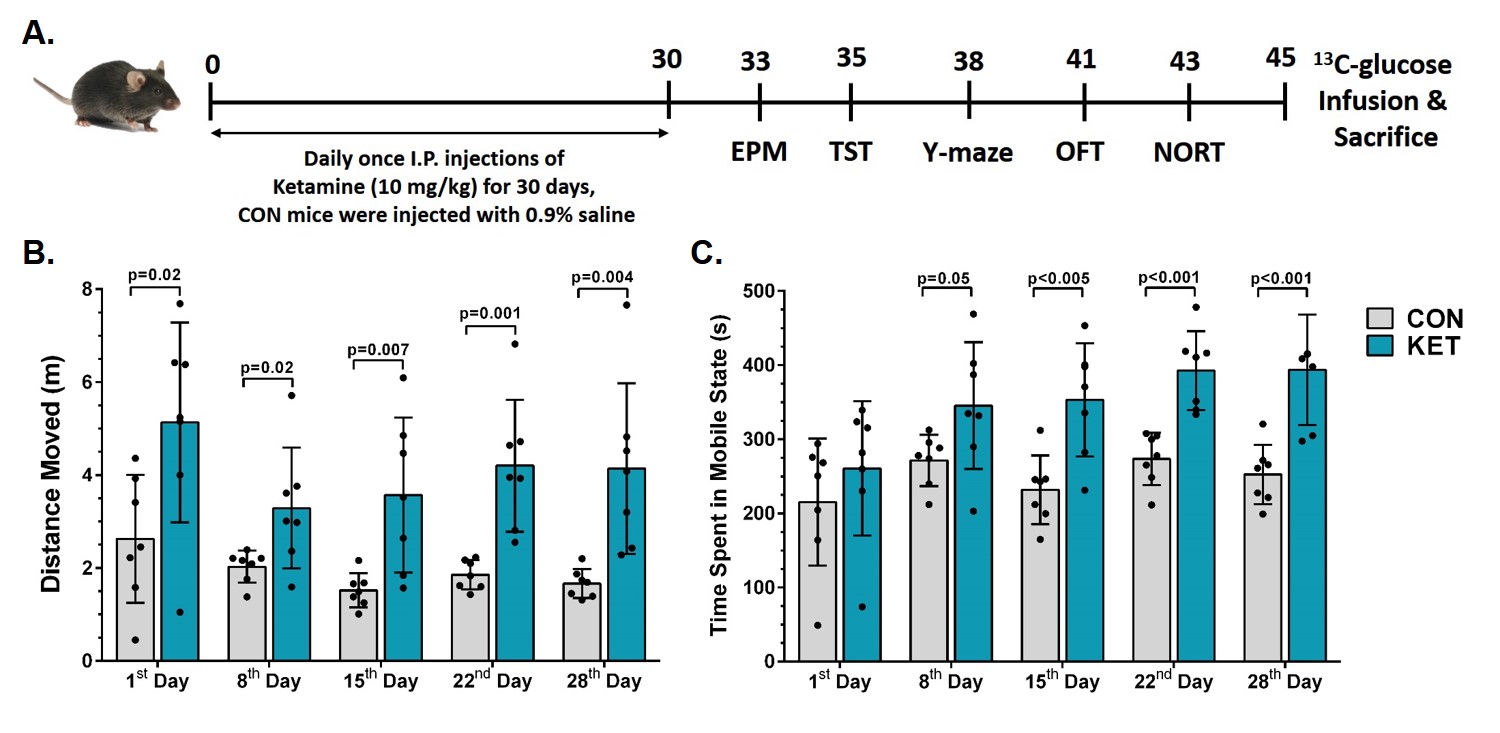
Fig 1. A. Schematic representation of the timeline of the experiment. B. Distance moved by mice in the first 10 min post intraperitoneal injection; C. Time spent in mobile state by mice in the first 10 min post intraperitoneal injection. The vertical bar represents the mean±SD of the group, while the symbols depict individual values. The statistical significance was evaluated using a 2-tailed T-test with the Holm-Sidak method for multiple comparisons in GraphPad Prism software.
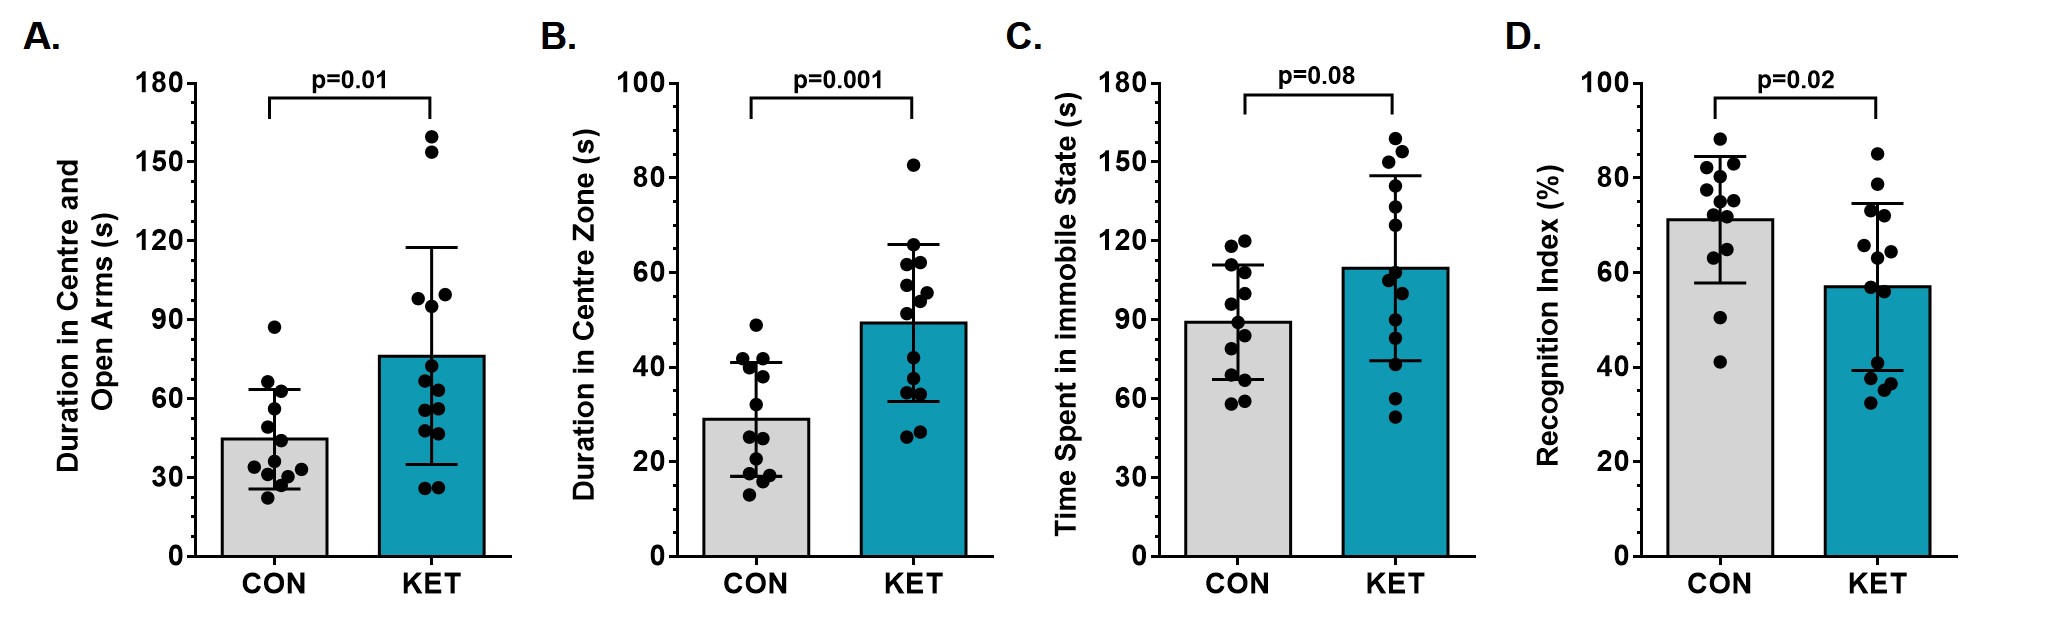
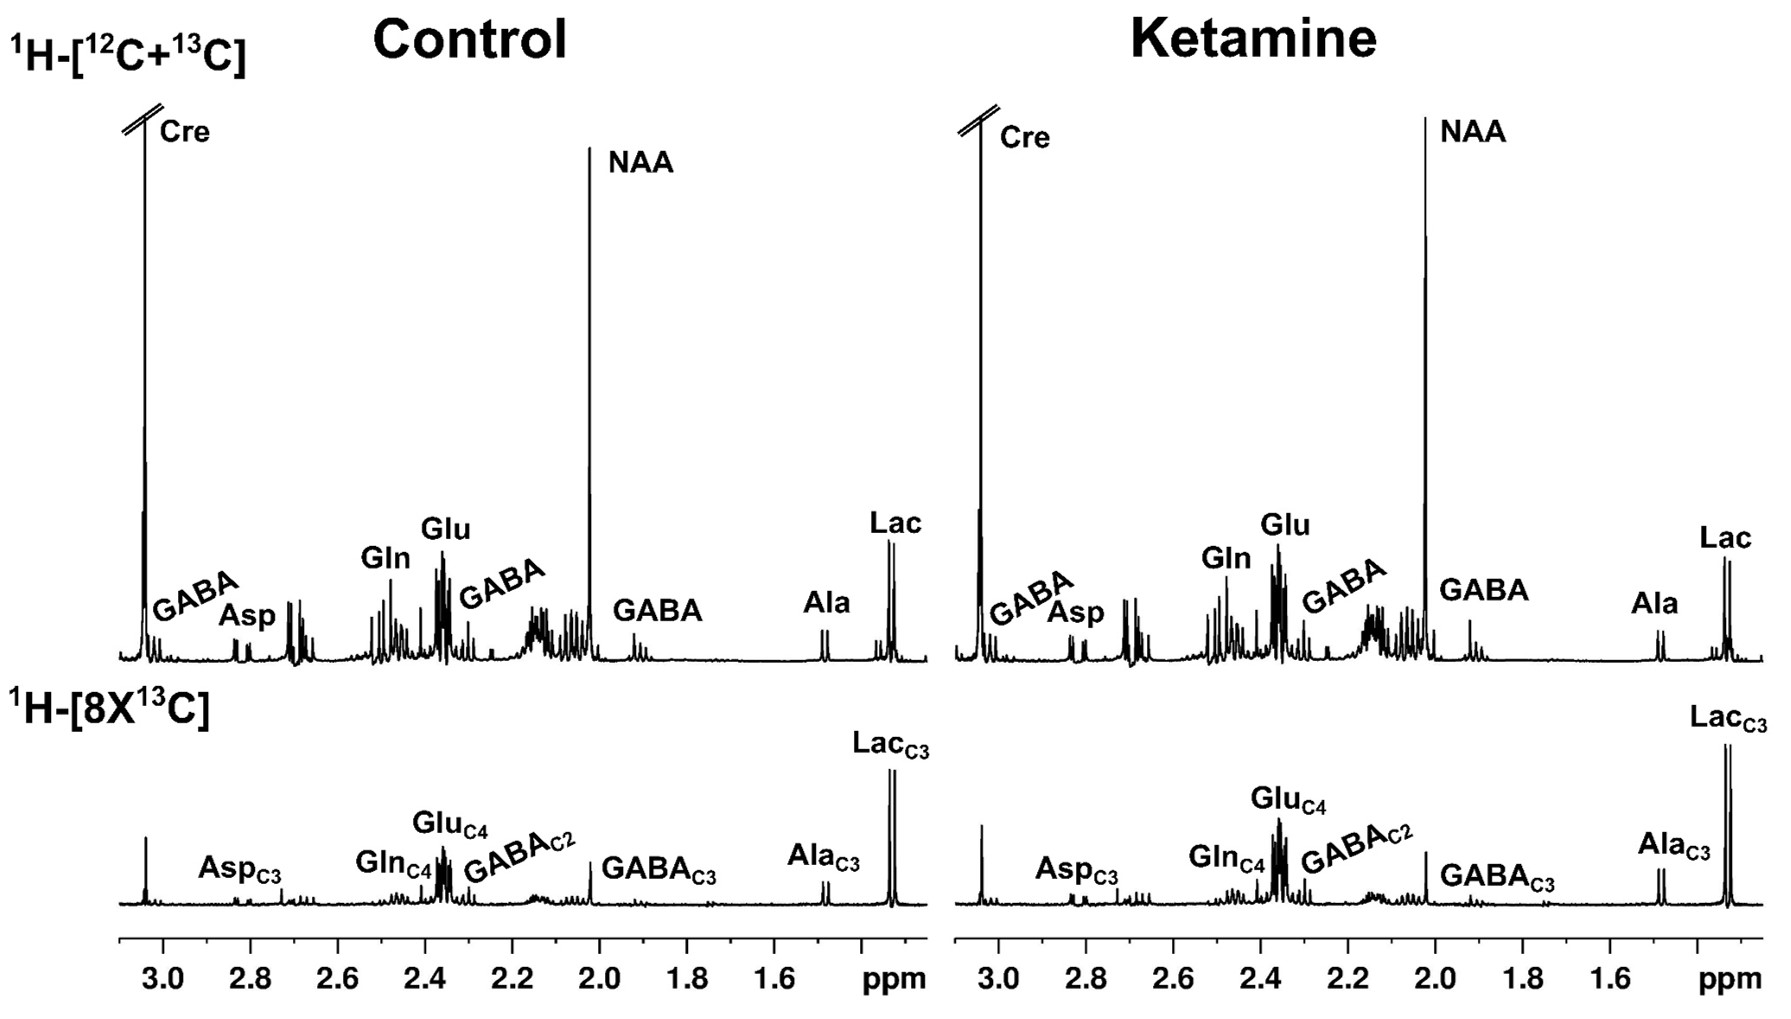
Fig. 3 Representative 1H-[13C]-NMR spectra from cortical tissue extract of control and ketamine mice. The spectra in the upper panel 1H-[12C+13C] represent the total concentration of neurometabolites, whereas the lower panel depicts 13C labeled neurometabolites.
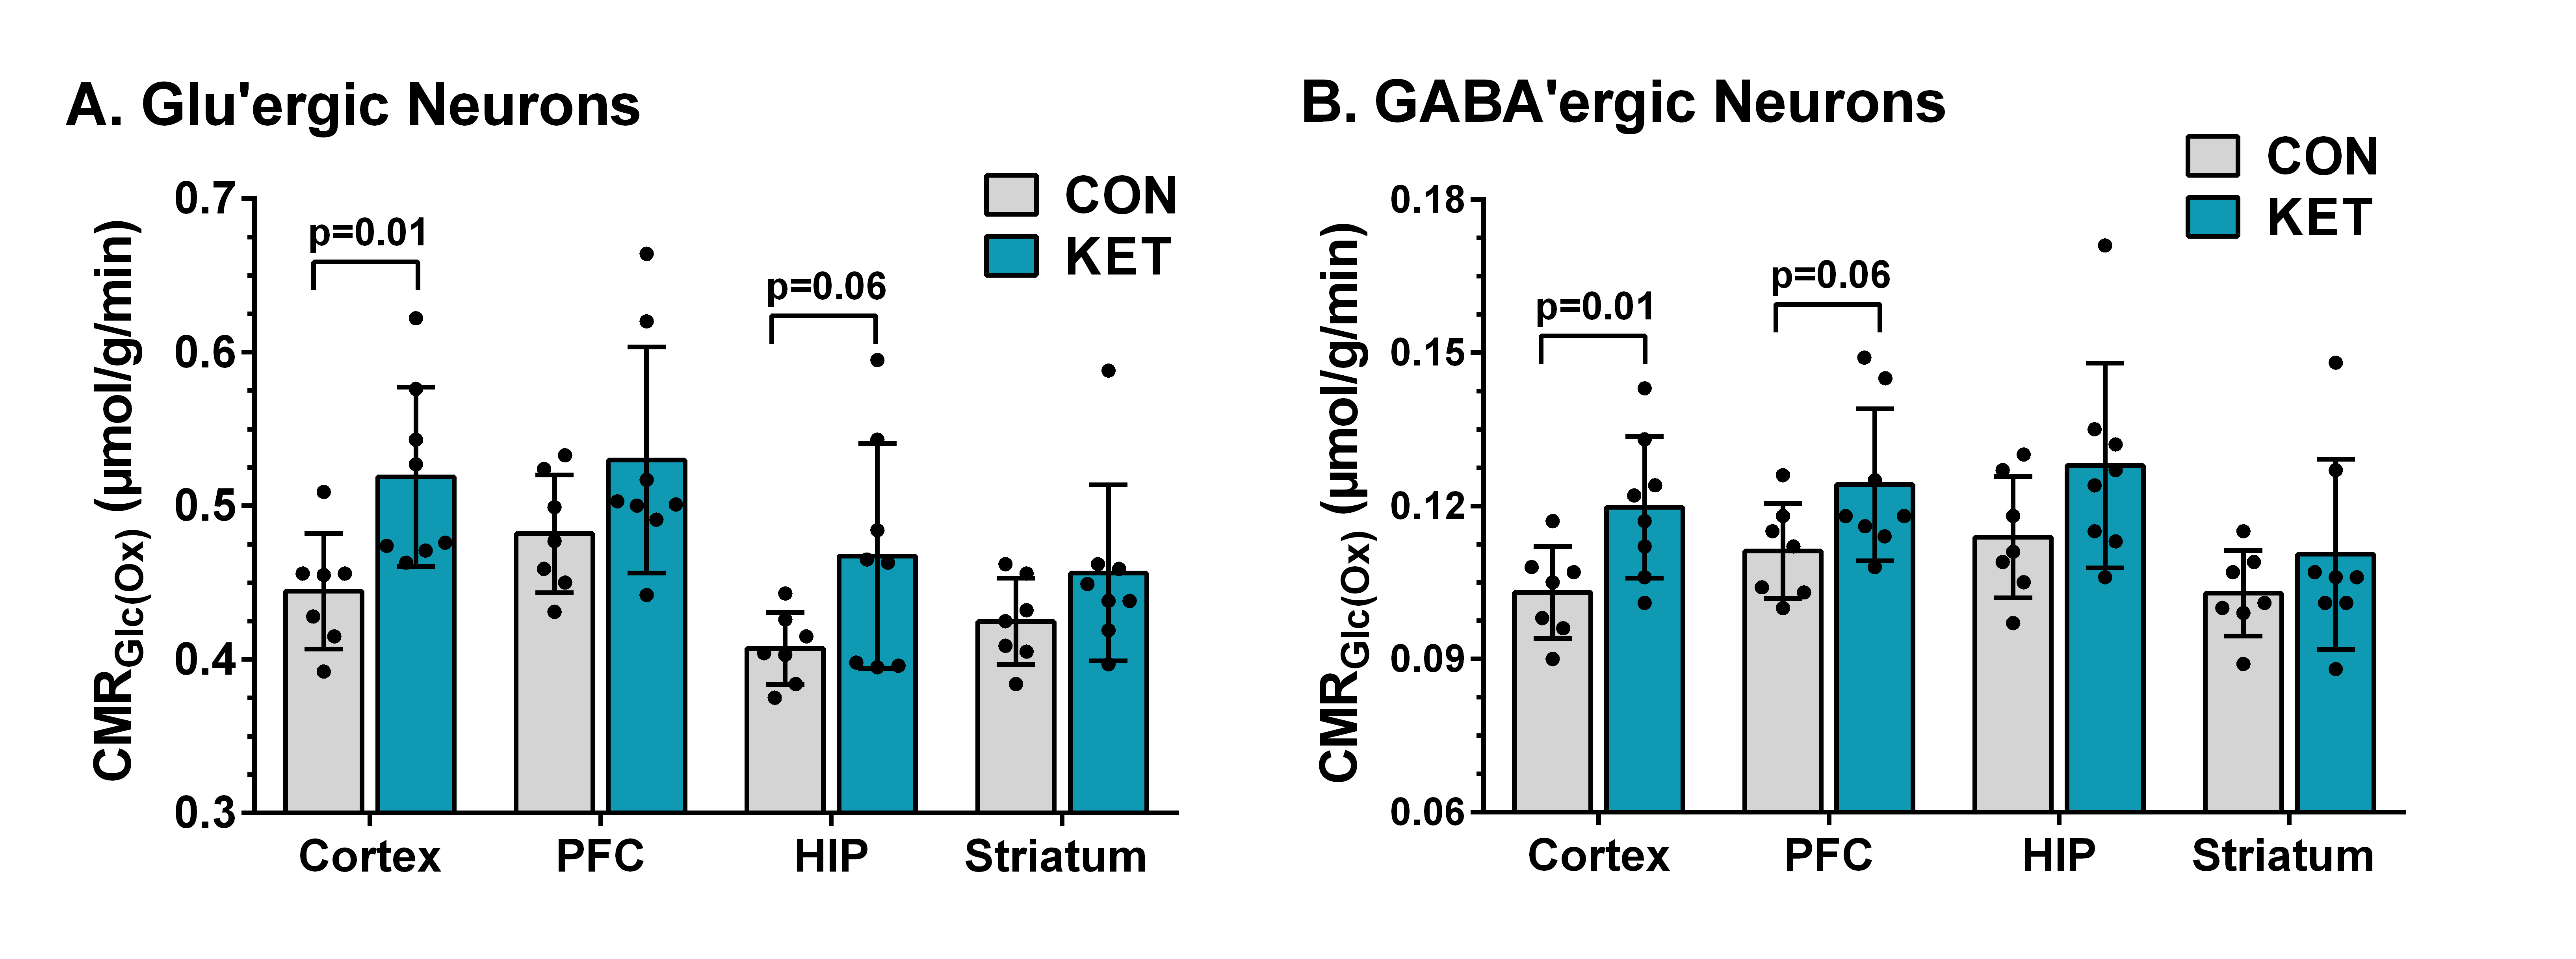
Fig. 4. Cerebral metabolic rates of glucose oxidation (CMRGlc(OX)) in A. Glutamatergic neurons; B. GABAergic neurons. The cerebral metabolic rates were estimated based on the 13C label trapped into different amino acids including AspC3, GABAC2, GABAC4, GluC4, GluC3, and GlnC4. The vertical bar represents the mean±SD of the group, while the symbols depict individual values.
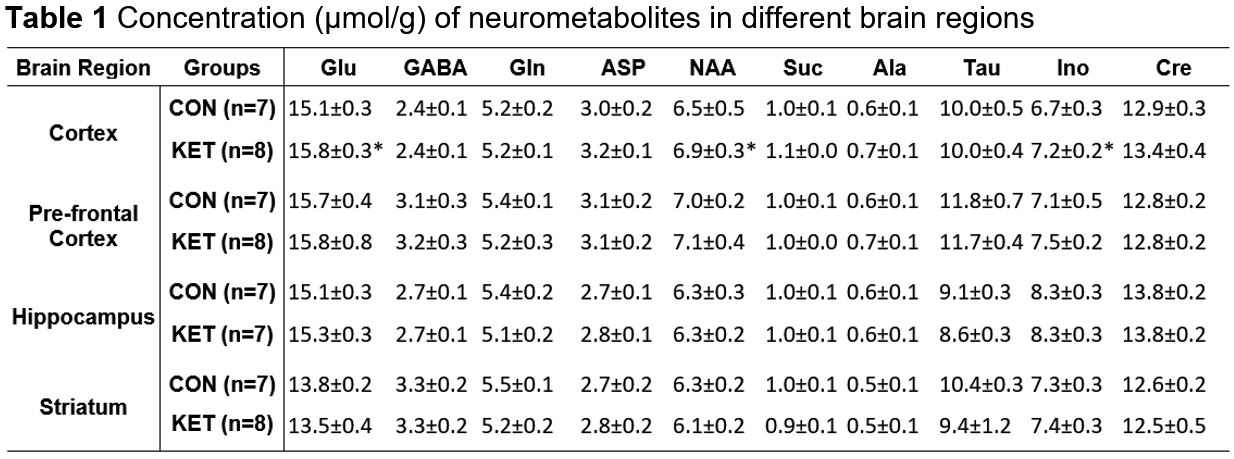
The concentration of metabolites was measured in the brain tissue extracts from 1H-[12C+13C]-NMR spectrum using [2-13C]glycine as a reference. Values are presented as mean±SD. The statistical significance was evaluated using a 2-tailed T-test with the Holm-Sidak method for multiple comparisons in GraphPad Prism software. Abbreviations: Ala, alanine; Asp, aspartate; Cre, creatine; GABA, g-aminobutyric acid; Glu, glutamate; Gln, glutamine; Ino, inositol; NAA, N-acetyl aspartate; Suc, succinate; Tau, taurine. *p<0.005, when KET-treated mice were compared with CON mice.
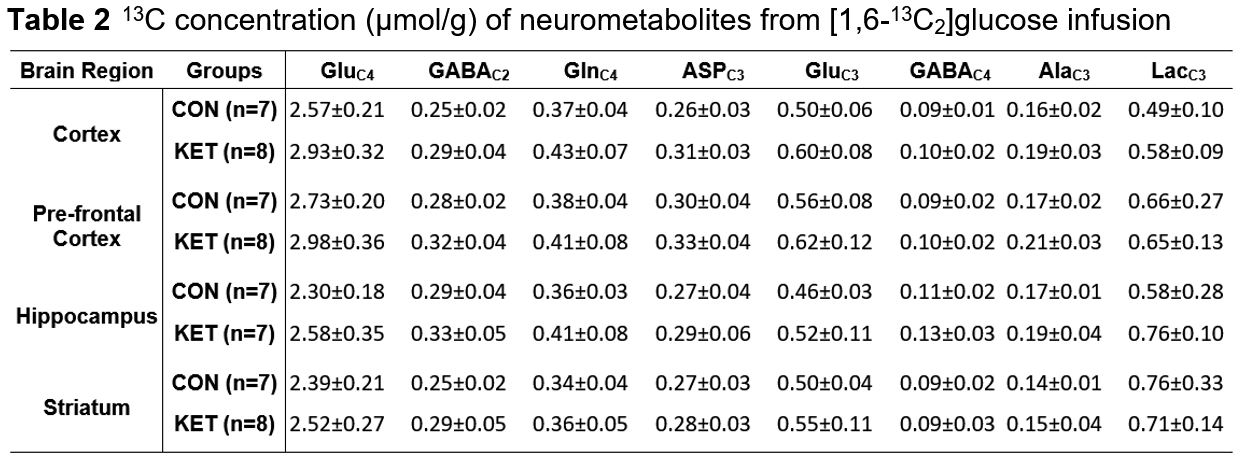
The 13C concentrations of neurometabolites were measured in the brain tissue extracts from edited 1H-[13C]-NMR spectrum using [2-13C]glycine as a reference. Values are presented as mean±SD. The statistical significance was evaluated using a 2-tailed T-test with the Holm-Sidak method for multiple comparisons in GraphPad Prism software. Abbreviations: AlaC3, alanine-C3; AspC3, aspartate-C3; GABAC2, g-aminobutyric acid-C2; GABAC4, g-aminobutyric acid-C4; GluC4, glutamate-C4; GluC3, glutamate-C3; GlnC4, glutamine-C4; LacC3, lactate-C3