1925
Continuous visual stimulation is associated with reduced visual cortex temperature1Medical Imaging, University for Development Studies, Tamale, Ghana, 2Medical Physics, University of Ghana, Accra, Ghana
Synopsis
Keywords: Neurotransmission, Spectroscopy, BOLD, Brain, Magnetic Resonance, Neural activation, Temperature, Thermometry, Visual cortex, Visual stimulation
Motivation: It is unclear if magnetic resonance spectral response to neural activation offers insight into brain temperature variation.
Goal(s): To measure visual cortex temperature during visual stimulation.
Approach: During single and continuous stimulation, spectra were collected from the activated visual cortex region (n = 4). Frequency shifts of the N-acetyl aspartate, creatine and choline peaks from the water peak were calibrated to measure temperature using pre-determined regression equations for each peak. Spectral responses to neural activation were estimated as percentage changes in their height, width and area.
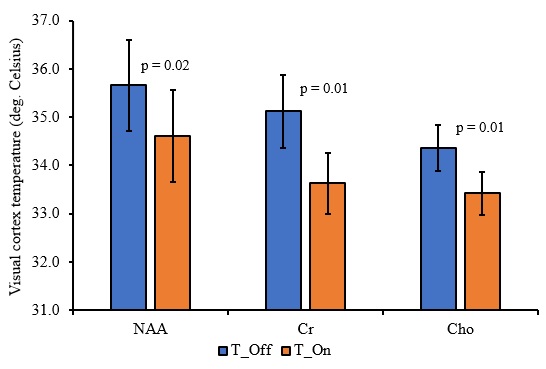
Results: Continuous neural activation was associated with significant decrease in visual cortex temperature.
Impact: Continuous neural activation of the visual cortex increases cerebral blood flow to the activated region, which helps dissipate heat from visual cortex tissues as observed in the consistent temperature reduction. The observed spectral changes indicate clear response to neural activation.
INTRODUCTION
Neural activation is associated with increased blood oxygenation level dependent (BOLD) contrast in magnetic resonance imaging (MRI) and spectroscopy (MRS). While the BOLD effect in MRI is observed as increased pixel intensity in corresponding activated regions, the effect in MRS is observed as increased spectral peak height and area, and decreased spectral peak width1. It is however unclear if a given neural activation paradigm has a link with temperature variation within the activated brain region. This study was therefore aimed to measure temperature of the visual cortex during visual stimulation in order to provide an understanding of the effect of neural activation on brain temperature.METHODS
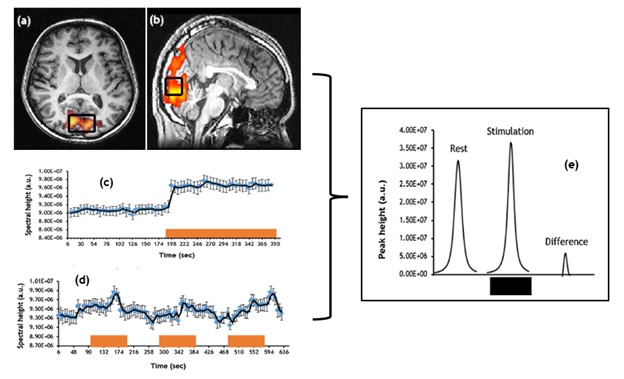
Four healthy volunteers (3 males/1 female, mean age ± SD = 32.3 ± 3.0 years) gave informed consent to participate in the ethically approved brain study. MR spectra were collected from the visual cortex (Figure 1a-b) of volunteers using single (Figure 1c) and continuous (Figure 1d) visual stimulation paradigms. The single activation paradigm comprised of showing to each volunteer a black screen (“Off”) followed by black/white pattern reversal checkerboard (“On”), each of 192 seconds duration (Figure 1c). The continuous activation paradigm comprised of showing volunteers an interleaved black screen and the black/white pattern reversal checkerboard each of duration 96 seconds, each order repeated three times (Figure 1d). Visual activation was achieved by presenting to each volunteer, through a lens ensemble, an in-house 8 Hz black/white pattern-reversal checkerboard played from a laptop computer. MR spectra were acquired (using the PRESS pulse sequence) by voxel positioning within a functional MRI guided activated visual cortex region (Figure 1a-b)2,3.Spectra were processed, and spectral height (ΔH%), full width at half maximum (Δυ1/2%) and area (ΔA%) were estimated (using SAGE v7) to determine their percentage changes from baseline (representing the BOLD change; Figure 1e). Subsequently, frequency shifts of the N-acetyl aspartate (NAA), creatine (Cr), and choline (Cho) spectral peaks relative to the water peak were calculated (using jMRUI) and used in pre-determined regression equations to determine visual cortex temperature (ΔT%) corresponding to the BOLD changes (T_Off versus T_On) in the NAA, Cr and Cho peaks. Percentage BOLD and temperature changes from baseline were significant at p < 0.05 by paired t-test. Associations between percentage BOLD and temperature changes were assessed by Pearson correlation test.
RESULTS
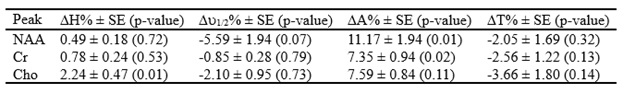
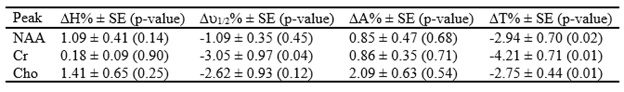
In the single activation paradigm (Table 1), only the percentage changes in the areas of the NAA (p = 0.01) and Cr (p = 0.02) peaks were significant, while the change in the height of the Cho peak was significant (p = 0.01). Temperature change was not statistically significant for BOLD changes in all three peaks (p > 0.05).In the continuous activation paradigm (Table 2), only the percentage change in the width of the Cr peak was significant (p = 0.04). However, percentage changes in temperature were statistically significant for BOLD changes in all the three peaks (p < 0.05).
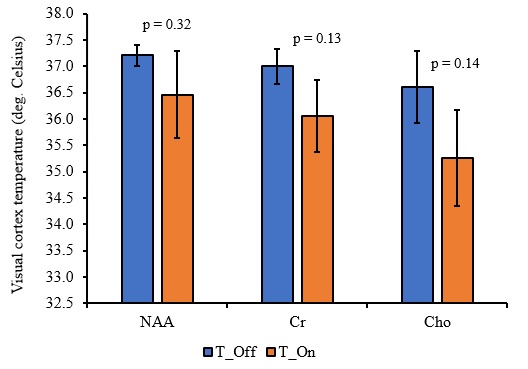
Generally, visual cortex temperature reduced with neural activation (Tables 1-2; Figures 2-3) and the reduction was statistically significant with the continuous (Figure 3), but not with the single, activation paradigm. However, the only female volunteer in the study showed rather increased visual cortex temperature with the single activation paradigm.
Only the percentage change in NAA peak height had a significant positive correlation with visual cortex temperature variation in the single activation paradigm (r = 0.998, p = 0.002).
DISCUSSION
As previously reported4, temperature reduction was observed with neural activation. However, this was significant with sustained stimulation which enhanced blood flow to the visual cortex. Though neural activation initially raises physiological state and temperature, when this is sustained, increased blood flow carries away heat from activated tissues, adjusting the temperature to lower levels which may in turn regulate brain activity5.CONCLUSION
The results suggest that continuous neural activation of the visual cortex in a block fashion increases cerebral blood flow to the activated region, which helps dissipate heat from visual cortex tissues as observed in the consistent reduction in temperature. The increased blood flow to the activated tissue however is observed as increased BOLD response in the spectra.Acknowledgements
We acknowledge the Scottish Imaging Network: A Platform for Scientific Excellence (SINAPSE) and the University of Glasgow, UK for funding the PhD of the lead author, part of which resulted in the functional MRS data analyzed in this study.
The authors wish to thank the University of Ghana Medical Centre (UGMC) for providing access to their MRI system for the brain temperature calibration study which resulted in the pre-determined regression equations. Special thanks go to Mr. George Nunoo, Head of Radiography, for his help with the data collection.
References
1. Zhu, X. H., & Chen, W. Observed BOLD effects on cerebral metabolite resonances in human visual cortex during visual stimulation: a functional 1H MRS study at 4 T. Magnetic Resonance in Medicine: An Official Journal of the International Society for Magnetic Resonance in Medicine. 2001;46(5):841-847.
2. Mumuni, A. N., & Mclean, J. Functional proton magnetic resonance spectroscopy of cerebral water and metabolites using eight radiofrequency excitations at 3.0 Tesla. EC Proteomics and Bioinformatics. 2017;1(1):7-18.
3. Mumuni, A. N., & McLean, J. Dynamic MR Spectroscopy of brain metabolism using a non-conventional spectral averaging scheme. Journal of neuroscience methods. 2017; 277:113-121.
4. Rango, M., Bonifati, C., & Bresolin, N. Post-activation brain warming: a 1-H MRS thermometry study. PLoS One. 2015;10(5): e0127314.
5. Kiyatkin, E. A. Brain temperature and its role in physiology and pathophysiology: Lessons from 20 years of thermorecording. Temperature. 2019;6(4):271-333.
Figures