1924
Measurement of metabolic changes in response to different types of visual stimulus using functional MRS at 5T1School of Biomedical Engineering, Shanghai Jiao Tong University, Shanghai, China, 2National Engineering Research Center of Advanced Magnetic Resonance Technologies for Diagnosis and Therapy (NERC-AMRT), Shanghai Jiao Tong University, Shanghai, China, 3United Imaging Healthcare, Shanghai, China, 4Department of Chemical and Biological Physics, Weizmann Institute of Science, Rehovot, Israel
Synopsis
Keywords: Neurotransmission, Spectroscopy
Motivation: Many types of visual stimuli were reported effective for visual perception. However, it’s uncertain whether certain types of visual stimuli illicit larger responses.
Goal(s): We aim to measure the metabolic changes in response to different types of visual stimuli to observe which types of visual stimuli can excite larger and more consistent responses.
Approach: We designed three different types of stimuli sessions ( non-sense images, houses, and faces) for visual stimulation and observed the metabolic changes in the fMRS data at 5T.
Results: Preliminary experiments show that compared to non-sense images and “no interesting” houses, faces stimulate larger responses with dynamic increase.
Impact: An fMRS study is implemented to measure the dynamic changes in response to different types of visual stimuli. Preliminary experiments indicate that faces stimulate larger responses.
Introduction
It has been widely reported that BOLD-fMRI activation is observed during visual stimulation [1-4]. However, it’s still uncertain whether certain visual stimuli illicit larger, more consistent responses than others. Functional MRS (fMRS) is one of the dynamic MRS methods capable of detecting endogenous metabolic changes in glutamate, GABA, and lactate in response to external visual, motor, or cognitive manipulation [5]. In this work, we conduct a preliminary experiment to measure the dynamic metabolic changes in response to different types of stimulus (e.g. non-sense images, houses, and faces) using fMRS at a 5T scanner.Theory and Methods
ParticipantsSix healthy volunteers (4 females and 2males) were enrolled in the current study. Exclusion criteria included history of stroke, seizures, severe vision problems, and metallic implants. All subjects complied with MRI safety guidelines and signed informed consent approved by the local ethics committee before each scanning session.
Visual Stimulation
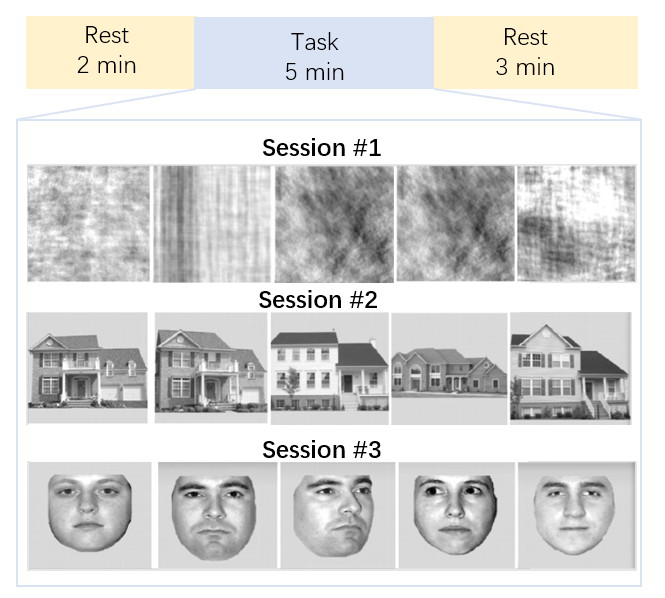
The fMRI and fMRS measurements were performed using a similar visual stimulus paradigm, which consists of 3 sessions. For fMRS experiments, each of the sessions contains 3 blocks REST1-TASK-REST2. The duration of REST1 block was 2 min and included 60 scans. The duration of REST2 block was 3 min and included 90 scans. A black background with a white fixation crosshair was displayed during all REST periods. The TASK period consisted of 5 blocks of 50 s visual stimulation interleaved with 10 s short rest duration (150 scans, 5 min in total). Three types of visual stimuli images flashing at a frequency of 2Hz were used in the TASK block of different sessions (session 1 - five non-sense images, session 2 - five houses, session 3 - five faces). For BOLD experiments, the stimulus images are the same as fMRS. Each session contains 3 consecutive cycles, with a task period of 30 s and a rest period of 30 s (3 min total scan time).
Acquisition and Processing
MR experiments were performed on a uMR Jupyter 5T magnet (United Imaging, Shanghai, China) with a 48-channel receive head coil. First, high-resolution anatomical MPRAGE images (TR/TE = 9.2/3.2 ms, matrix size = 368x316, FOV = 256x220 mm2) were acquired to visualize the structure of the occipital cortex. Then the BOLD-fMRI (multi-slice EPI, TR/TE = 2000/25 ms, FOV = 224x224 mm2, 75 slices) was performed to assist the positioning of the volume-of-interest (VOI) within the activated visual cortex. Finally, the functional 1H MRS measurements (TR/TE = 2000/60 ms,) were performed using the Hise sequence optimized for 5T, combined with VAPOR water suppression. The VOI (20×20×20 mm³) was carefully positioned in the visual cortex based on the anatomical landmarks discernible on MPRAGE images. The B0 shimming was performed automatically using the FASTMAP. The total duration of the fMRI/fMRS sessions was approximately 40 min. BOLD activation maps were calculated from the EPI BOLD data using a general linear model in SPM12 [6]. All spectral processing was carried out using the Visual Display Interface libraries [7].
Results and Discussion
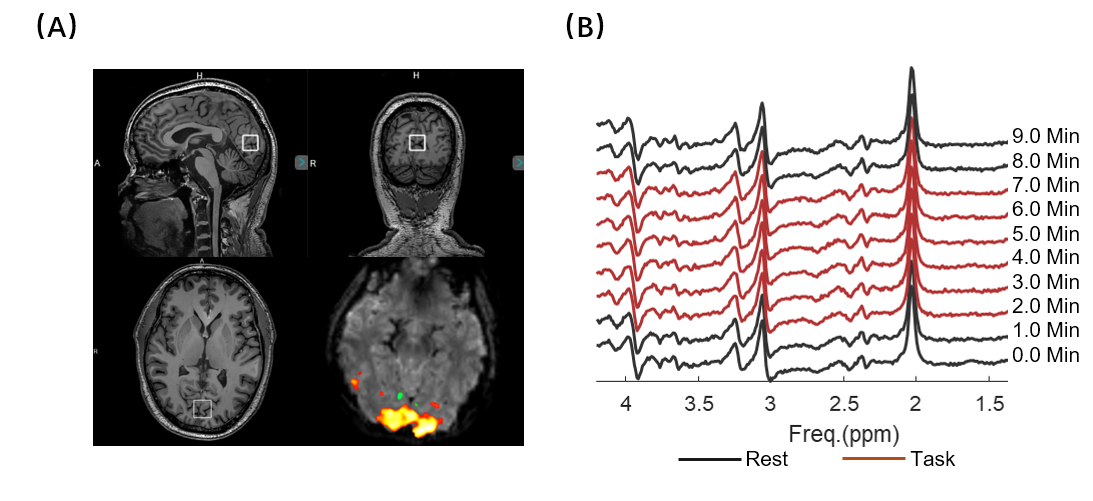
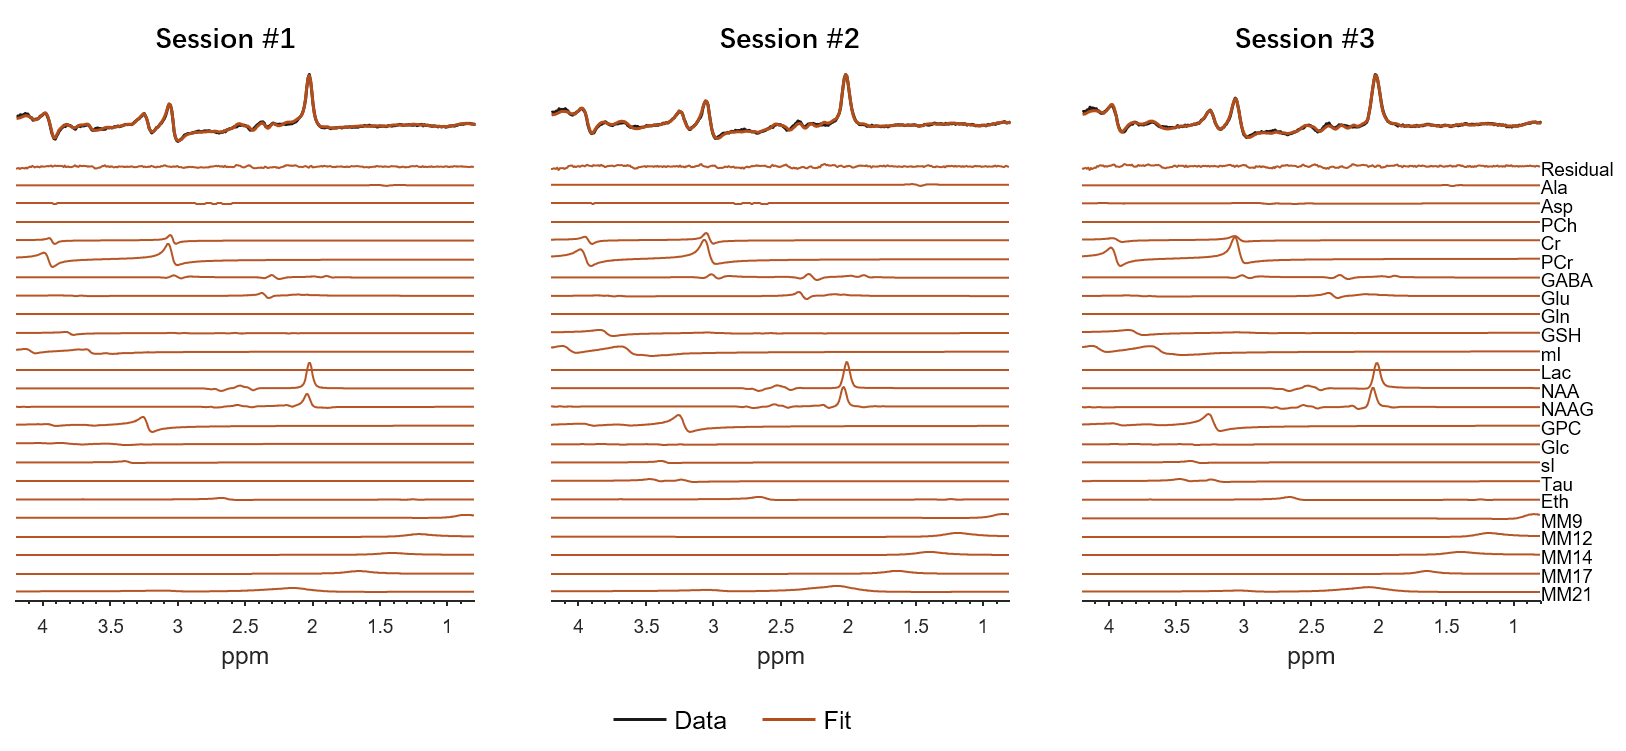
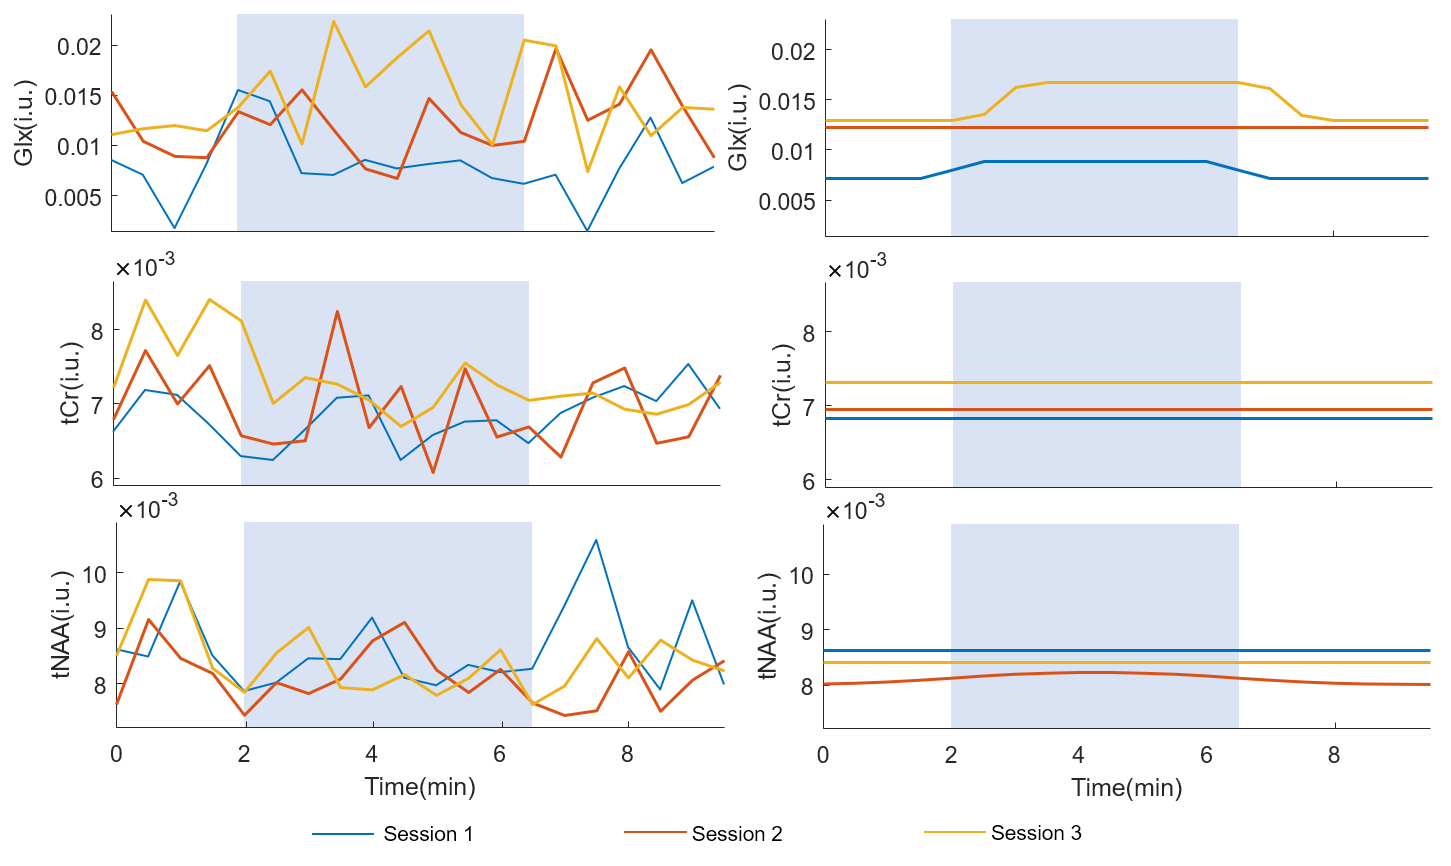
Figure 1 illustrates the schematic diagram of the fMRS visual stimulation paradigm. Figure 2 (A) shows MRS voxel placement and BOLD activation map. Figure 2 (B) shows one example of the fMRS data during visual stimulation. Figure 3 displays sample MRS data and VDI fits, residual, as well as the simulated individual basis functions of each session. This figure shows a spectrum from a single time point – i.e. the result of averaging 15 TRs (30s). It can be seen from the residual lines that the VDI fits the spectrums well.Figure 4 plots the meantime dynamics of Glx=Glu+Gln, tCr=Cr+PCr, and tNAA=NAA+NAAG for sessions 1, 2, and 3. We can see that there are no significant dynamic changes in tCr and tNAA in 3 different sessions. For Glx, compared to responses from session 1 (non-sense images) and session 2 (“no interesting” houses), the response from session 3 (faces) is larger with an around 20% dynamic increase. As the current dataset is not big enough, more participants will be collected for further statistical analysis.
Conclusions
Our study investigates the metabolic changes in response to three types of visual stimuli. Preliminary experiments show that compared to non-sense images and “no interesting” houses, faces stimulate larger responses with dynamic changes. More subjects will be collected for further analysis in the future.Acknowledgements
This work is supported by the National Natural Science Foundation of China National Science Foundation of China (No. 62001290 and 62301309), Shanghai Science and Technology Development Funds (21DZ1100300) and sponsored by the National Science and Technology Innovation 2030 Major Project (2022ZD0208601).References
[1] Haxby J V, Gobbini M I, Furey M L, et al. Distributed and overlapping representations of faces and objects in ventral temporal cortex[J]. Science, 2001, 293(5539): 2425-2430.
[2] Uludağ K. Transient and sustained BOLD responses to sustained visual stimulation[J]. Magnetic resonance imaging, 2008, 26(7): 863-869.
[3] Ishai A, Ungerleider L G, Martin A, et al. Distributed representation of objects in the human ventral visual pathway[J]. Proceedings of the National Academy of Sciences, 1999, 96(16): 9379-9384.
[4] Levy I, Hasson U, Avidan G, et al. Center–periphery organization of human object areas[J]. Nature neuroscience, 2001, 4(5): 533-539.
[5] Tal A. The future is 2D: spectral-temporal fitting of dynamic MRS data provides exponential gains in precision over conventional approaches [J]. Magnetic Resonance in Medicine, 2022.
[6] Statistical parametric mapping: the analysis of functional brain images[M]. Elsevier, 2011.
[7] Liu Y, Oeltzschner G, Ronen I, et al. Visual Display Interface (VDI): A MATLAB Software Library For Simulating and Processing In-Vivo Magnetic Resonance Spectroscopy and Spectroscopic Imaging Data[J]. medRxiv, 2023: 2023.08. 31.23294888.
Figures