1923
Association between Long Range Temporal Correlations in Functional MRI BOLD signal and the Excitatory / Inhibitory Metabolites Ratio1University of British Columbia, Vancouver, BC, Canada, 2BC Children's Hospital Research Institute, Vancouver, BC, Canada
Synopsis
Keywords: Neurotransmission, Spectroscopy, Hurst Exponent, Excitatory-Inhibitory Balance, Brain Criticality
Motivation: Animal and computational studies have been used as a basis to assume a link between excitatory-inhibitory (E/I) ratio and Hurst exponent (H) in the human brain; however, it has yet to be sufficiently demonstrated in healthy human subjects.
Goal(s): We seek to test the E/I-Hurst link in the visual cortex during rest and movie-watching.
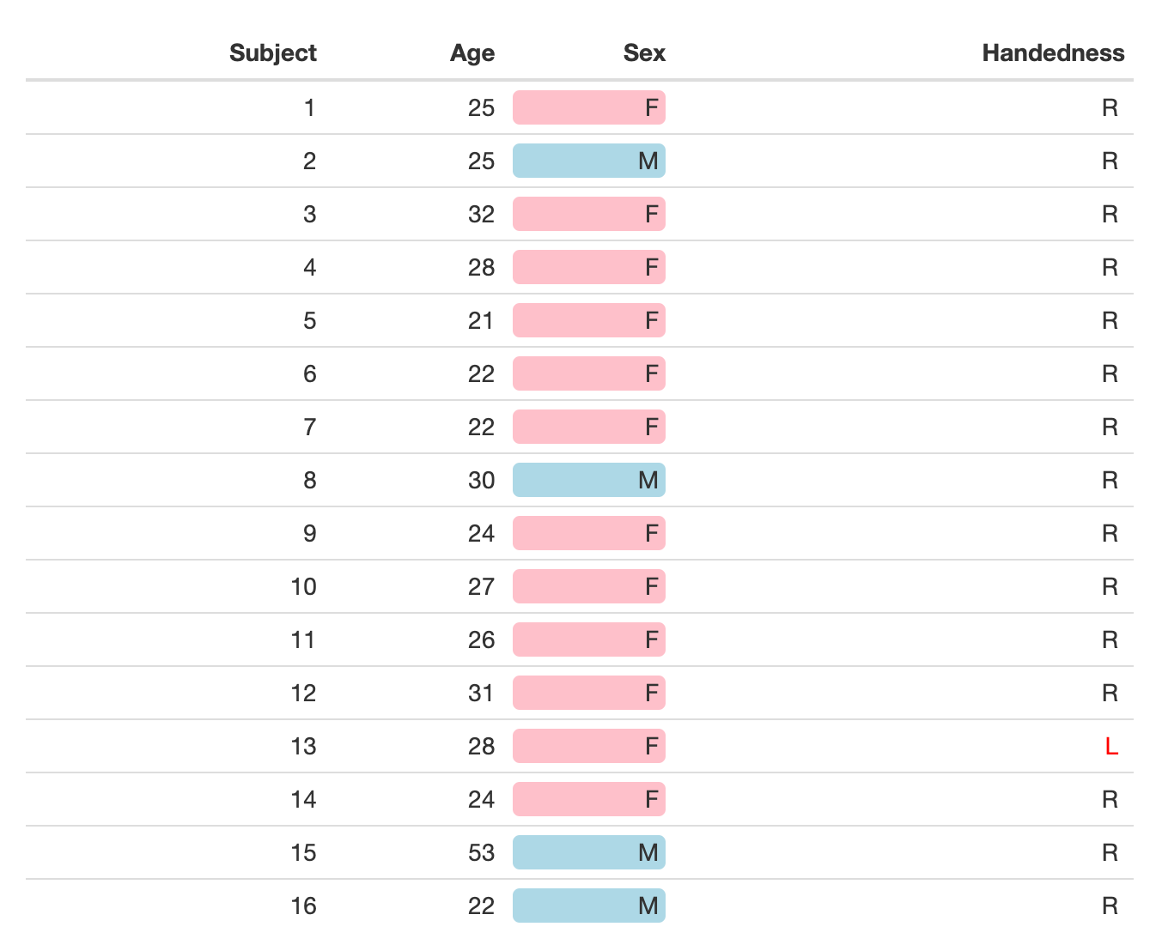
Approach: Multi-echo functional MRI, sLASER, and MEGAPRESS sequences are used in 17 healthy human adults (ages 21-53 years; 13 female, 4 male) with MRS voxel ROI in visual cortex.
Results: E/I and Hurst are not significantly correlated in either the MRS voxel ROI or visual network.
Impact: Hurst exponent (H) is assumed to correlated with excitatory-inhibitory (E/I) ratio without sufficient human evidence. Given the role of E/I imbalance in neuropsychiatric illness and the technical difficulty to measure it, understanding if H acts as its proxy is critical.
Introduction
Excitatory-inhibitory (E/I) ratio estimates the balance of excitatory-to-inhibitory neuronal activity.1 It has been conceptualized in two main ways: either as measured synaptic currents; or as the ratio of excitatory-to-inhibitory neurotransmitter concentration.2 Since E/I is thought to be driven by the relative number and activity of glutaminergic compared to GABAergic neurons, it is often conceptualized as the ratio of glutamate-to-GABA.1E/I is understood to affect signal-to-noise ratio (SNR) in neuronal signalling.1 High E/I—caused by either disproportionately elevated excitation or depressed inhibition—results in noisy neuronal activity, which in turn is related to abnormal perception, cognition, and motor control.1 Disrupted E/I balance is thought to underlie many neuropsychiatric conditions, most notably autism, schizophrenia, and Alzheimer’s disease.1,3–6
Consequently, effective E/I measurement is critical to the study of highly impactful and poorly understood conditions. Direct measures of E/I using non-invasive in-vivo imaging techniques, e.g. magnetic resonance spectroscopy (MRS), is technically challenging with limited spatial resolution. GABA estimation is especially elusive, owing to its low baseline concentration and overlapping peak with other metabolites.7,8 Recently, computational research and animal studies have suggested that E/I can be estimated from the blood-oxygen-level-dependent (BOLD)-derived Hurst exponent (H) – a measure of BOLD’s long-range temporal correlation.9–13 This ‘E/I-Hurst’ hypothesis has been applied in recent research studies in autism spectrum disorder (ASD).14–16
The Hurst exponent is a power law exponent derived from fMRI’s BOLD signal.17 It varies between 0 and 1, with H > 0.5 being positively auto-correlated (long-term memory) and ordered, and H < 0.5 being negatively auto-correlated and disordered.17,18 Like E/I, disrupted H seems to reflect changes in brain function and health.18 It is reasonable to assume that E/I, which drives SNR in neuronal signalling, is related to H, a measure of ordered complex signalling. However, while this relation has been applied in ASD, it has yet to be sufficiently demonstrated in human subjects. Building on our previous work on H during movie-watching,18 we seek to test the E/I-Hurst link in the visual cortex during rest and movie-watching.
Methods
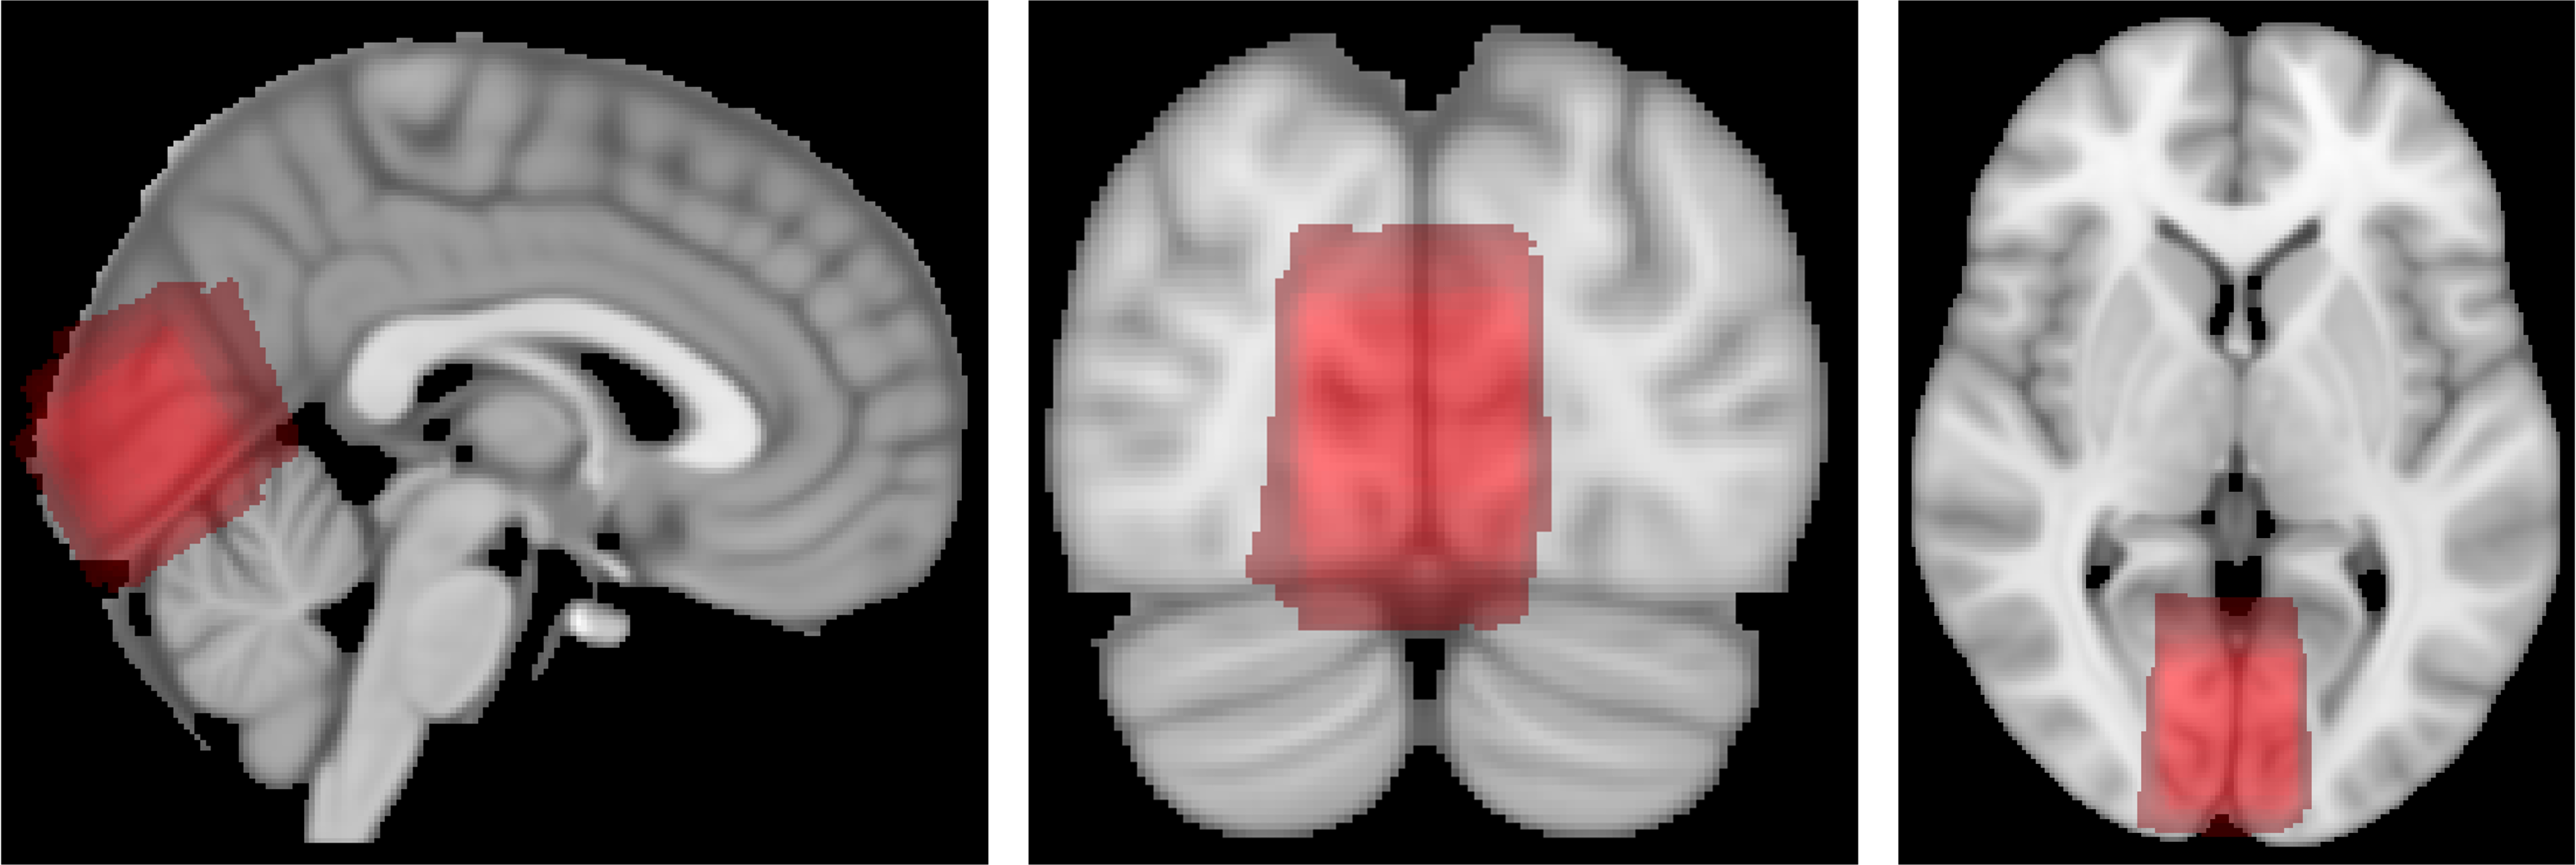
E/I and H were estimated in the visual cortex of healthy adults (n=13 females, 4 males; 21-53 years). Participants underwent scanning in a 3T GE MRI. Scan sequences were collected during rest (~24 minutes), then during a movie-watching task (~24 minutes). MRI sequences include: (1) 3D T1-weighted anatomical scan; resolution 0.9x0.9x0.9 mm3, (2) three-echo fMRI; resolution 3.5x3.5x3.5 mm3; TR=1.5 s, TEs=12.2, 35.4, 58.5 ms; and 430 volumes, (3) single-voxel semi-LASER MRS sequence; voxel size 2.8x2.8x2.8 cm3, (4) single-voxel MEGA-PRESS MRS sequence; voxel size 2.8x2.8x2.8 cm3. Voxels were centred on the calcarine fissure in the visual cortex (Fig. 2). fMRI scans were preprocessed with FastSurfer, fmriprep, and tedana. H was calculated per voxel using Welch’s method by estimating the slope of the power spectral density between 0.01 and 0.1 Hz, and averaged in the visual cortex voxel and Yeo’s 2011 Visual Network (VN).19 To verify protocol accuracy, amplitude of low frequency (0.01-0.08 Hz) fluctuations (ALFF) of the BOLD signal was calculated in the same regions and frequency range.20 MRS spectra were generated using Osprey, LCModel, and Gannet (MEGA-PRESS only). Resulting measures were analyzed using paired t-test.Results
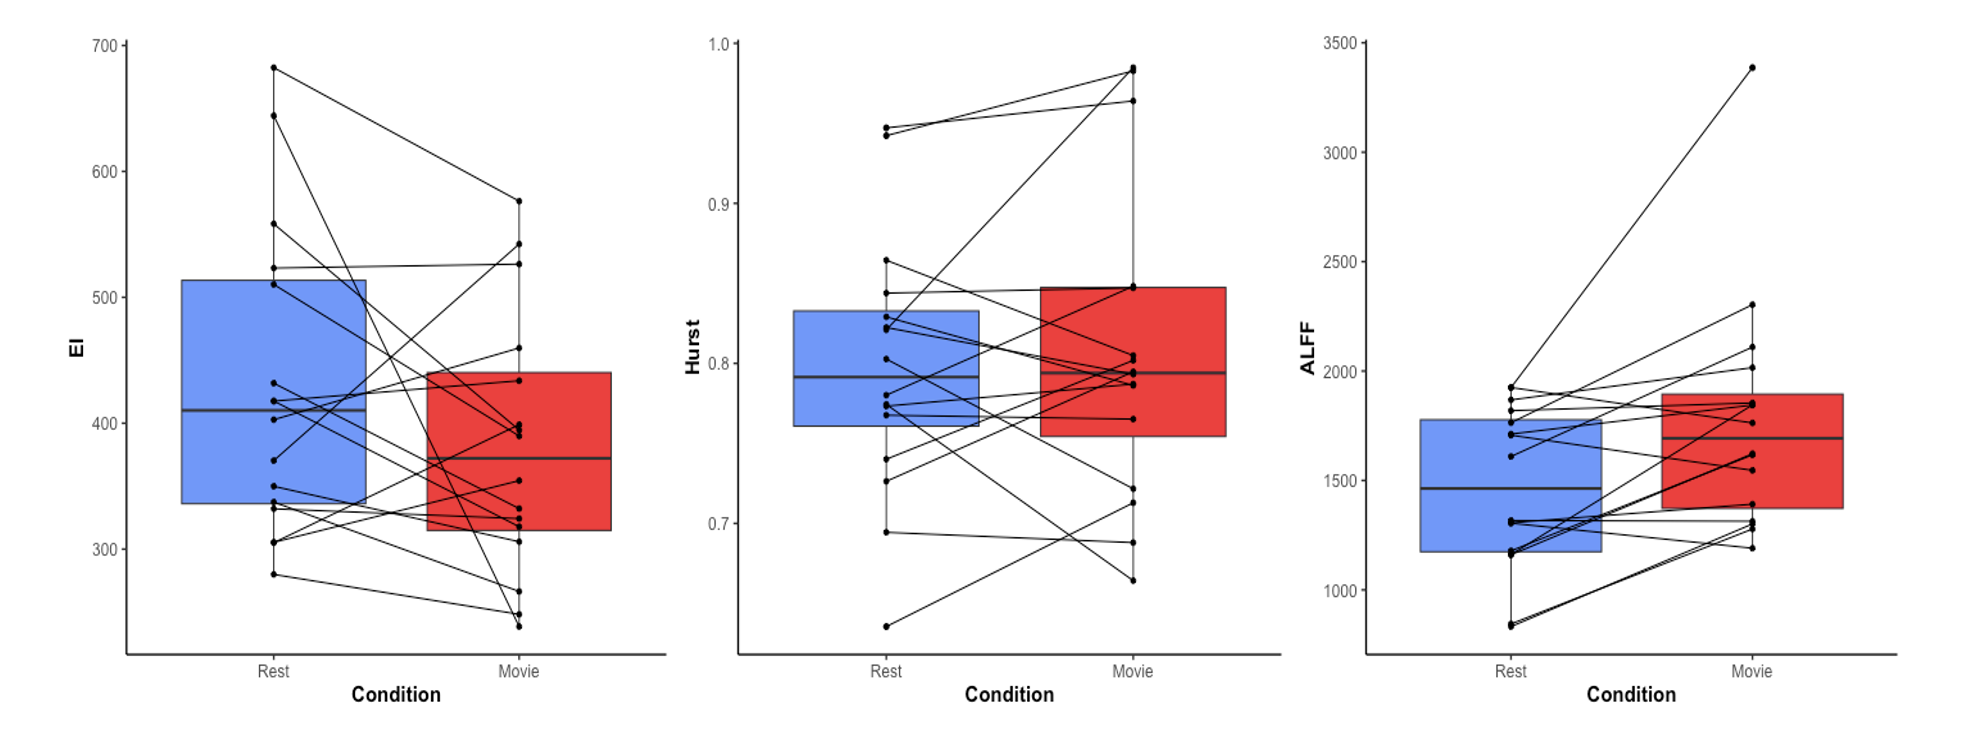
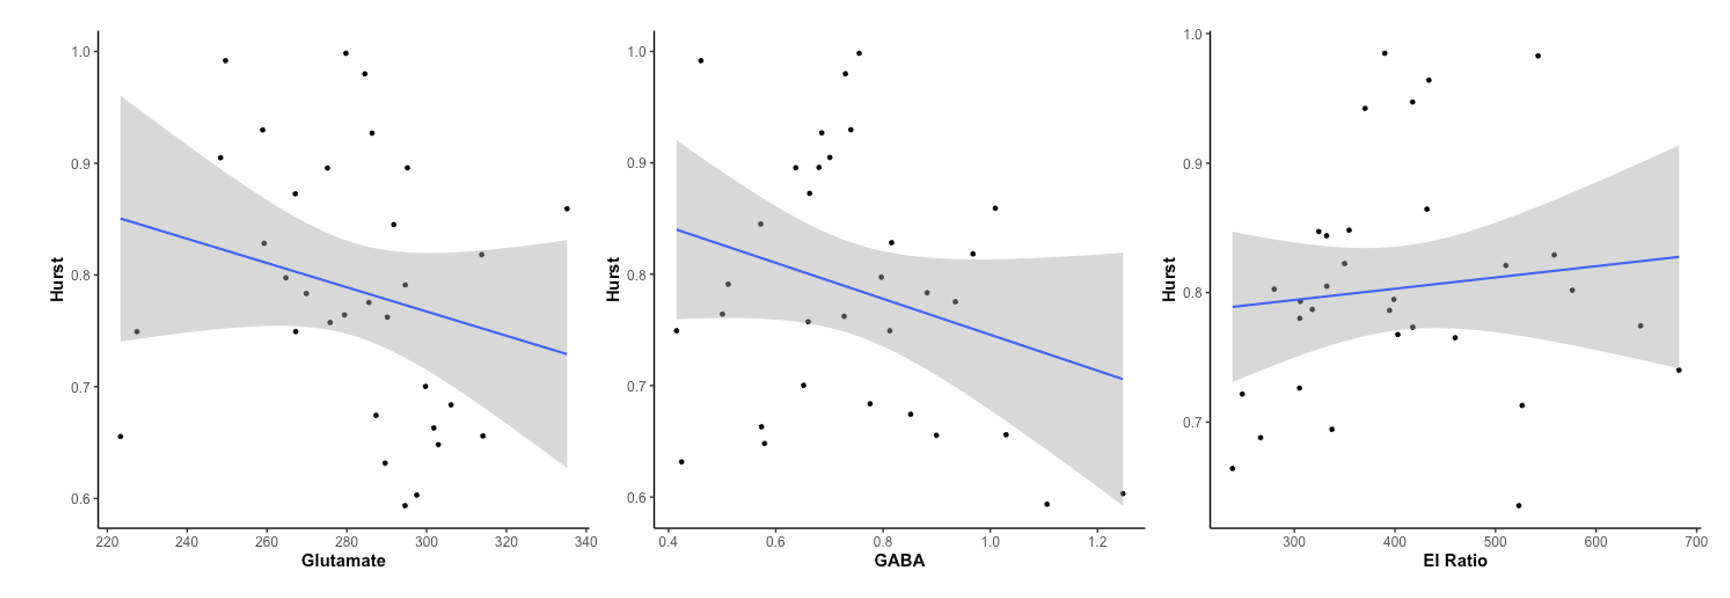
ALFF increased significantly between rest and movie-watching for all subjects in both the MRS voxel ROI and VN (p < 0.01). Glutamate, GABA, E/I, and H in the MRS voxel ROI, however, did not change significantly between conditions (Fig. 3-4). Expanding H analysis from the MRS voxel ROI to VN did not result in a significant difference. ROI-averaged ALFF and H showed no correlation. E/I, Glutamate, and GABA were not significantly correlated with H in either condition or combined (Fig. 5).Discussion and Conclusion
Linear combination spectra results, and subsequent analysis of phantom scans suggest the proposed protocol accurately captures Glu and GABA at physiological concentrations. MRS results are congruent with previous studies finding no difference between Glu and GABA during visual tasks.21 Two studies have reported a link between ALFF and H (r=~0.7).18,22 Work is ongoing to investigate why no correlation was found, but differences in fMRI acquisition and processing may be responsible. Our previous study found increased H in the visual network between rest and movie-watching.18 However, 79 participants would be needed to replicate its effect size: H may produce changes too subtle to detect with our sample size and protocol. Our results do not support H as a proxy for E/I in the healthy adult human brain: for past and future studies to suggest linked H and E/I, stronger evidence from in-vivo human studies is required.Acknowledgements
We would like to acknowledge the BC Children's Research Institute, along with the Institute's MRI Research Facility.References
1. Rubenstein JLR, Merzenich MM. Model of autism: increased ratio of excitation/inhibition in key neural systems. Genes Brain Behav. 2003;2(5):255-267.
2. He H Yan, Cline HT. What Is Excitation/Inhibition and How Is It Regulated? A Case of the Elephant and the Wisemen. J Exp Neurosci. 2019;13:1179069519859371. doi:10.1177/1179069519859371
3. Ajram LA, Pereira AC, Durieux AMS, Velthius HE, Petrinovic MM, McAlonan GM. The contribution of [1H] magnetic resonance spectroscopy to the study of excitation-inhibition in autism. Progress in Neuro-Psychopharmacology and Biological Psychiatry. 2019;89:236-244. doi:10.1016/j.pnpbp.2018.09.010
4. Brix MK, Ersland L, Hugdahl K, et al. Brain MR spectroscopy in autism spectrum disorder—the GABA excitatory/inhibitory imbalance theory revisited. Frontiers in Human Neuroscience. 2015;9. Accessed January 10, 2023. https://www.frontiersin.org/articles/10.3389/fnhum.2015.00365
5. Canitano R, Pallagrosi M. Autism Spectrum Disorders and Schizophrenia Spectrum Disorders: Excitation/Inhibition Imbalance and Developmental Trajectories. Front Psychiatry. 2017;8:69. doi:10.3389/fpsyt.2017.00069
6. Maestú F, de Haan W, Busche MA, DeFelipe J. Neuronal excitation/inhibition imbalance: core element of a translational perspective on Alzheimer pathophysiology. Ageing Research Reviews. 2021;69:101372. doi:10.1016/j.arr.2021.101372
7. Harris AD, Puts NAJ, Edden RAE. Tissue correction for GABA-edited MRS: Considerations of voxel composition, tissue segmentation, and tissue relaxations. Journal of Magnetic Resonance Imaging. 2015;42(5):1431-1440. doi:10.1002/jmri.24903
8. Choi IY, Lee SP, Merkle H, Shen J. In vivo detection of gray and white matter differences in GABA concentration in the human brain. NeuroImage. 2006;33(1):85-93. doi:10.1016/j.neuroimage.2006.06.016
9. Gao R, Peterson EJ, Voytek B. Inferring synaptic excitation/inhibition balance from field potentials. NeuroImage. 2017;158:70-78. doi:10.1016/j.neuroimage.2017.06.078
10. Lombardi F, Herrmann HJ, de Arcangelis L. Balance of excitation and inhibition determines 1/f power spectrum in neuronal networks. Chaos: An Interdisciplinary Journal of Nonlinear Science. 2017;27(4):047402. doi:10.1063/1.4979043
11. Baumgarten L, Bornholdt S. Critical excitation-inhibition balance in dense neural networks. Phys Rev E. 2019;100(1):010301. doi:10.1103/PhysRevE.100.010301
12. Poil SS, Hardstone R, Mansvelder HD, Linkenkaer-Hansen K. Critical-State Dynamics of Avalanches and Oscillations Jointly Emerge from Balanced Excitation/Inhibition in Neuronal Networks. J Neurosci. 2012;32(29):9817-9823. doi:10.1523/JNEUROSCI.5990-11.2012
13. Deco G, Jirsa VK, McIntosh AR. Resting brains never rest: computational insights into potential cognitive architectures. Trends in Neurosciences. 2013;36(5):268-274. doi:10.1016/j.tins.2013.03.001
14. Bruining H, Hardstone R, Juarez-Martinez EL, et al. Measurement of excitation-inhibition ratio in autism spectrum disorder using critical brain dynamics. Sci Rep. 2020;10(1):9195. doi:10.1038/s41598-020-65500-4
15. Manyukhina VO, Prokofyev AO, Galuta IA, et al. Globally elevated excitation–inhibition ratio in children with autism spectrum disorder and below-average intelligence. Molecular Autism. 2022;13(1):20. doi:10.1186/s13229-022-00498-2
16. Trakoshis S, Martínez-Cañada P, Rocchi F, et al. Intrinsic excitation-inhibition imbalance affects medial prefrontal cortex differently in autistic men versus women. eLife. 9:e55684. doi:10.7554/eLife.55684
17. Beggs J, Timme N. Being Critical of Criticality in the Brain. Frontiers in Physiology. 2012;3. Accessed May 3, 2023. https://www.frontiersin.org/articles/10.3389/fphys.2012.00163
18. Campbell O, Vanderwal T, Weber AM. Fractal-Based Analysis of fMRI BOLD Signal During Naturalistic Viewing Conditions. Frontiers in Physiology. 2022;12. Accessed August 31, 2023. https://www.frontiersin.org/articles/10.3389/fphys.2021.809943
19. Thomas Yeo BT, Krienen FM, Sepulcre J, et al. The organization of the human cerebral cortex estimated by intrinsic functional connectivity. J Neurophysiol. 2011;106(3):1125-1165. doi:10.1152/jn.00338.2011
20. Zou QH, Zhu CZ, Yang Y, et al. An improved approach to detection of amplitude of low-frequency fluctuation (ALFF) for resting-state fMRI: Fractional ALFF. Journal of Neuroscience Methods. 2008;172(1):137-141. doi:10.1016/j.jneumeth.2008.04.012
21. Pasanta D, He JL, Ford T, Oeltzschner G, Lythgoe DJ, Puts NA. Functional MRS studies of GABA and glutamate/Glx – A systematic review and meta-analysis. Neuroscience & Biobehavioral Reviews. 2023;144:104940. doi:10.1016/j.neubiorev.2022.104940
22. Taylor PA, Gohel S, Di X, Walter M, Biswal BB. Functional Covariance Networks: Obtaining Resting-State Networks from Intersubject Variability. Brain Connect. 2012;2(4):203-217. doi:10.1089/brain.2012.0095
Figures