1922
Changes in GABA and Glutamate levels with peripheral and central visual stimulation using functional magnetic resonance spectroscopy at 7T1Stevens Neuroimaging and Informatics Institute, Keck School of Medicine, University of Southern California, Los Angeles, CA, United States
Synopsis
Keywords: Neurotransmission, Spectroscopy, Functional MRS
Motivation: Changes in GABA and Glutamate associated with positive/negative BOLD activation in the visual cortex due to central and peripheral stimulation of the visual field are measured with functional MRS.
Goal(s): How does stimulation of the central visual field affects concentrations of excitatory and inhibitory neurotransmitters and could these changes be consistent with negative and positive BOLD activation?
Approach: An fMRS paradigm was applied on four volunteers to measure average changes in GABA and Glu due to alternating periods of central and peripheral visual stimulation, using a non-edited semi-LASER sequence.
Results: GABA decreased on average with peripheral stimulation while Glutamate showed an inconsistent trend.
Impact: Indirect effects of negative and positive BOLD activation can be explored with functional MRS by measuring changes of GABA (inhibitory) and Glutamate (excitatory) neurotransmitters in the visual cortex resulting from central and peripheral stimulation of the visual field.
Introduction
The primary visual cortex receives topographical projections from the retina. The visual cortex corresponding to the fovea of the eye is activated by stimulation of the central visual field, and is deactivated or shows negative BOLD signals with stimulation of the peripheral visual field1,2 The positive and negative BOLD activation has been hypothesized to induce a differential between the levels of excitatory and inhibitory neurotransmitters, with glutamate (Glu) increasing with central visual stimulation and γ-aminobutyric acid (GABA) increasing due to peripheral stimulation. In this study, we measure GABA and Glu in the fovea area of the primary visual cortex (V1) as a function of central or peripheral visual stimulation using a functional magnetic resonance spectroscopy (fMRS) paradigm. We show a decreasing trend in GABA resulting from central visual stimulation, and an increasing trend in GABA with peripheral stimulation. We also perform a test-retest reliability analysis of GABA and Glu levels detected during two separate experiments applying peripheral stimulation. The ability of fMRS to reliably measure excitatory-inhibitory neurotransmitter imbalances is important for probing the biochemical progression of various neurological disorders3,4.Methods
Data were acquired from four healthy volunteers (32±4.9y/o) using a Siemens 7T Terra scanner with a 8Tx/32Rx head coil. A 3D MP2RAGE acquisition (TR/TI1/TI2=5/0.8/2.5s, resolution 1.1×1.1×1.0mm3) was used for planning the measurements. A non-edited semi-LASER sequence5 with VAPOR water suppression6 and TR=4s was used to measure spectra from a 3mL voxel placed in the pole of the striate visual cortex (Figure 1). The particular V1 volume in the visual cortex is activated with central stimulation of the fovea, and spectra were measured under conditions of central and peripheral visual stimulation (Figure 2). A total of three datasets were acquired with TE=80ms and two with TE=29ms (one subject was repeated twice). Each dataset consisted of three experiments (runs): two with peripheral and one with central stimulation. A single run consisted of 12 alternating periods (blocks), each 48 seconds long, of active (ON) and inactive (OFF) states (Figure 3). Each block contained 12 averages, resulting in a cumulative of 72 averages for each of the ON or OFF states within one run, and a scan duration of 10 minutes per run. The total scan time was 30 minutes per subject (further information is described in Figure 3).Spectra were processed in MATLAB and quantified with LC Model7 using appropriate bases for the given TE. Percent differences between the OFF and ON states were computed for GABA, Glu, glutamine (Gln), and Glx (Glu+Gln). To evaluate the test-retest reliability of the two runs with peripheral visual stimulation, the intraclass correlation coefficients (ICCs) of GABA and Glu concentrations from the five scan sessions for all subjects were calculated, separately for the ON and OFF states, respectively.
Results
The average percent difference values for GABA show an increasing trend (+3 to +11%) due to peripheral visual stimulation. Conversely, GABA tends to decrease with central visual stimulation (-14%) (Table 1(A)). Overall, the percent differences for Glu show less definitive trends, although those for Glx indicate a stable level of Glu+Gln during both peripheral and central stimulation. As an indication of good test-retest reliability for the peripheral stimulation runs, the ICC for GABA was 0.81 and 0.79 for the ON and OFF states, respectively (Table 1(B)). Glu showed comparatively lower ICCs with 0.52 and 0.76 for the ON and OFF states, respectively. Average Cramer-Rao lower bound (CRLB) values from LC Model quantitation indicated good reliability of the spectral fits for GABA and Glu, where most CRLBs were below 30%.Discussion
Consistent with its role as an inhibitory neurotransmitter, GABA concentration was shown to decrease, on average, when the fovea was directly engaged during central visual stimulation. Conversely, there is an average increase in GABA with peripheral stimulation, which may correlate with inhibition of the fovea by peripheral stimulation. However, the corresponding expected increase in Glu during central stimulation was not observed although Gln and Glx do have modest, though insignificant, increases. Likewise, the changes in GABA are not statistically significantConclusion
As hypothesized, average GABA levels were shown to decrease in the fovea of V1 with peripheral visual stimulation. However, trends in Glu changes were inconsistent. Further optimization of the fMRS paradigm and pulse sequence parameters such as the choice of long or short TE (e.g., 80 vs 29 ms) is expected to improve the detection of changes in GABA and Glu in the visual cortex associated with stimulation of the fovea. In general, accurately detecting abnormal balances of GABA and Glu could inform on the biochemical process underlying various neurological disorders.Acknowledgements
The authors would like to thank Dr. Lana G. Kaiser for helpful discussions on the spectral acquisition.References
1. Bressler D, Spotswood N, Whitney D. Negative BOLD fMRI response in the visual cortex carries precise stimulus-specific information. PLoS One (2007); 2(5):e410.
2. de la Rosa N, Ress D, Taylor AJ et al. Retinotopic variations of the negative blood-oxygen-level dependent hemodynamic response function in human primary visual cortex. Journal of Neurophysiology (2021); 125(4): 1045-1057.
3. Lin Y, Stephenson MC, Xin L et al. Investigating the metabolic changes due to visual stimulation using functional proton magnetic resonance spectroscopy at 7T. Journal of Cerebral Flow & Metabolism (2012); 32: 1484-1495.
4. Ip IB, Bridge H. Investigating the neurochemistry of the human visual system using magnetic resonance spectroscopy. Brain Structure and Function (2022); 227(4):1491-505.
5. Deelchand DK, Berrington A, Noeske R et al. Across‐vendor standardization of semi‐LASER for single‐voxel MRS at 3T. NMR in Biomedicine (2021); 34(5): e4218.
6. Tkac I, Starcuk Z, Choi IY et al. In Vivo 1H NMR Spectroscopy of Rat Brain at 1 ms Echo Time. Magnetic Resonance in Medicine (1999); 41:649-656.
7. Provencher SW. Estimation of metabolite concentrations form localized in vivo proton NMR spectra. Magnetic Resonance in Medicine (1993); 30(6):672-679.
Figures
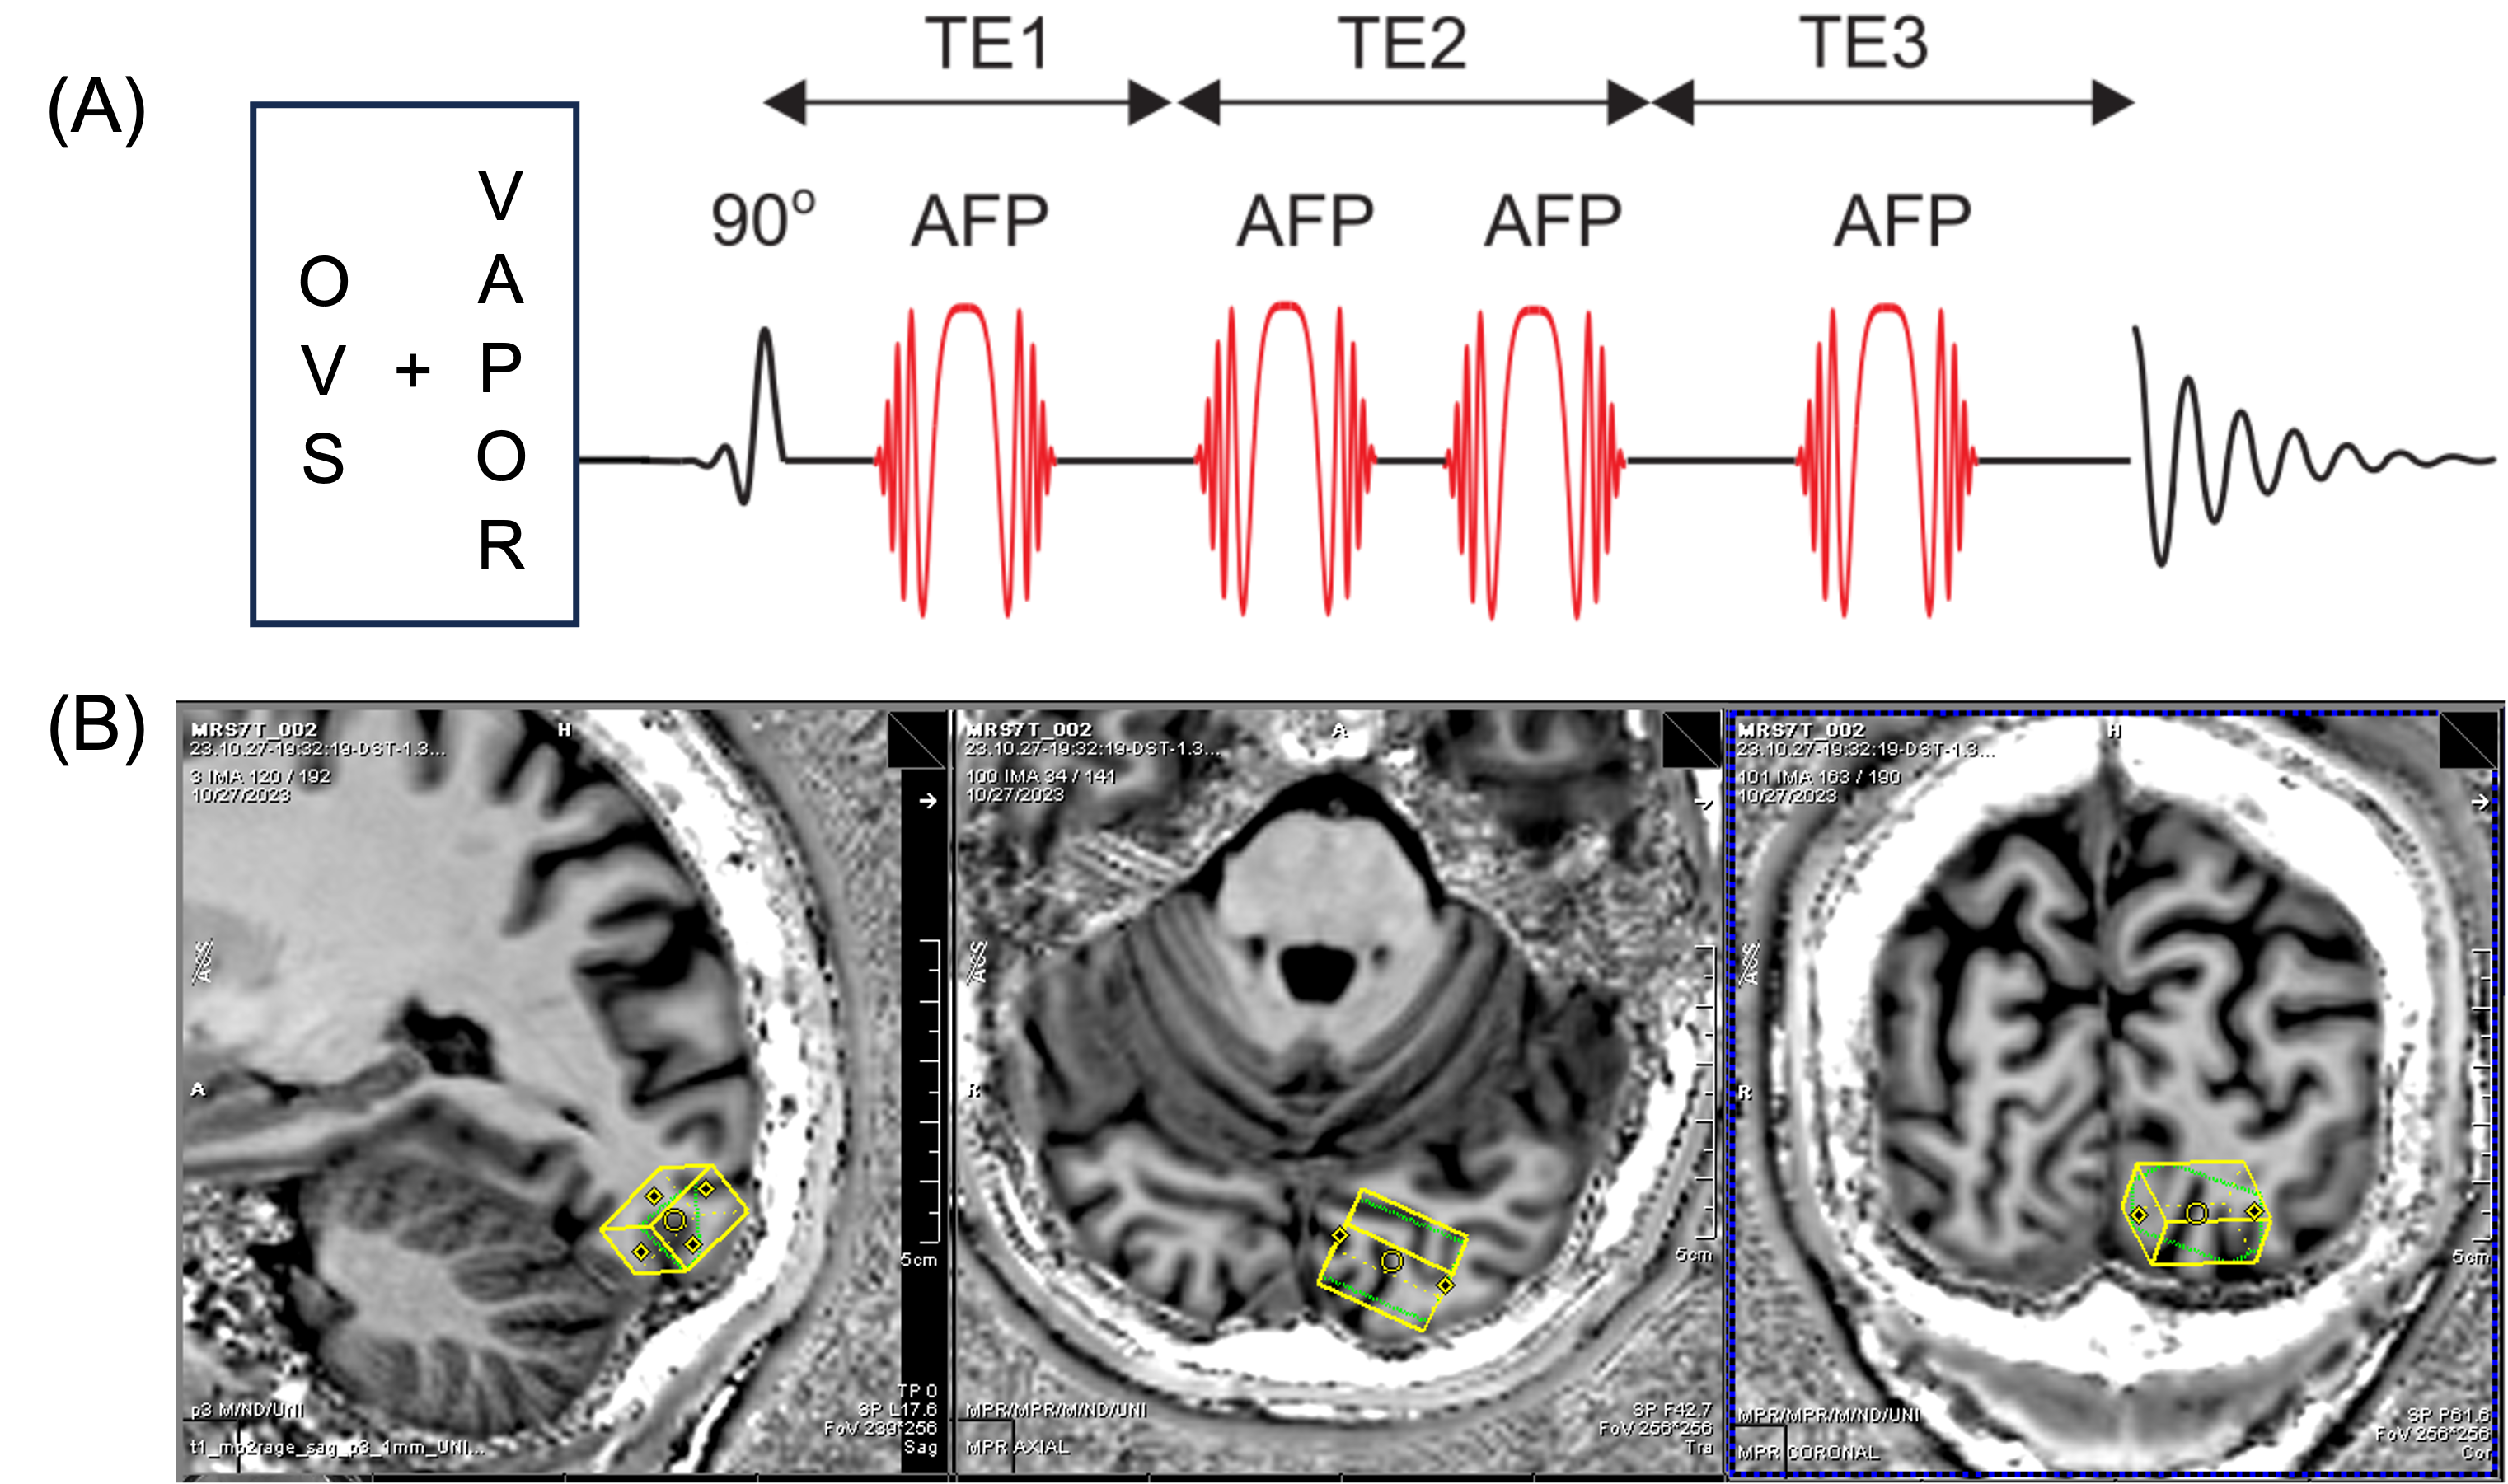
Figure 1: (A) A non-edited semi-LASER sequence5 with outer volume saturation (OVS) and VAPOR water suppression was used to acquire fMRS data with TR=4s, and TE=29ms (TE1=9ms, TE2=10ms and TE3=10ms) and TE = 80 ms (TE1=10ms, TE2=10ms and TE3=60ms). (B) A 3mL voxel (10mm (AP) × 20mm (RL) × 15mm (SI)) was placed in the pole of the striate visual cortex which is activated with central visual stimulation of the eye fovea. A total of 72 averages were acquired for each of the ON and OFF states of central or peripheral visual stimulation.
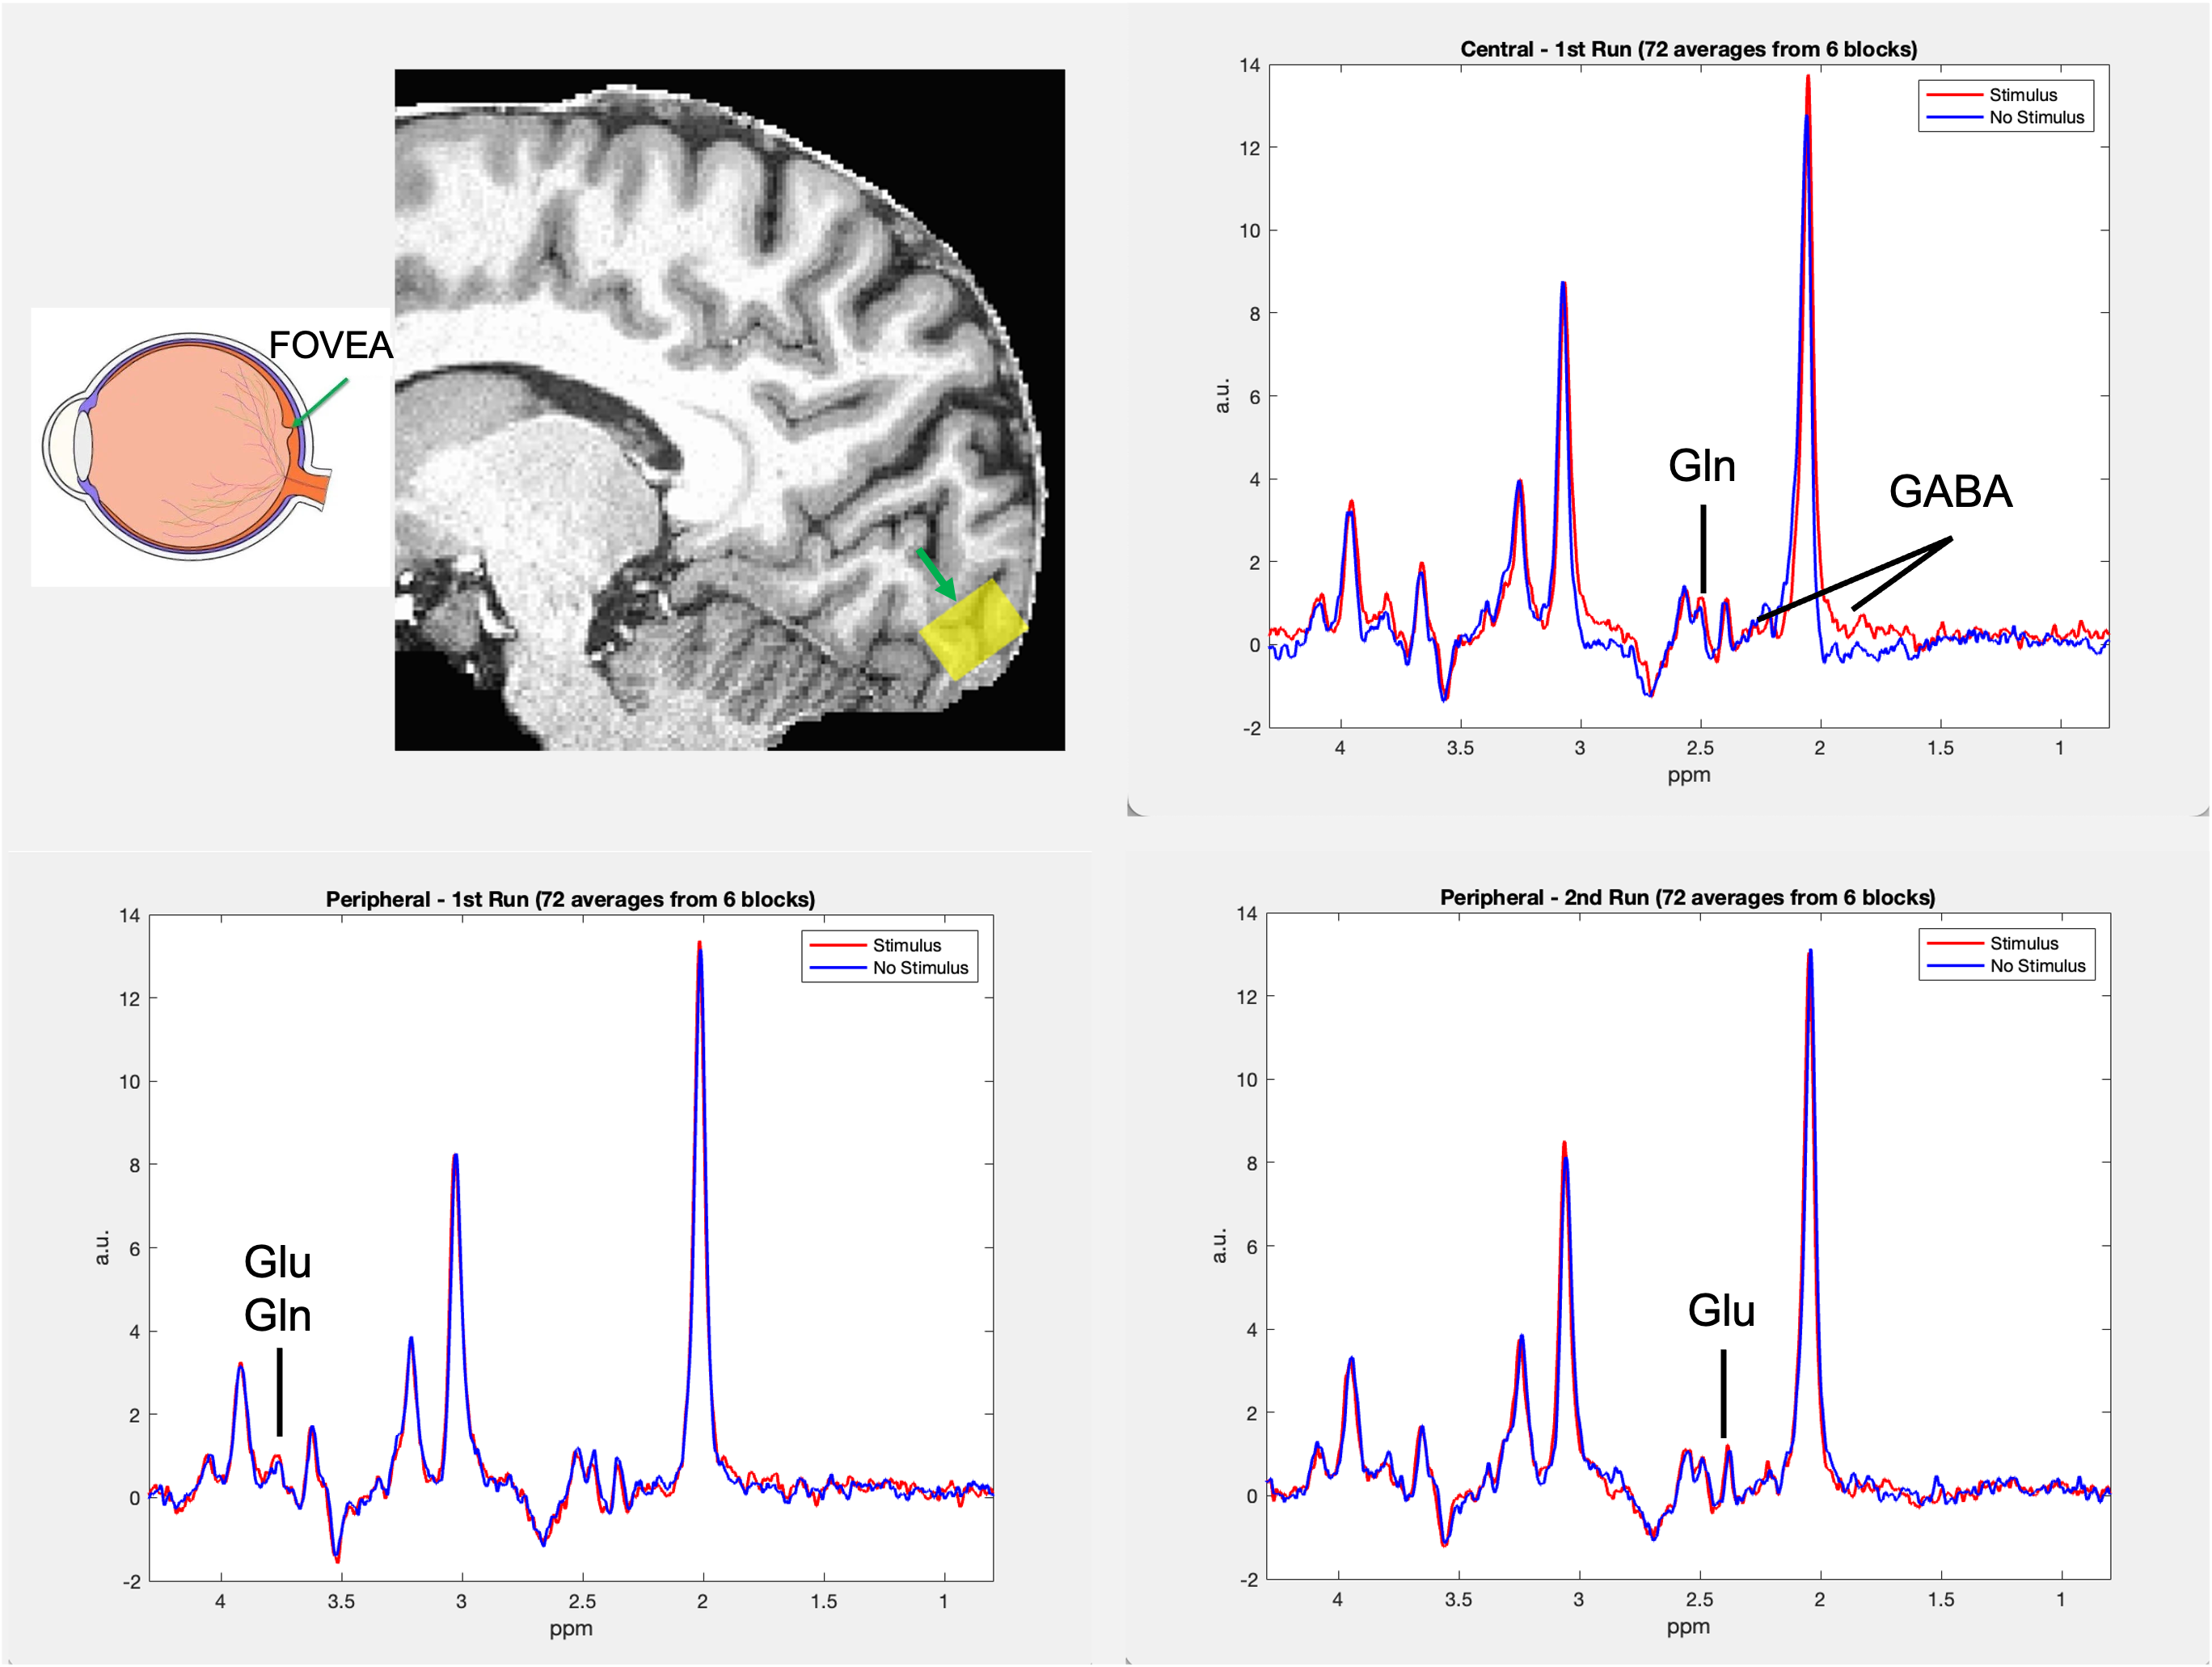
Figure 2: The fovea centralis of the eye, located near the center of the retina, is most sensitive to central visual stimuli. Visual signals from the fovea correlate with activation of the V1 volume in the striate visual cortex (shaded pink and indicated with green arrow), where the volume of interest was placed. Spectra were measured under conditions of central and peripheral stimulation, both under conditions of active (ON) and non-active (OFF) stimulation.
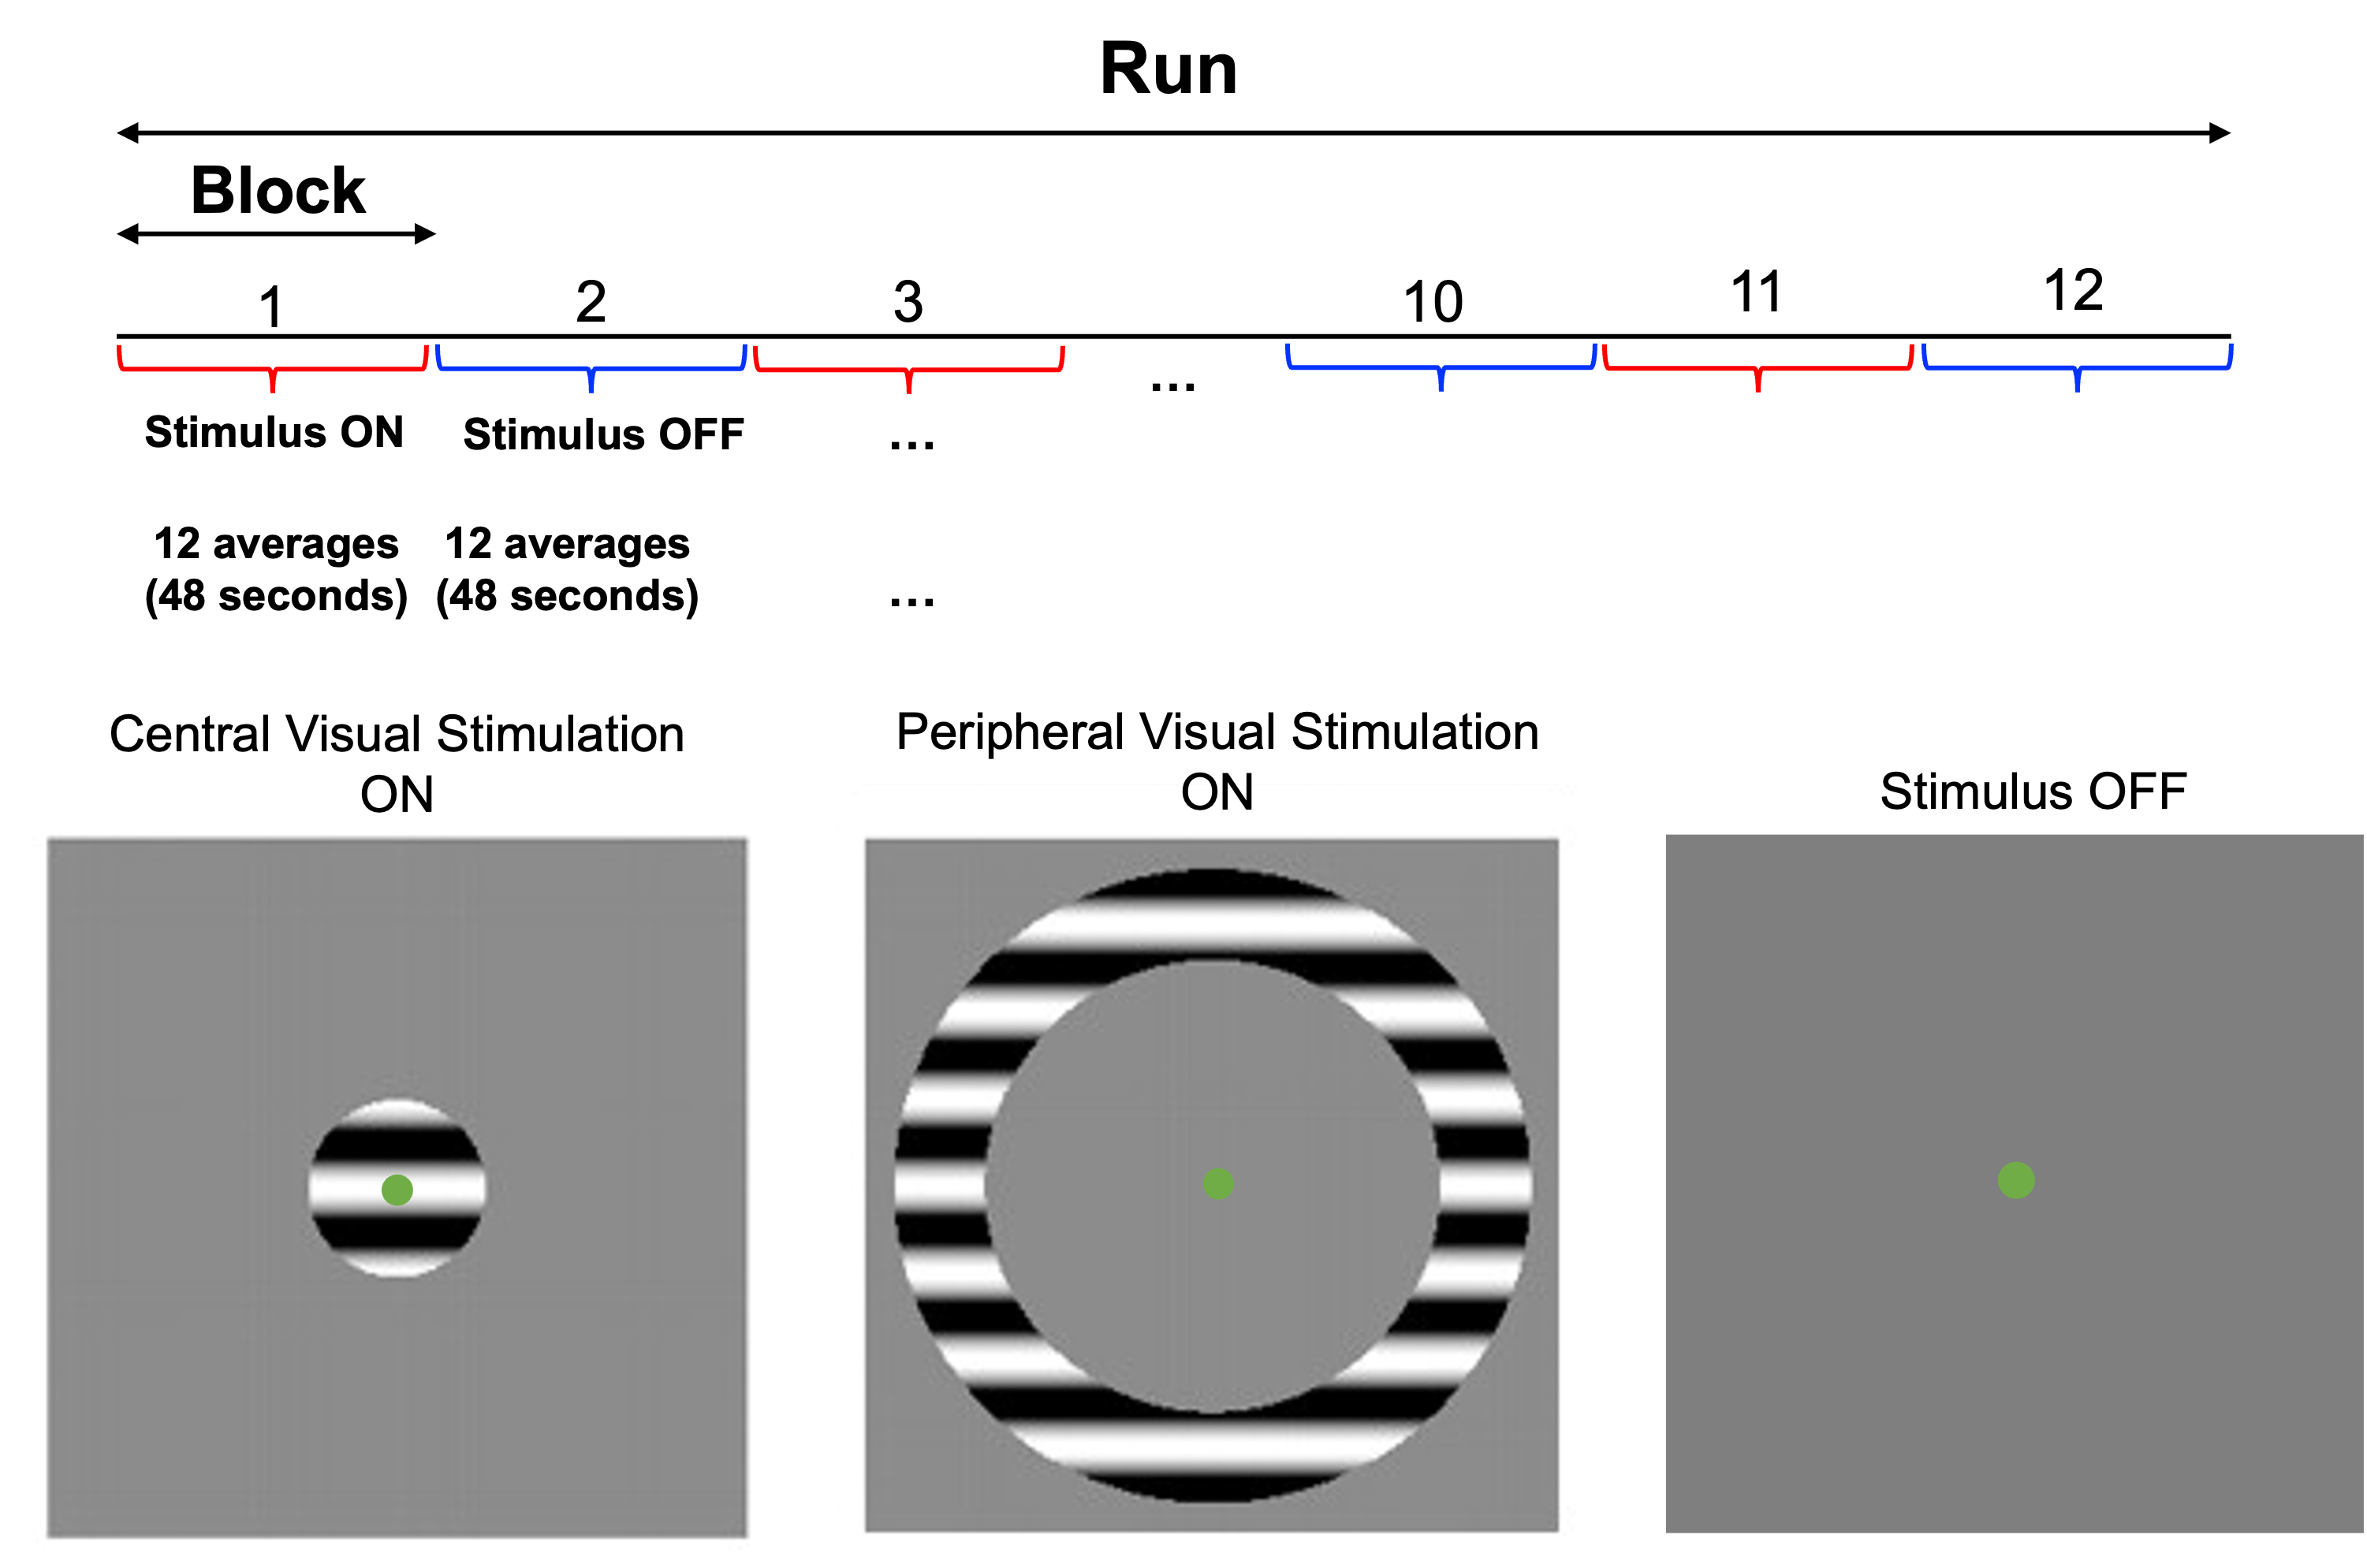
Figure 3: Functional MRS paradigm showing a single run consisting of 12 alternating blocks of ON and OFF states (spectra shown in Figure 2). The peripheral visual stimulus consists of a ring spanning an eccentricity from 4º to 6º, while the central visual stimulus features a circle with a radius of 2º of eccentricity. The stimuli display a black and white grating with a spatial frequency of 1 cycle per degree and a contrast level of 50%, flashing at 4Hz and emanating outwards from the fixation point. The participant’s task is to discern the color of the central fixation point.
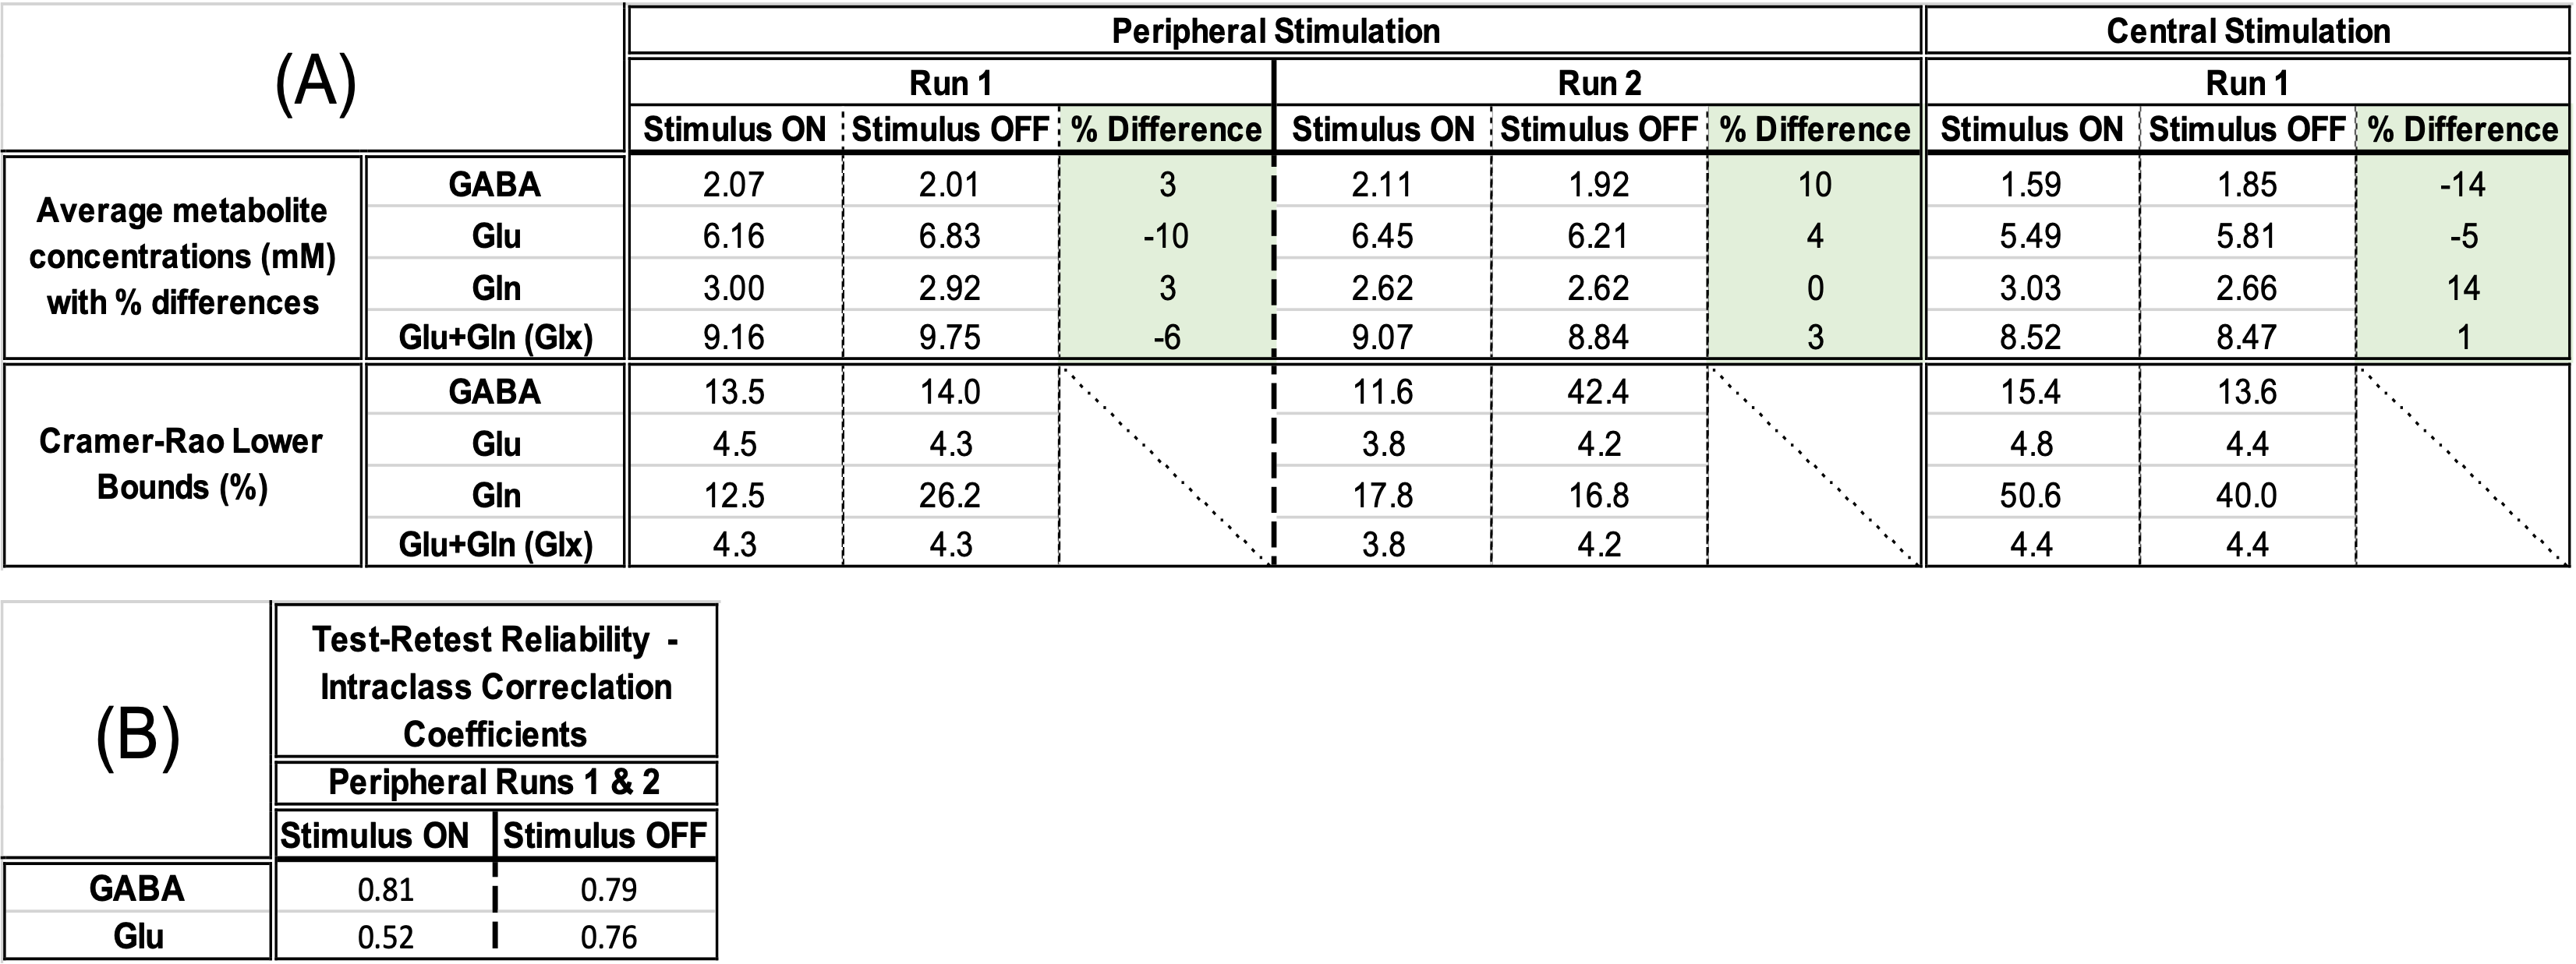
Table 1: (A) Average concentrations (mM) of GABA, Glu, Gln, and Glx from five acquisitions in four volunteers during ON and OFF states of peripheral and central visual stimulation. Percent differences measure the relative increase or decrease of metabolite concentrations from the OFF to ON state. Reliability of the spectral quantitation in terms of average Cramer-Rao lower bounds are shown. (B) Intraclass correlation coefficients (ICC) assess the test-retest reliability of GABA and Glu levels from the ON and OFF states between two runs of peripheral stimulation across 4 volunteers.