1921
ECS-induced seizure enhances neurometabolic activity but doesn’t affect astrocytic activity in mouse brain1Department of NMR microimaging and spectroscopy, CSIR-Centre For Cellular and Molecular Biology, Hyderabad, India, 2Academy of Scientific and Innovative Research (AcSIR), Ghaziabad, India
Synopsis
Keywords: Neurotransmission, Metabolism, Spectroscopy, Brain, Animal
Motivation: Electroconvulsive shock (ECS) therapy is an established treatment for drug-resistant depression. However, the status of neurometabolic activity during ECS-induced seizure is not clear.
Goal(s): This study was carried out to measure neurometabolic activity during ECS-induced Seizure.
Approach: 1H-[13C]-NMR spectroscopy was used in conjunction with intravenous [1,6-13C2]glucose or [2-13C]acetate infusion to measure neuronal and astroglial metabolic activity, respectively.
Results: The neurometabolic activity was increased while astroglial activity remained unchanged during ECS-induced seizure. Moreover, the anaerobic glucose consumption was highly increased, suggesting the dominance of glycolysis during the seizure state.
Impact: The assessment of metabolic activity of Glutamatergic, GABA’ergic neurons, and astrocytes during ECS-induced seizures, provides valuable information about glucose consumption during enhanced energy demand, and the interplay of different cell types in the brain.
Introduction
Electroconvulsive Shock (ECS) therapy is a rapid and the most effective treatment for drug-resistant depressive disorder1,2. The electric shock induces generalized seizure for a short period (~20-30 seconds). During the seizure, the brain's need for oxygen and metabolic substrate increases3. Moreover, to meet the increased metabolic demands, cerebral vessels dilate, systemic blood pressure increases, and cerebral blood flow rises4. However, neuronal and astroglial metabolic activity during ECS-induced seizures has not been studied quantitatively. Hence, the major aim of the study was to assess the neurometabolite homeostasis and neuroenergetics during seizure state with the help of [1H-13C]-NMR Spectroscopy.Methods
All animal experiments were approved by the Animal Ethics Committee of CCMB, Hyderabad. Two months old C57BL6 mice were divided into two groups: A. ECS Group, and B. Sham Group. For the assessment of neuronal and astroglial metabolic activity, Mice were infused with [1,6-13C2]glucose and [2-13C]acetate via the tail vein for 2 min using a pre-programmed infusion protocol in two different sets of mice6. Immediately after infusion, mice were anesthetized with isoflurane (4.5%) for 30 s. The mice in the ECS group received a single electroconvulsive shock (frequency 100 Hz; pulse width 0.5 ms; shock duration 0.5 s; current 50 mA) via corneal electrodes, while those in the sham group were anesthetized using isoflurane but no electric shock7. The brain metabolism was arrested by the focused beam microwave system (3 KW, 1.2 s) after 4.45 min of the infusion (Fig. 1A). A fixed amount of [2-13C]glycine was added during metabolite extraction from the prefrontal cortex (PFC) and Cerebral cortex as the internal concentration reference6. Labeling of brain metabolites was measured using proton observed carbon edited (1H-[13C]-NMR) spectroscopy of brain tissue extracts at 600 MHz NMR Microimager / spectrometer. The isotopic 13C enrichments of amino acids were calculated from the ratio of the 13C resonances in the 1H-[13C]-NMR difference spectrum to the non-edited spectrum of the extracts7. The statistical significance was assessed from the 2-tailed student’s T-test with the Holm-Sidak method for multiple comparisons using GraphPad Prism software.Results
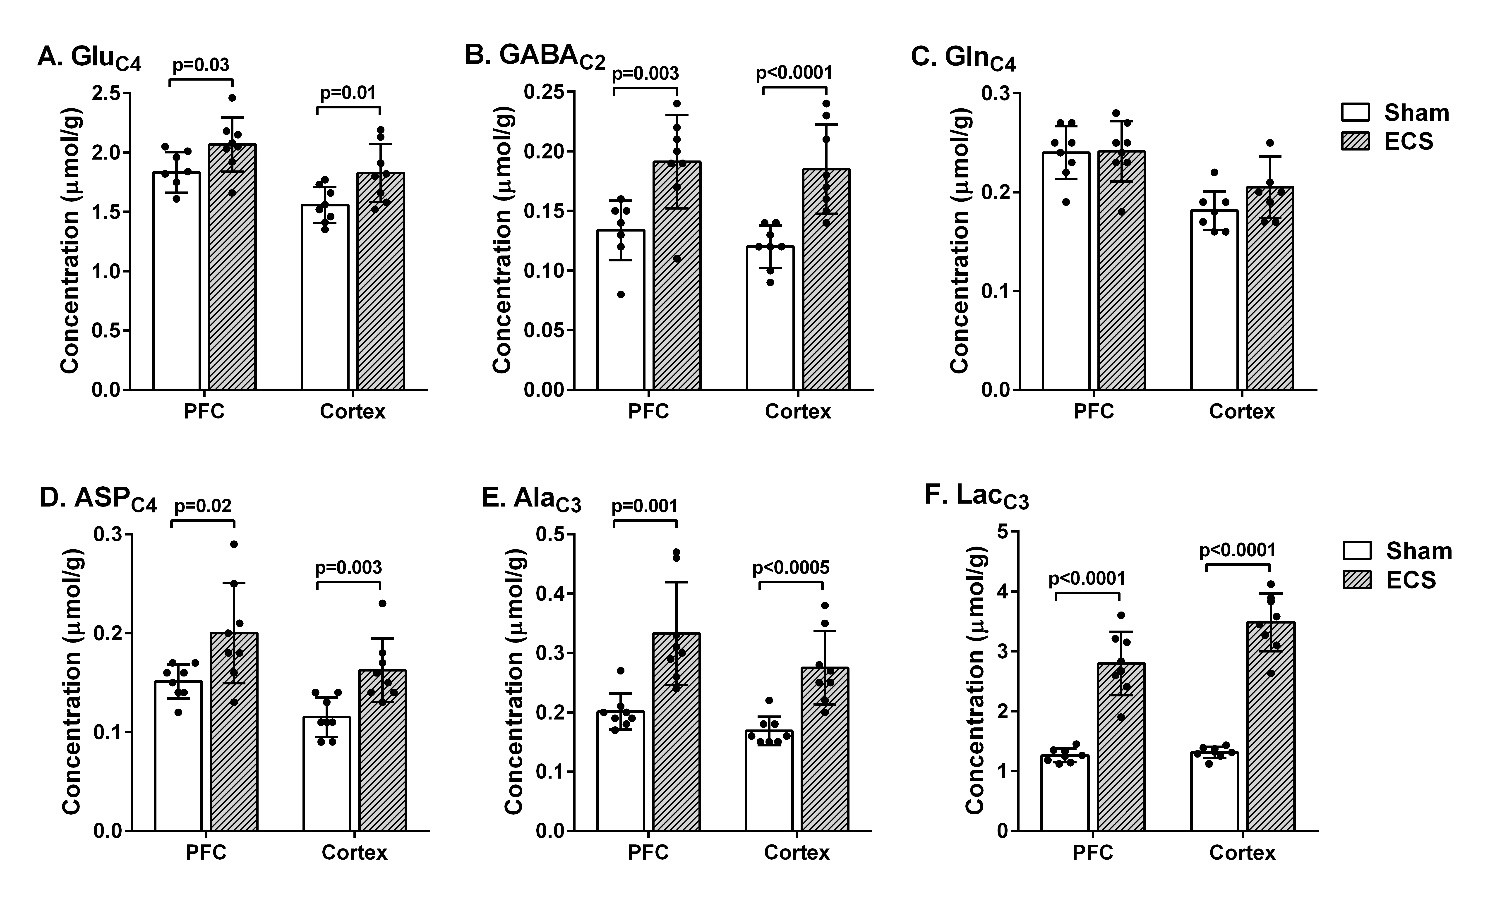
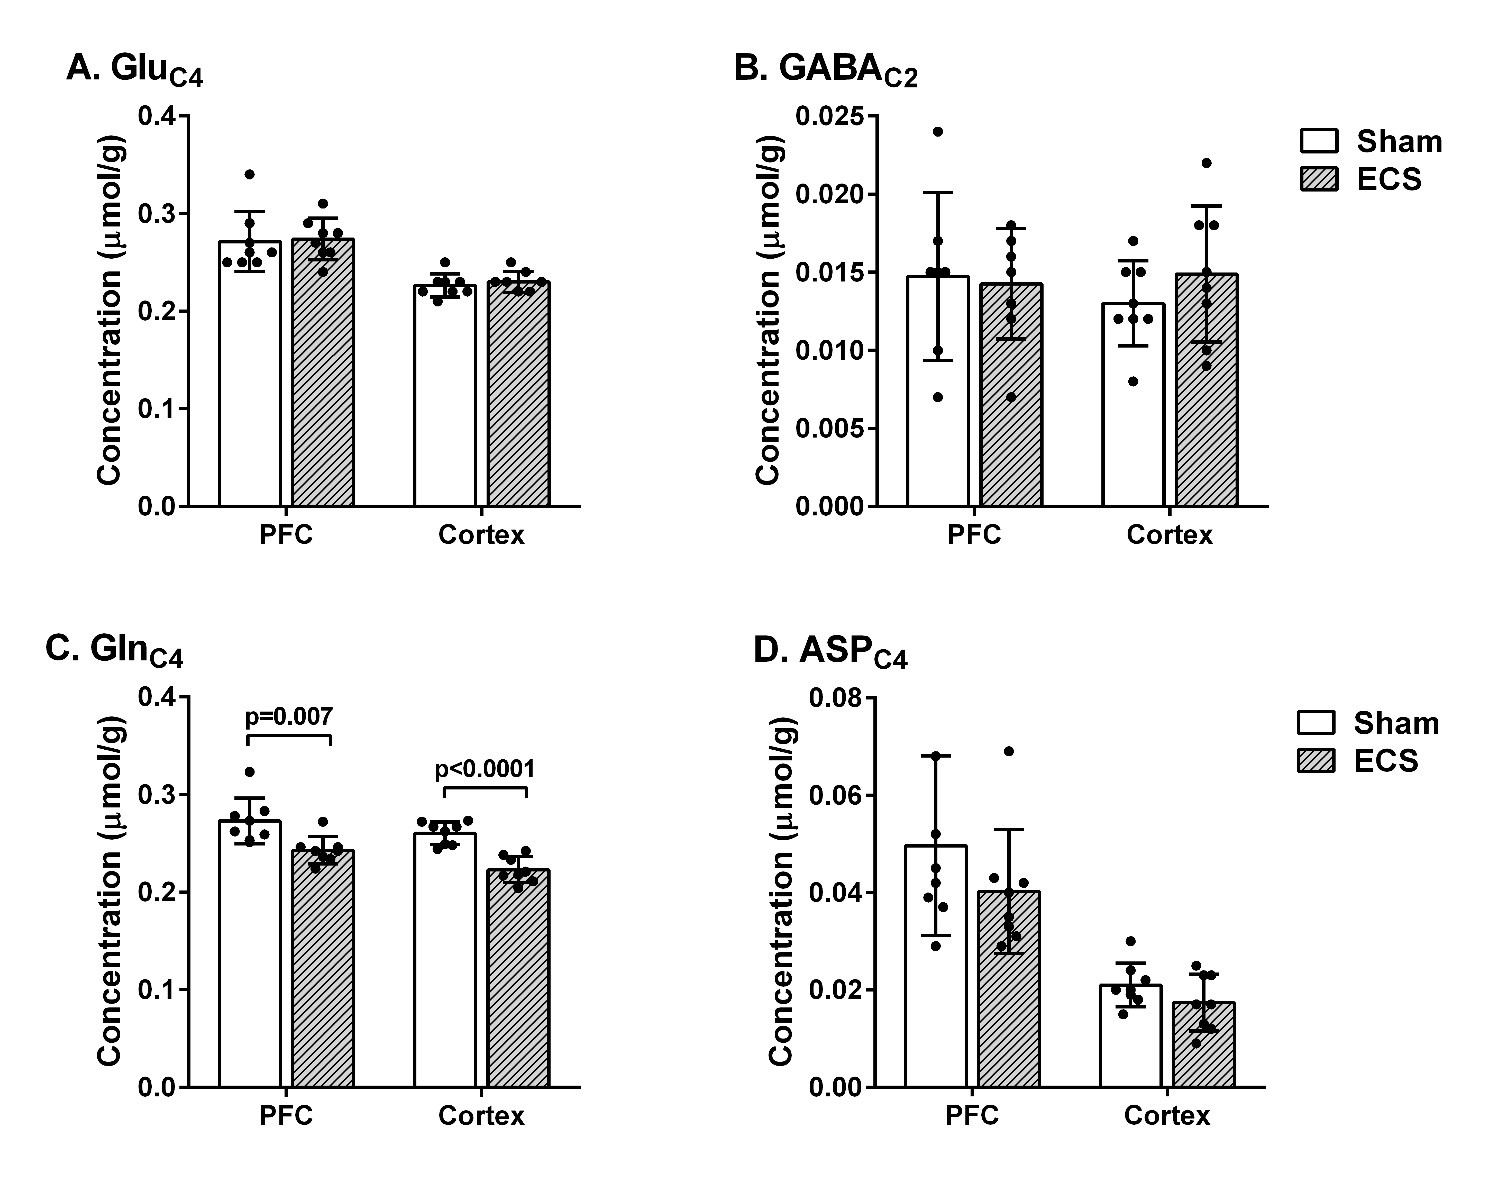
A typical 1H-[13C]-NMR spectrum of the cerebral cortex of Sham and ECS mice is presented in Fig. 1B. The concentrations of GABA, alanine and lactate were increased to 10%, 23%, and 122%, respectively, in the cerebral cortex, as seen in the upper panel of the NMR Spectrum (Fig. 1B). Similarly, the concentrations of succinate, alanine, and lactate were increased up to 50%, 27%, and 107%, respectively, in the prefrontal cortex. The 13C concentration of neurometabolites was measured in the 1H-[13C]-NMR spectra. Importantly, increased 13C labeling of GluC4 (+13%), GABAC4 (+43%), AspC3 (+32%), GluC3 (+30%), AlaC3 (+75%) and LacC3 (+111%) was found in PFC during the seizure (Fig. 2). Moreover, the 13C labeled GluC4 (+17%), GABAC4 (+54%), AspC3 (+40%), GABAC4 (+30%), AlaC3 (+68%) and LacC3 (+154%) were increased in the cerebral cortex during seizure (Fig. 2). However, there was no significant change in GlnC4 in both regions. There was a slight reduction in the 13C-labeling of GlnC4 (-10%) from [2-13C]acetate in the PFC and cerebral cortex, but no significant change in GluC4, GABAC2, and AspC3 from the [2-13C]acetate in ECS mice (Fig. 3).Discussion
As per our knowledge, this is the first quantitative study to understand the brain energy metabolism during ECS-induced seizure state. These data show increased metabolic activity of glutamatergic and GABA’ergic neurons during seizure. Importantly, the non-oxidative glucose metabolism was increased more than oxidative phosphorylation. The brain cells may switch their metabolic preference towards non-oxidative pathways to quickly generate ATP, and adapt to the increased energy demands8. The reduced GlnC4 labeling from [2-13C]acetate in ECS mice might be related to the tremendous flow of unlabeled glutamate from glutamatergic neurons in astrocytes thus diluting the small pool of 13C labeled glutamate from oxidation of [2-13C]acetate.Conclusion
This study gives important insight about the metabolic activity of neurons and astrocytes during ECS-induced seizure. It will be helpful to deduce the mechanism of ECS and to minimize the immediate side effects of seizures.Acknowledgements
This work was supported by the Council for Scientific and Industrial Research (CSIR), Government of India (Health Care Theme FBR/MLP0150). AS thanks the Department of Biotechnology for the award of Senior Research Fellowship (DBT/2019/CCMB/1230).References
1. Pagnin, D., de Queiroz, V., Pini, S. & Cassano, G. B. Efficacy of ECT in Depression: A Meta-Analytic Review. J ECT 20, (2004).
2. Espinoza, R. T. & Kellner, C. H. Electroconvulsive Therapy. N. Engl. J. Med. 386, 667–672 (2022).
3. Posner, J. B., Plum, F. & Van Poznak, A. Cerebral Metabolism During Electrically Induced Seizures in Man. Arch. Neurol. 20, 388–395 (1969).
4. Ackermann, R. F., Engel, J. & Baxter, L. Positron Emission Tomography and Autoradiographic Studies of Glucose Utilization following Electroconvulsive Seizures in Humans and Rats. Ann. N. Y. Acad. Sci. 462, 263–269 (1986).
5. Azuma, H. et al. Postictal suppression correlates with therapeutic efficacy for depression in bilateral sine and pulse wave electroconvulsive therapy. Psychiatry Clin. Neurosci. 61, 168–173 (2007).
6. Soni, N. D., Ramesh, A., Roy, D. & Patel, A. B. Brain energy metabolism in intracerebroventricularly administered streptozotocin mouse model of Alzheimer’s disease: A 1 H-[ 13 C]-NMR study. J. Cereb. Blood Flow Metab. 41, 2344–2355 (2021).
7. Bagga, P. et al. Characterization of Cerebral Glutamine Uptake from Blood in the Mouse Brain: Implications for Metabolic Modeling of 13 C NMR Data. J. Cereb. Blood Flow Metab. 34, 1666–1672 (2014).
8. Fox, P. T., Raichle, M. E., Mintun, M. A. & Dence, C. Nonoxidative Glucose Consumption during Focal Physiologic Neural Activity. Sci. New Ser. 241, 462–464 (1988).
Figures
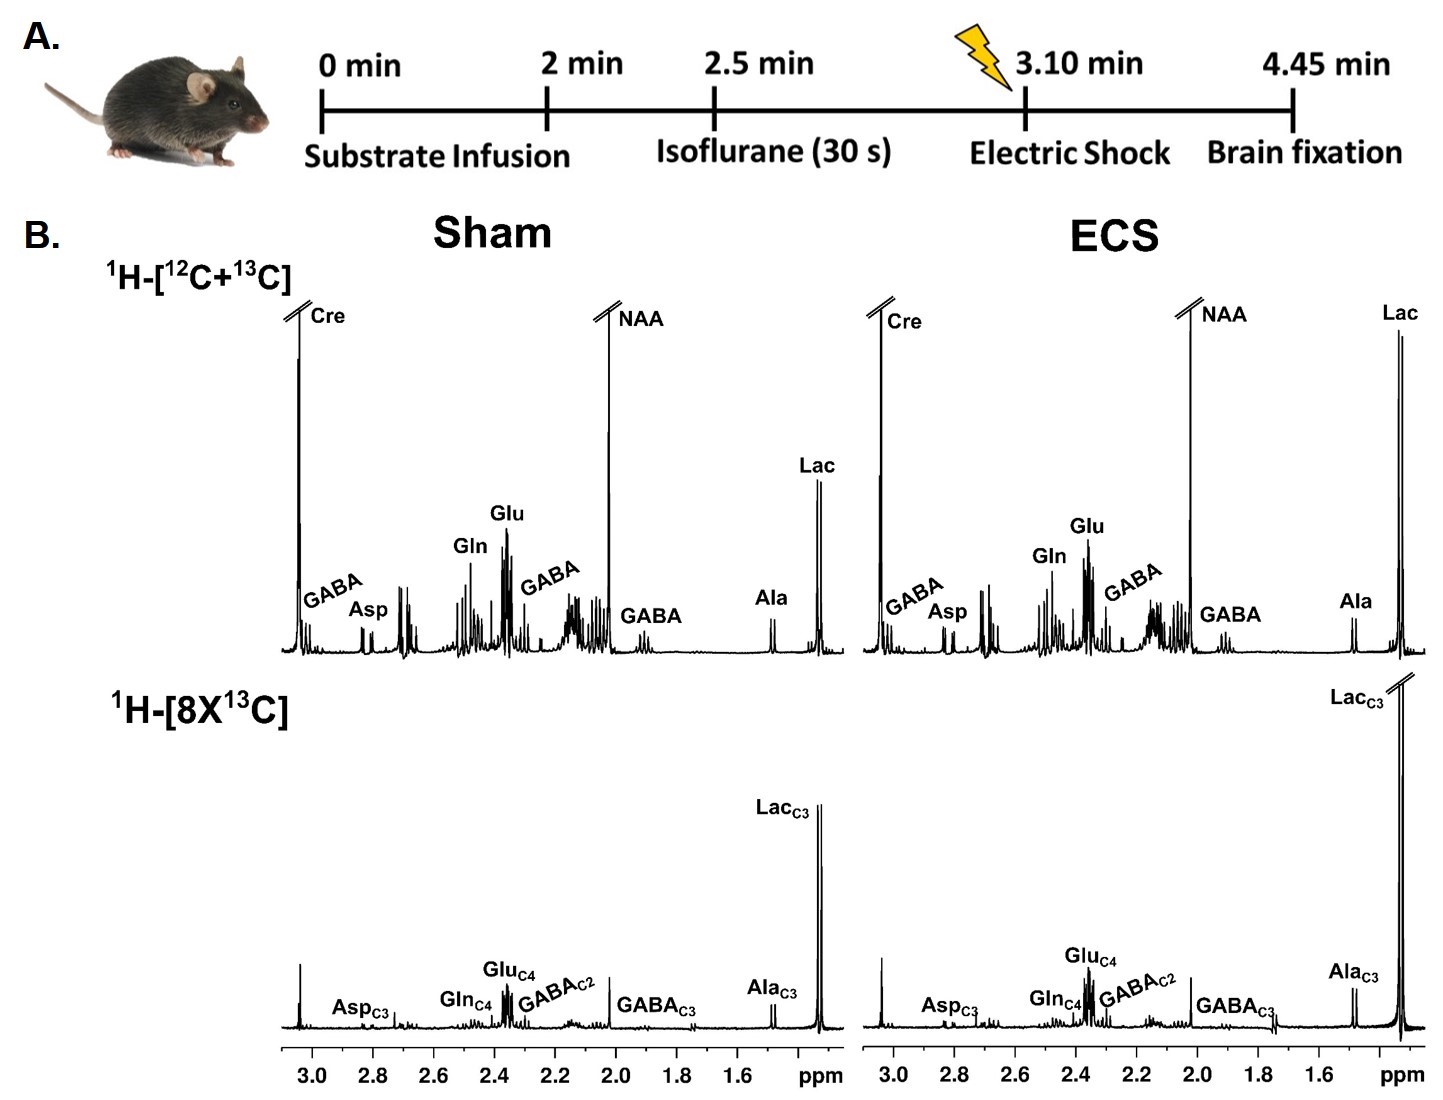
Fig 1. A. Schematic representation of the experimental timeline. Mice were infused with 13C labeled substrate for 2 min, and subjected to anesthesia for 30 s after the completion of the infusion, immediately an ECS was administered at 3.10 min. Brain Metabolism was arrested at 4.45 min by focused beam microwave irradiation. B. Representative 1H-[13C]-NMR spectra from cortical brain tissue extract. The spectrum in the upper panel shows the total concentration of neurometabolites, whereas the spectra in the lower panel depict 13C labeled neurometabolites.
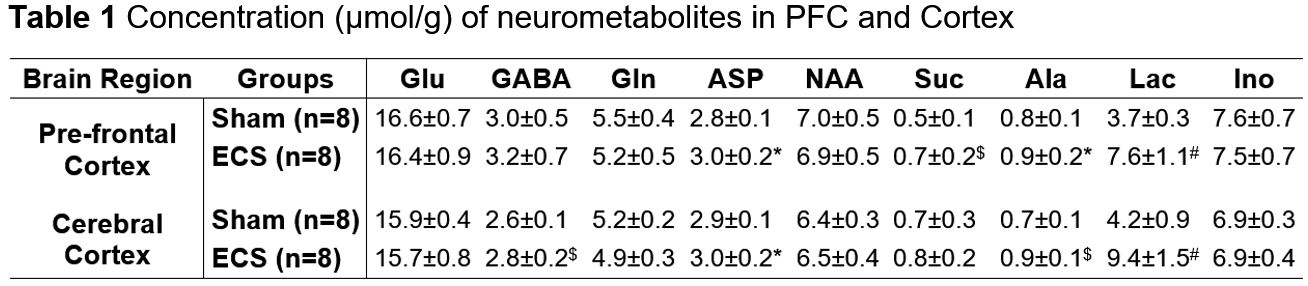
The concentrations of metabolites were measured in the brain tissue extracts from 1H-[12C+13C]-NMR spectrum using [2-13C]glycine as a reference. Values are presented as mean±SD. Abbreviations: Ala, alanine; Asp, aspartate; GABA, g-aminobutyric acid; Glu, glutamate; Gln, glutamine; Ino, inositol; NAA, N-acetyl aspartate; Suc, succinate. *p<0.05, $p<0.005, #p<0.0001 when ECS mice was compared with sham mice.