1919
Laminar fMRI-MRS Study: Exploring the Relationship Between Cortical Depth Dependent BOLD Signals and Neurometabolites Concentrations in PCC1Department of Psychiatry, Psychotherapy and Psychosomatics, RWTH Aachen University, Aachen, Germany, 2Institute of Neuroscience and Medicine, INM-4, Forschungszentrum Jülich GmbH, Juelich, Germany, 3Center for Computational Life Science, RWTH Aachen University, Aachen, Germany, 4JARA – BRAIN – Translational Medicine, Aachen, Germany, 5Institute of Neuroscience and Medicine - 1, INM-1, Forschungszentrum Jülich GmbH, Juelich, Germany, 6C. and O. Vogt Institute for Brain Research, Heinrich-Heine-University, Düsseldorf, Germany, 7Institute of Neuroscience and Medicine - 11, INM-11, Forschungszentrum Jülich GmbH, Juelich, Germany, 8Department of Neurology, RWTH Aachen University, Aachen, Germany
Synopsis
Keywords: Neurotransmission, Brain, 7T, MRS, Laminar fMRI, Brain Function
Motivation: To gain insights into the neurochemical underpinnings of brain function by investigating the association between the cortical depth-dependent BOLD signal and neurometabolite concentrations in the PCC.
Goal(s): Examine the relationship between neurometabolites and laminar-fMRI metrics in the PCC to uncover layer-specific functional relationships
Approach: Laminar fMRI and MRS at 7T and assessment of correlations between cortical depth-dependent fMRI-metrics and neurometabolites
Results: Glutamate positively correlated with the fMRI ECM-metric in the intermediate layers of the PCC, suggesting increased long-range neural excitability. Conversely, lactate concentration negatively correlated with the fMRI ALFF-metric in superficial layers of the PCC, indicating potential layer-specific metabolic and functional differences
Impact: This study exposes the intricate relationship between regional neurometabolite concentrations and laminar fMRI metrics in the posterior cingulate cortex (PCC) that contribute to our understanding of brain activity and functional connectivity at rest
Introduction
Blood oxygenation level-dependent (BOLD) fMRI provides information about hemodynamic response, which is related to the oxygen demand of the neurons and is predominantly driven by the balance between excitation and inhibition in microcircuits1. Previous studies have shown that about 85% of the energy consumed by the brain is used to support glutamatergic signalling2,3. Consequently, generation of the BOLD signal is primarily influenced by the regional excitation4. Research using single voxel magnetic resonance spectroscopy (MRS) and fMRI has shown links between regional neurotransmitter levels, BOLD signals, and functional connectivity5–8. Previous research has primarily explored these associations either regionally or at a whole-brain level, encompassing the entire cortical ribbon. However, since the distribution of neurotransmitter receptors can vary between different cortical regions and layers9,10, studying the association of BOLD signal at different cortical layers with absolute regional neurotransmitter concentrations will improve understanding of the neurochemical basis of brain activity and potentially uncover layer-specific functional relationships. Thus, this exploratory study aims to examine the association between the cortical depth-dependent BOLD signal and absolute in-vivo neurometabolite concentrations (glutamate, glutamine, GABA, excitation-inhibition ratio glutamate/GABA, glutathione, and lactate) in the the posterior cingulate cortex (PCC) during resting state (RS). The PCC is a central hub within the default mode network, exhibiting increased metabolic activity11, receptor binding availabilities12 and structural connections13 to various brain regions. Thus, the PCC is considered to be the region-of-interest in this study.Methods
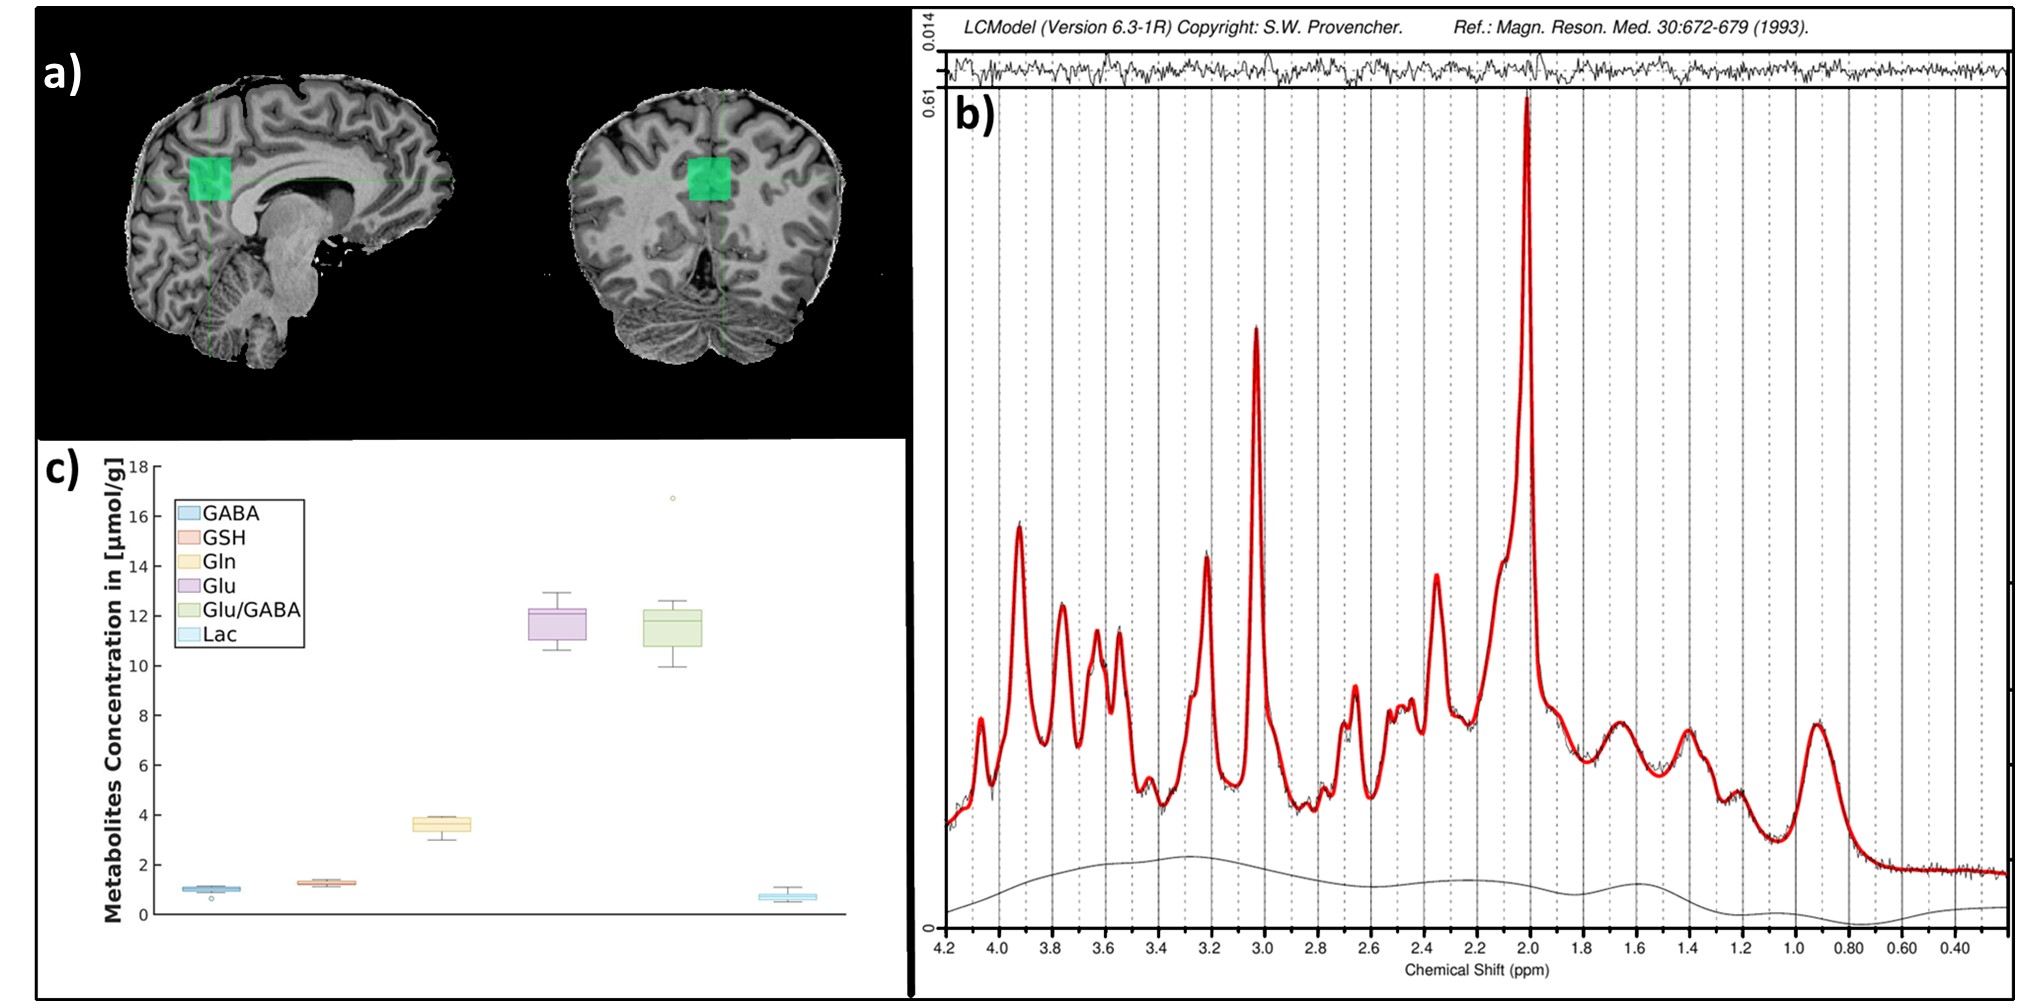
Data Acquisition:The MR data were acquired from nine healthy subjects (six males, age: 34±14) using a 7T MAGNETOM Terra scanner (Siemens Healthineers). The structural MRI, high-resolution fMRI and MRS data were acquired in the same session.
Structural MRI: MP2RAGE sequence - TR/TE 4500ms/1.99ms, voxel-size 0.75 mm3 isotropic resolution.
RS-fMRI: GE-EPIK sequence with TR-external phase-correction14,15 (TR/TE = 3500/22ms, FA = 85°, partial Fourier = 5/8, 3-fold in-plane/3-fold inter-plane (multi-band) acceleration, voxel-size 0.63×0.63×0.63 mm3).
Single-voxel MRS: STEAM sequence16–18 with ultra-short echo-time: TE = 4.6ms; TM = 28 ms; TR = 8200ms; 64 averages; voxel-size 20×20×20mm3. B0 shimming was performed using FASTESTMAP18. The sequence included water suppression (VAPOR) and outer-volume suppression modules19.
MRS and fMRI Data Analysis:
MR-spectra were pre-processed (motion, frequency and phase drift corrections) and fitted using the FID-A package20 and LCModel (6.3-0I),21 respectively. The neurometabolite concentrations with a Cramer-Rao lower bound above 20% were excluded and absolute concentration was calculated22.
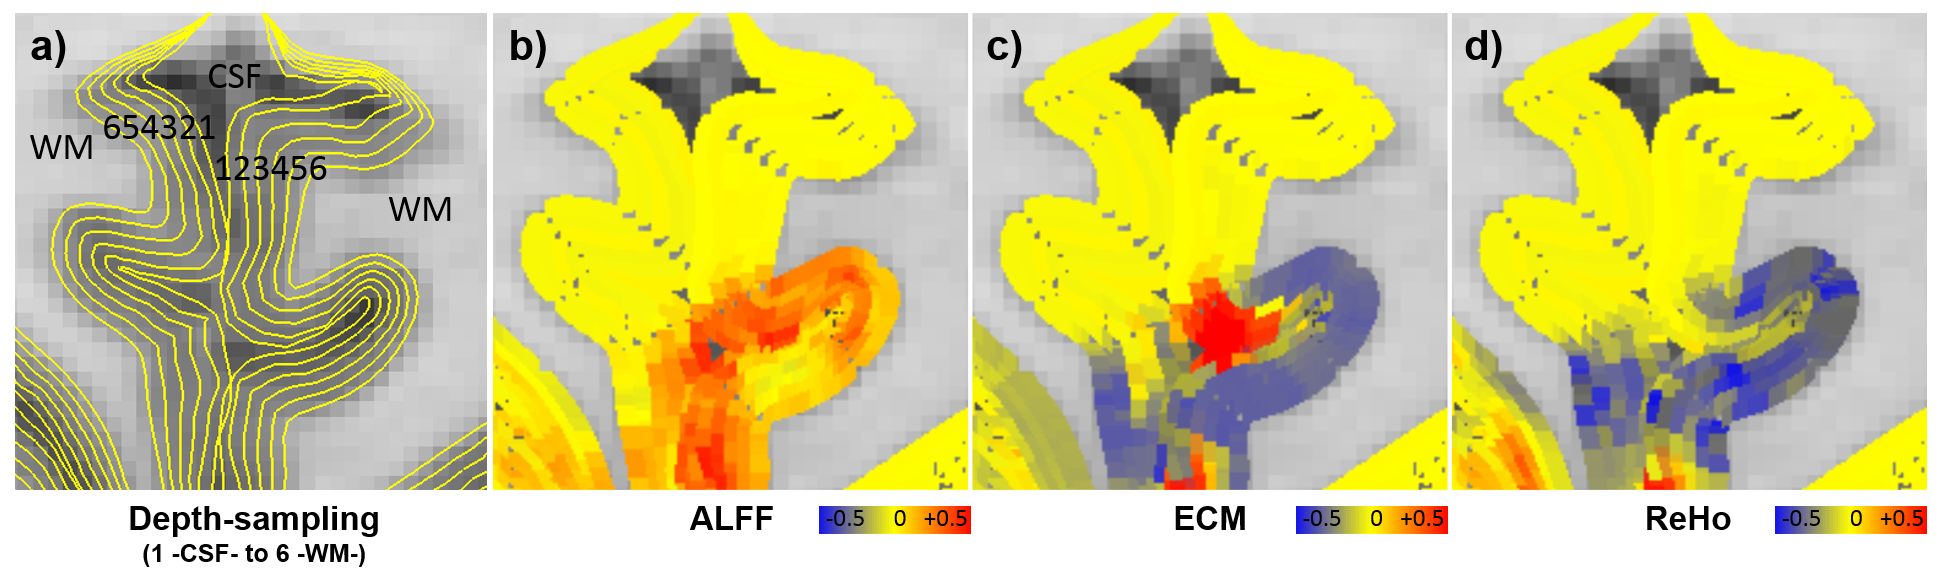
fMRI pre-processing included slice timing correction, realignment, temporal filtering, and regression (motion, CSF/WM, physiological and vein signal biases)23 using SPM1224, FSL25 and AFNI26. Whole-brain voxel-level RS-fMRI-metrics, such as amplitude of low-frequency fluctuations (ALFF)27, eigenvector centrality mapping (ECM)28, and regional homogeneity (ReHo)29 were calculated and projected to six cortical depth-dependent surfaces and normalised using Z-score transformation. The mean RS-fMRI metrics for each equidistant cortical depth were extracted from the PCC volume included in single-voxel MRS.
Statistical Analysis:
Spearman's rank correlation was performed to find the associations. The family-wise error rate due to multiple comparisons was controlled for using a permutation approach30.
Results
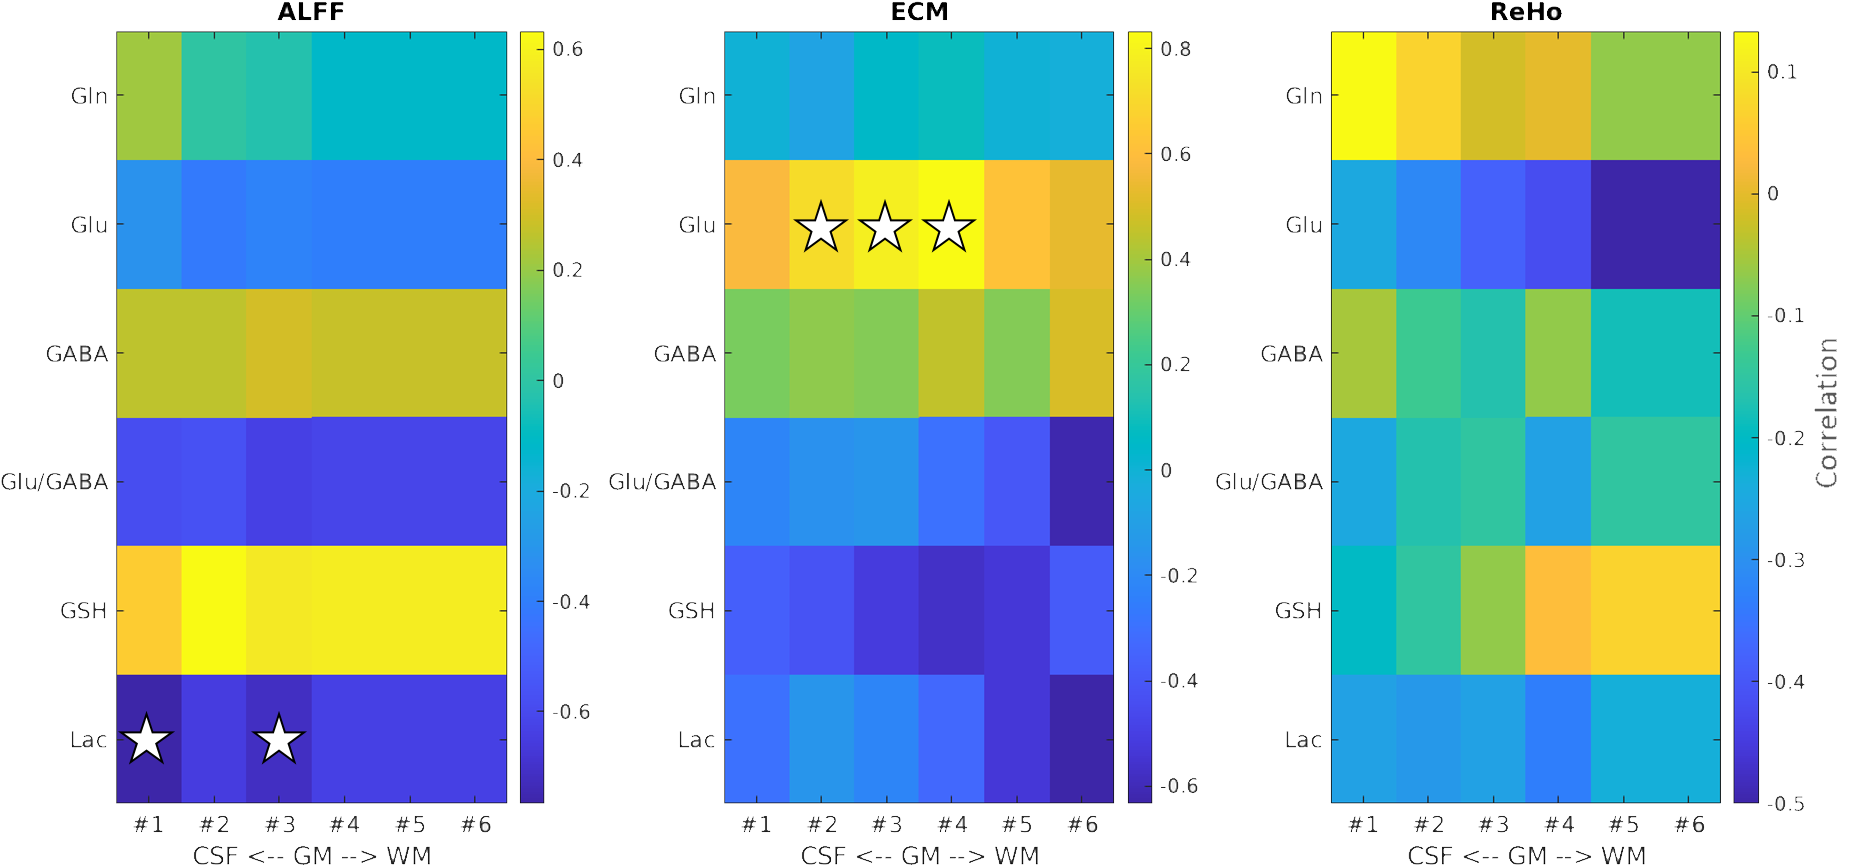
The concentration of glutamate was found to have a significant (p <0.05) positive association with the fMRI ECM-metric at depths 2 (rs = 0.71), 3 (rs = 0.78) and 4 (rs = 0.83) of PCC (Fig. 3), with depth territories numbered from the GM-CSF boundary to the WM-GM boundary. Lactate concentration was found to have a significant (p <0.05) negative association with the fMRI ALFF-metric in superficial depths, specifically depths 1 (rs = -0.77) and 3 (rs = -0.72) of PCC (Fig. 3).Discussions and Conclusions
The positive correlations between glutamate concentration and the fMRI ECM-metric indicate a strong relationship between the excitatory neurotransmitter glutamate and highly functionally connected voxels in the whole brain. This finding suggests that higher glutamate levels are associated with increased long-range neural excitability and synchronisation in the more superficial layers, as reflected by the enhanced fMRI ECM-metric.PCC is one of the regions which show elevated aerobic glycolysis in the brain31. The negative correlation observed between lactate and the fMRI ALFF-metric (representing the intensity of BOLD signal) in the superficial layers of the PCC during RS, coupled with the consistent levels of lactate in the PCC during tasks32, suggests that there may be distinct metabolic mechanisms at play that support neurotransmission within the superficial cortical layers at rest. This could reflect a potential metabolic or functional difference in the layers of the PCC, highlighting the layer-specific complexities of brain function.
Limitations
The study focused on a relatively small sample size, which limits generalizability. Extending the method to a larger number of subjects and to other disease conditions may help in finding neurobiological mechanisms behind BOLD signals and functional connectivity.Acknowledgements
*Authors Ravichandran Rajkumar and Patricia Pais-Roldán contributed equally to this work. N. Jon Shah and Irene Neuner shared equally senior authorship. The authors would like to thank Petra Engels, Elke Bechholz, and Anita Köth for their technical assistance during the scans, and Claire Rick for proofreading the abstract. We would like to acknowledge E.J. Auerbach and M. Marjanska (Center for Magnetic Resonance Research and Department of Radiology, University of Minnesota, USA) for the development of the STEAM sequence for the Siemens platform, which was provided by the University of Minnesota under a C2P agreement.References
1. Logothetis NK. What we can do and what we cannot do with fMRI. Nature. 2008;453(7197):869-878. doi:10.1038/nature069762. Hyder F, Patel AB, Gjedde A, Rothman DL, Behar KL, Shulman RG. Neuronal-glial glucose oxidation and glutamatergic-GABAergic function. J Cereb Blood Flow Metab. 2006;26(7):865-877. doi:10.1038/sj.jcbfm.9600263
3. Patel AB, De Graaf RA, Mason GF, Rothman DL, Shulman RG, Behar KL. The contribution of GABA to glutamate/glutamine cycling and energy metabolism in the rat cortex in vivo. Proc Natl Acad Sci U S A. 2005;102(15). doi:10.1073/pnas.0501703102
4. Smith AJ, Blumenfeld H, Behar KL, Rothman DL, Shulman RG, Hyder F. Cerebral energetics and spiking frequency: The neurophysiological basis of fMRI. Proc Natl Acad Sci U S A. 2002;99(16). doi:10.1073/pnas.132272199
5. Muthukumaraswamy SD, Evans CJ, Edden RAE, Wise RG, Singh KD. Individual variability in the shape and amplitude of the BOLD-HRF correlates with endogenous GABAergic inhibition. Hum Brain Mapp. 2012;33(2). doi:10.1002/hbm.21223
6. Falkenberg LE, Westerhausen R, Specht K, Hugdahl K. Resting-state glutamate level in the anterior cingulate predicts blood-oxygen level-dependent response to cognitive control. Proc Natl Acad Sci U S A. 2012;109(13). doi:10.1073/pnas.1115628109
7. Kapogiannis D, Reiter DA, Willette AA, Mattson MP. Posteromedial cortex glutamate and GABA predict intrinsic functional connectivity of the default mode network. Neuroimage. 2013;64:112-119. doi:10.1016/j.neuroimage.2012.09.029
8. Arrubla J, Tse DHY, Amkreutz C, Neuner I, Shah NJ. GABA Concentration in Posterior Cingulate Cortex Predicts Putamen Response during Resting State fMRI. PLoS One. 2014;9(9):e106609. doi:10.1371/journal.pone.0106609
9. Zilles K, Palomero-Gallagher N. Multiple transmitter receptors in regions and layers of the human cerebral cortex. Front Neuroanat. 2017;11. doi:10.3389/fnana.2017.00078
10. Palomero-Gallagher N, Zilles K. Cortical layers: Cyto-, myelo-, receptor- and synaptic architecture in human cortical areas. Neuroimage. 2019;197. doi:10.1016/j.neuroimage.2017.08.035
11. Raichle ME, MacLeod AM, Snyder AZ, Powers WJ, Gusnard DA, Shulman GL. A default mode of brain function. PNAS. 2001;98(2):676-682. doi:10.1073/pnas.98.2.676
12. Rajkumar R, Régio Brambilla C, Veselinovic T, et al. Excitatory-inhibitory balance within EEG microstates and resting-state fMRI networks: assessed via simultaneous trimodal PET-MR-EEG imaging. Transl Psychiatry. 2021;11(1).
13. Hagmann P, Cammoun L, Gigandet X, et al. Mapping the structural core of human cerebral cortex. PLoS Biol. 2008. doi:10.1371/journal.pbio.0060159
14. Yun SD, Pais-Roldán P, Palomero-Gallagher N, Shah NJ. Mapping of whole-cerebrum resting-state networks using ultra-high resolution acquisition protocols. Hum Brain Mapp. 2022;43(11). doi:10.1002/hbm.25855
15. Zaitsev M, Zilles K, Shah NJ. Shared k‐space echo planar imaging with keyhole. Magn Reson Med. 2001;45(1). doi:10.1002/1522-2594(200101)45:1
16. Tkáč I, Öz G, Adriany G, Uǧurbil K, Gruetter R. In vivo 1H NMR spectroscopy of the human brain at high magnetic fields: Metabolite quantification at 4T vs. 7T. Magn Reson Med. 2009;62(4). doi:10.1002/mrm.22086
17. Tkáč I, Starčuk Z, Choi IY, Gruetter R. In vivo 1H NMR spectroscopy of rat brain at 1 ms echo time. Magn Reson Med. 1999;41(4).
18. Gruetter R, Tkác I. Field mapping without reference scan using asymmetric echo-planar techniques. Magn Reson Med. 2000;43(2):319-323.
19. Tká I, Andersen P, Adriany G, Merkle H, Uurbil K, Gruetter R. In vivo 1H NMR spectroscopy of the human brain at 7 T. Magn Reson Med. 2001. doi:10.1002/mrm.1213
20. Simpson R, Devenyi GA, Jezzard P, Hennessy TJ, Near J. Advanced processing and simulation of MRS data using the FID appliance (FID-A)—An open source, MATLAB-based toolkit. Magn Reson Med. 2017;77(1). doi:10.1002/mrm.26091
21. Provencher SW. Automatic quantitation of localized in vivo 1H spectra with LCModel. NMR Biomed. 2001;14(4):260-264. http://www.ncbi.nlm.nih.gov/pubmed/11410943. Accessed July 13, 2016.
22. Gasparovic C, Song T, Devier D, et al. Use of tissue water as a concentration reference for proton spectroscopic imaging. Magn Reson Med. 2006;55(6). doi:10.1002/mrm.20901
23. Menon RS. Postacquisition suppression of large-vessel BOLD signals in high-resolution fMRI. Magn Reson Med. 2002;47(1). doi:10.1002/mrm.10041
24. Penny WD, Friston KJ, Ashburner JT, Kiebel SJ, Nichols TE. Statistical Parametric Mapping: The Analysis of Functional Brain Images. Elsevier; 2011.
25. Jenkinson M, Beckmann CF, Behrens TEJ, Woolrich MW, Smith SM. Fsl. Neuroimage. 2012;62(2):782-790. doi:10.1016/j.neuroimage.2011.09.015
26. Cox RW. AFNI: Software for analysis and visualization of functional magnetic resonance neuroimages. Comput Biomed Res. 1996;29(3). doi:10.1006/cbmr.1996.0014
27. Zang Y, He Y, Zhu C, et al. Altered baseline brain activity in children with ADHD revealed by resting-state functional MRI. Brain Dev. 2007;29(2):83-91. doi:10.1016/j.braindev.2006.07.002
28. Lohmann G, Margulies DS, Horstmann A, et al. Eigenvector centrality mapping for analyzing connectivity patterns in fMRI data of the human brain. PLoS One. 2010;5(4). doi:10.1371/journal.pone.0010232
29. Zang Y, Jiang T, Lu Y, He Y, Tian L. Regional homogeneity approach to fMRI data analysis. Neuroimage. 2004;22:394-400. doi:10.1016/j.neuroimage.2003.12.030
30. Groppe DM, Urbach TP, Kutas M. Mass univariate analysis of event-related brain potentials/fields I: A critical tutorial review. Psychophysiology. 2011;48(12):1711-1725. doi:10.1111/j.1469-8986.2011.01273.x
31. Vaishnavi SN, Vlassenko AG, Rundle MM, Snyder AZ, Mintun MA, Raichle ME. Regional aerobic glycolysis in the human brain. Proc Natl Acad Sci U S A. 2010;107(41). doi:10.1073/pnas.1010459107
32. Koush Y, de Graaf RA, Kupers R, et al. Metabolic underpinnings of activated and deactivated cortical areas in human brain. J Cereb Blood Flow Metab. 2021;41(5). doi:10.1177/0271678X21989186
Figures