1917
Dose-dependent and dynamic effects of esketamine on neurometabolism: a 7T functional MRI/MRS study1Department of Radiology and Nuclear Medicine, Amsterdam UMC, location AMC, Amsterdam, Netherlands, 2Department of Anesthesiology, Amsterdam UMC, location AMC, Amsterdam, Netherlands
Synopsis
Keywords: Neurotransmission, Neuro, pharmacological MRI, functional MRS
Motivation: An integrated imaging approach using functional magnetic resonance imaging (fMRI) and functional proton magnetic resonance spectroscopy (fMRS) can increase our understanding of the functional response to antidepressant medication like es-ketamine.
Goal(s): We aimed to assess the dose- and time-dependent effects of the antidepressant es-ketamine on the functional brain response.
Approach: We used an interleaved fMRI and fMRS experiment to assess whole-brain changes in BOLD signal and neurometabolite changes in the anterior cingulate cortex.
Results: Es-ketamine increased glutamate levels and the BOLD signal, and decreased aspartate and glucose levels in the first 10-15 minutes following administration, with specific dose-dependent effects.
Impact: Our results show both dose- and time-dependent neurometabolic and hemodynamic responses to es-ketamine. Understanding the contribution of these two determinants of the functional response might advance our understanding of the effects of antidepressant medication on the human brain.
Introduction
Combining pharmacological MRI (phMRI) and proton Magnetic Resonance Spectroscopy (1H-MRS) might be a promising avenue for enhancing our understanding of the functional response to antidepressant medication. Previous phMRI studies have shown that the functional response to citalopram and (es-)ketamine is both time- and region-specific1-3. Likewise, 1H-MRS studies have shown that (es-)ketamine increases glutamate (Glu) levels in the anterior cingulate cortex (ACC) at specific timepoints after administration4-7. Using a double-dose randomized cross-over design, we investigated how es-ketamine affects functional MRI (fMRI) and functional 1H-MRS (fMRS) signals. We hypothesized a dose- and time-dependent increase in ACC Glu, and on the fMRI signal in the ACC.Methods
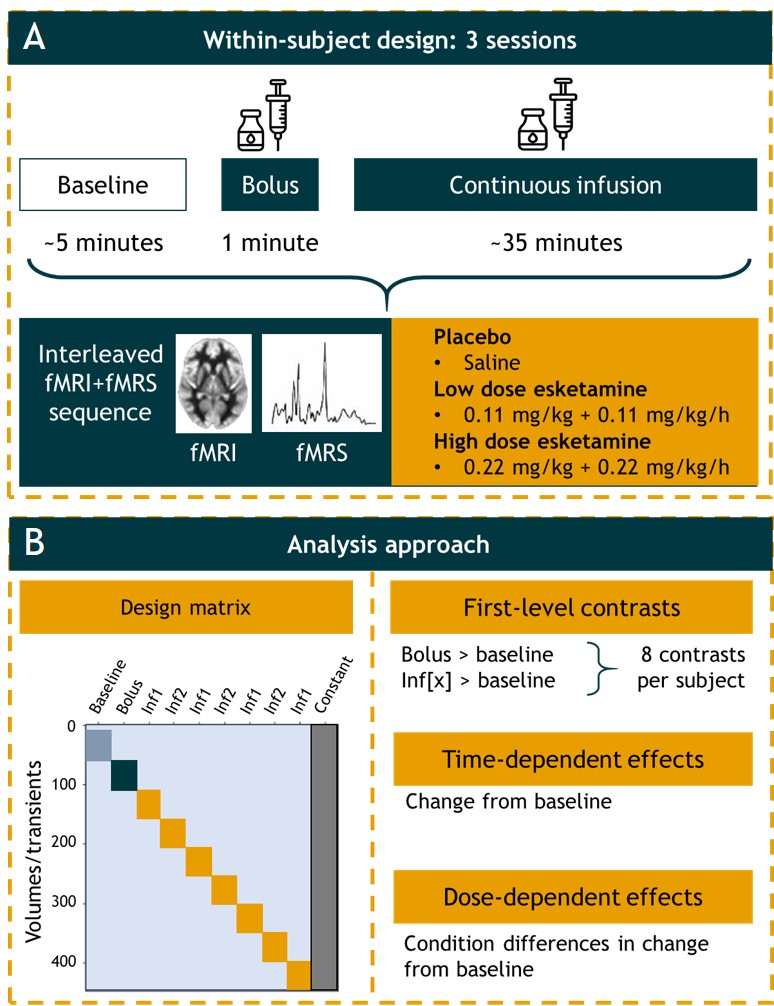
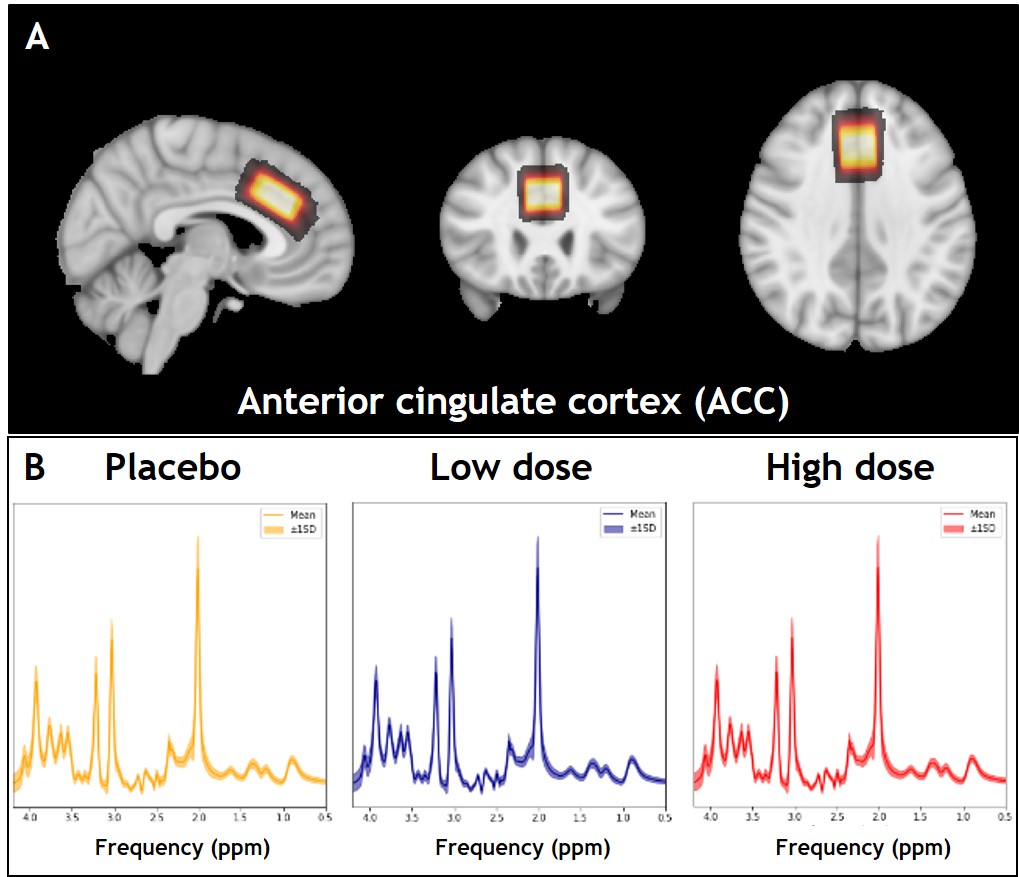
AcquisitionWe acquired data from 32 healthy volunteers (14 females, age=22.8±5.4), who participated in a double-dose, counterbalanced, placebo-controlled randomized trial. Participants received placebo, a low, or a high subanesthetic dose of es-ketamine intravenously during three experimental sessions (Figure 1A). Data was acquired on a 7T MR system (Philips, Best, the Netherlands) with a dual-channel transmit coil and 32-channel receive coil using an interleaved fMRI/fMRS sequence8. Specific parameters were: dynamic scan time=5.1s; EPI: TR/TE/FA=31/20ms/10∘; voxel size=1.875×1.875×2.09mm3; FOV=240x240x136.5mm3; semi-LASER TR/TE=3500/36ms; bandwidth=3kHz; number of points=1024; ACC volume of interest (VOI) size=30x20x15mm; VAPOR water-suppression; dynamic linear shim+shared optimized set of second order shims9. VOI placement and mean spectra per condition are shown in Figure 2.
Analysis
fMRI: Data were preprocessed using in-house scripts and fMRIprep v20.1.110-11. Then, data were smoothed (6mm), and WM, CSF, and 6 motion parameters and their derivatives were regressed from the signal. Volumes with framewise displacement (FD)>1mm were excluded. First-level general linear model (GLM) analyses contrasted the infusion blocks to baseline and were carried out in FSL-FEAT12 (Figure 1B).
fMRS: Data processing and dynamic fitting was done in FSL-MRS13-15. Processing included coil combination, phase- and frequency alignment, and eddy-current correction. Spectral fitting was performed using a basis set of 19 simulated metabolites and a measured macromolecular baseline16. Phase, frequency, Lorentzian lineshape- and baseline parameters were fixed. Metabolite concentrations and Gaussian lineshape parameters (sigma) were fitted using the temporal model (first-level GLM) (Figure 1B).
Statistics
Higher-level analyses investigated changes from baseline for each infusion block using one-sample t-tests (time-dependent effects) and condition differences in these changes from baseline using paired t-tests (dose-dependent effects). Contrast of parameter estimates (COPEs) were extracted from the ACC VOI and analyzed using repeated-measures ANOVA. Multiple comparison correction was done using Sidak's correction for fMRI and using FDR for fMRS.
Results
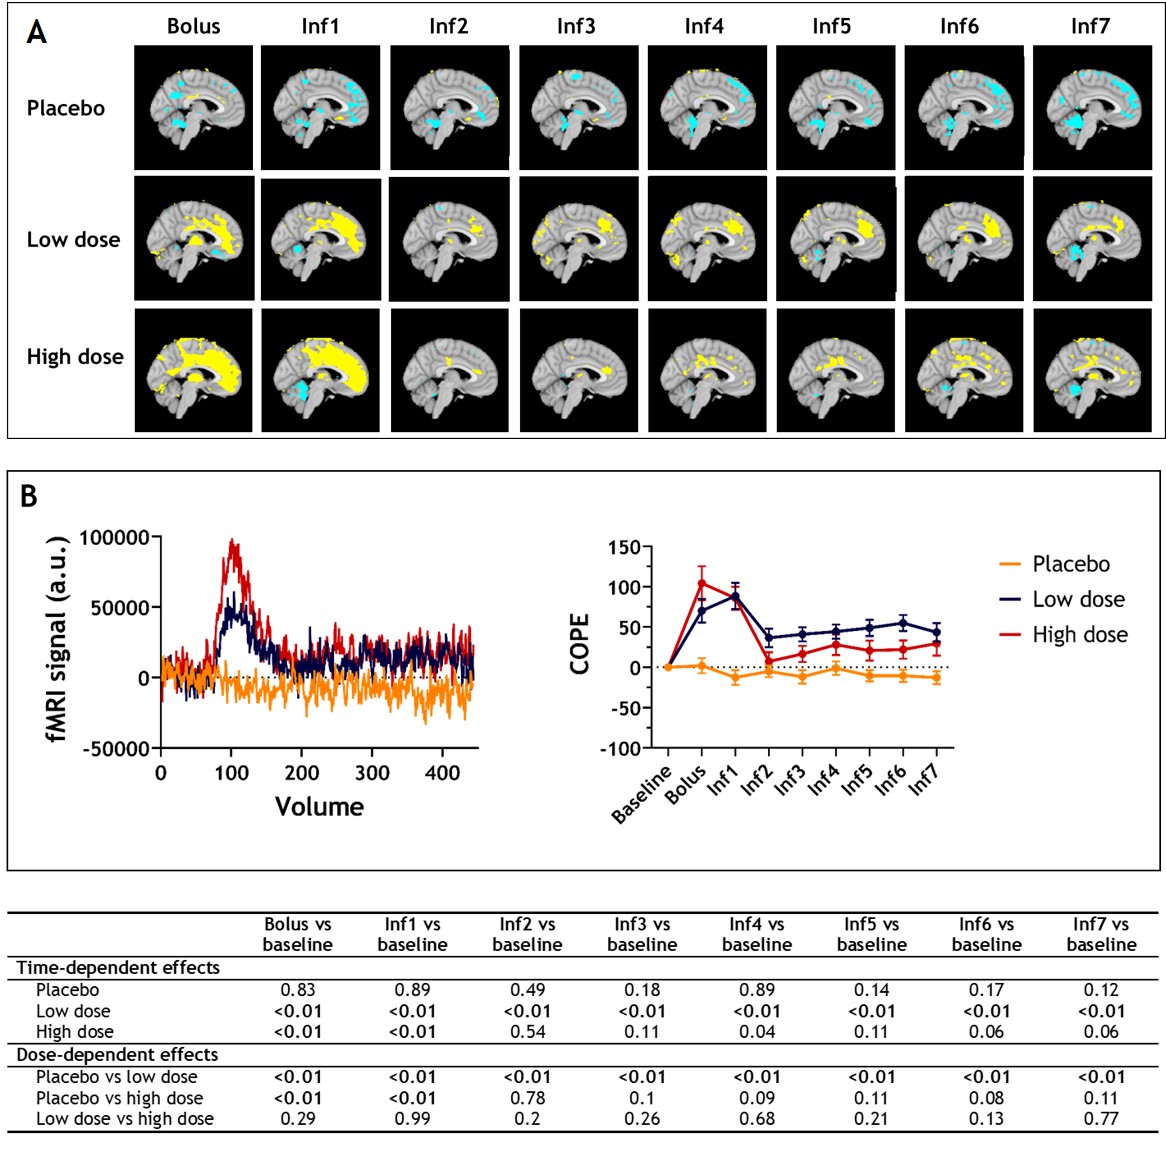
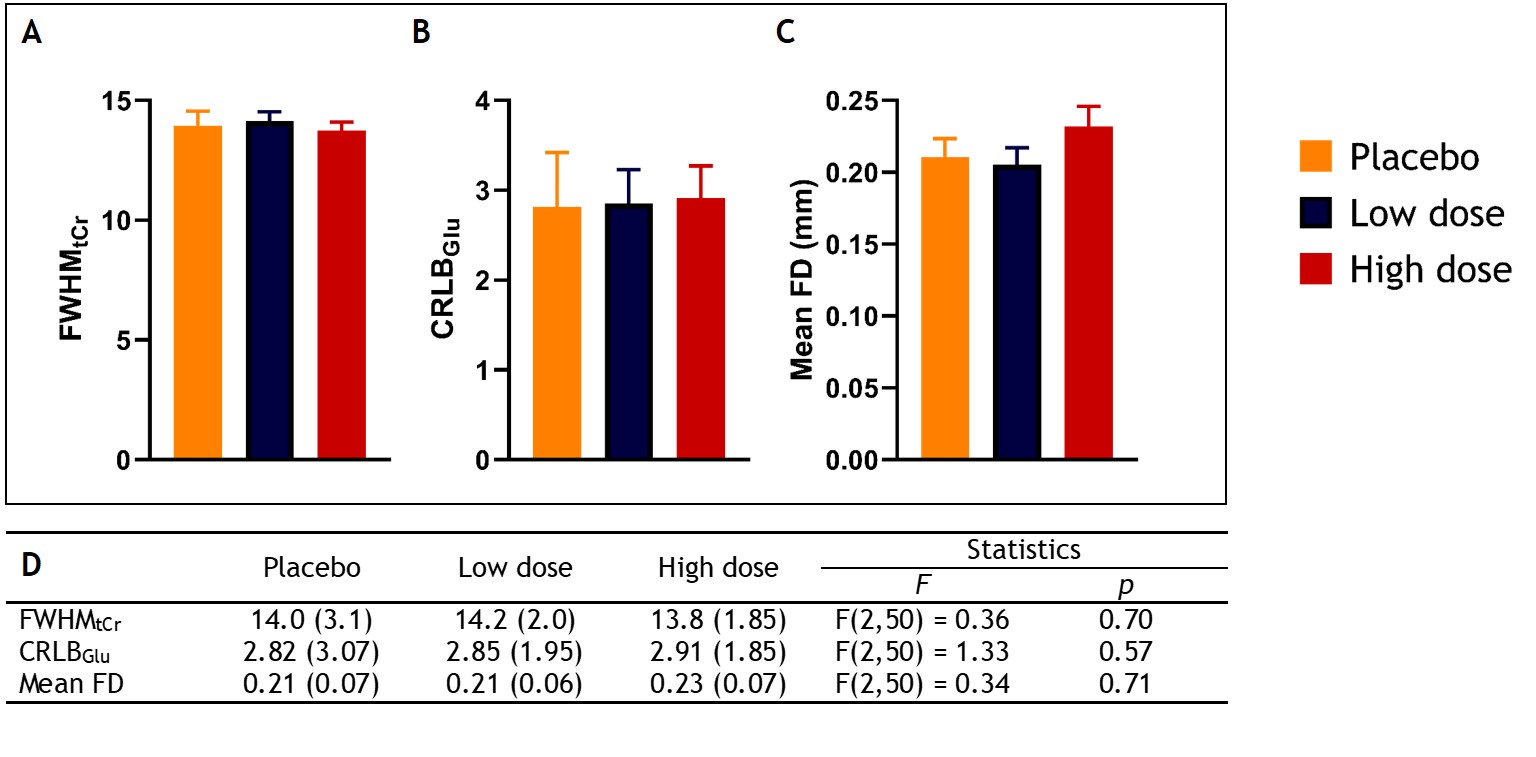
fMRI data from one participant were excluded due to insufficient quality. No participants were excluded based on CRLBGlu (CRLBglu≥15). Mean FD and spectral quality did not differ significantly between conditions (Figure 5).fMRI
Significant voxel-wise changes in BOLD were observed in all three conditions (Figure 3A). For COPE values extracted from the individual’s ACC VOI, a main effect of block (F=16.8, p<0.001), condition (F=10.7, p<0.001), and a block-by-condition interaction (F=5.2, p<0.001) was found. Results of post-hoc pairwise comparisons are shown in Figure 3B.
fMRS
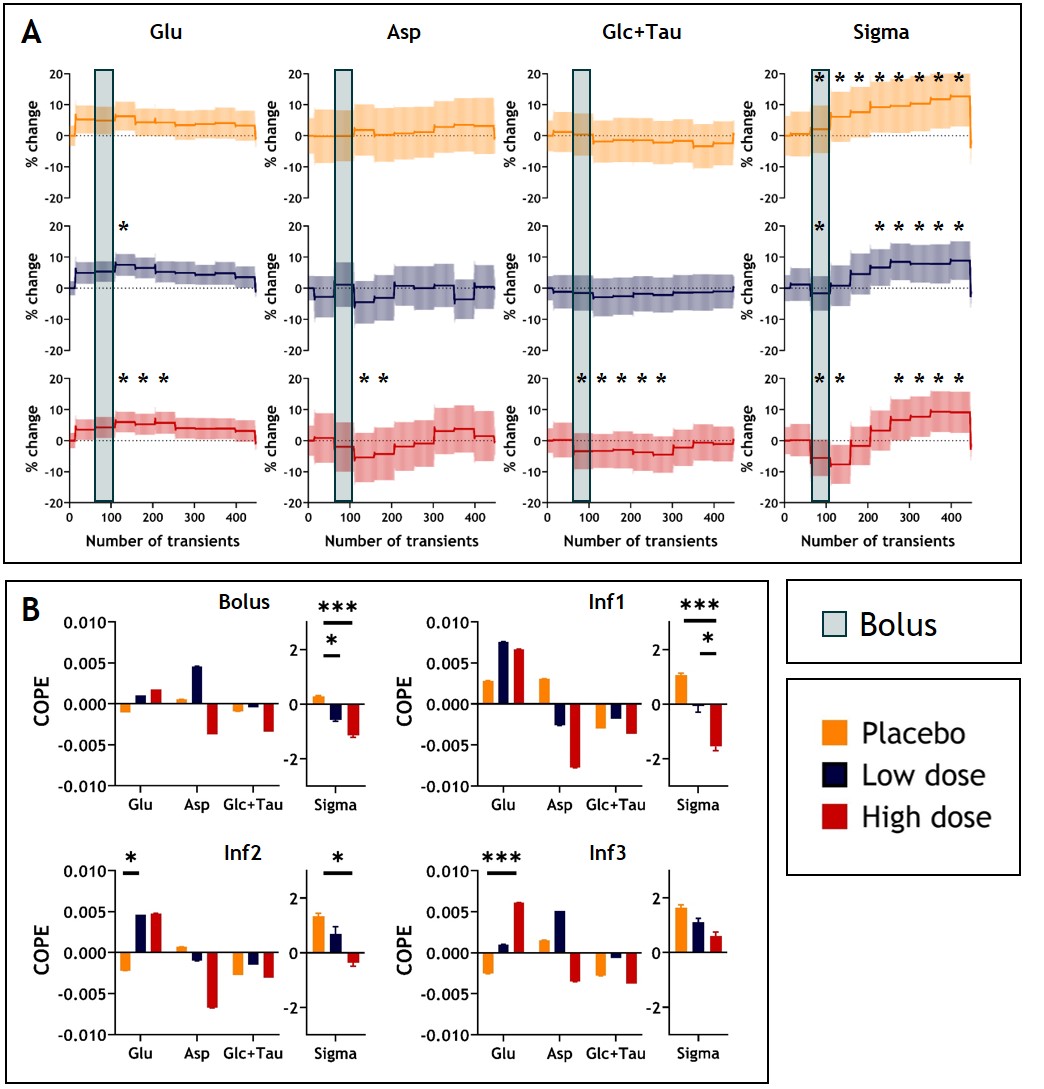
Time-dependent effects: Glu increased during the first infusion block compared to baseline in es-ketamine conditions. BOLD-induced decreases in linewidth (sigma) were observed shortly after infusion in the es-ketamine conditions, but across all sessions linewidth increased across time (possibly due to drifts) (Figure 4A). Decreases in glucose + taurine (Glc+Tau) and aspartate (Asp) were observed in the high dose condition only.
Dose-dependent effects: During the second infusion block, the Glu change from baseline was significantly higher in the low dose condition compared to placebo (p=0.048). During the third infusion block, the Glu change from baseline was significantly higher in the high dose condition compared to placebo (p=0.048). During the bolus, linewidth (sigma) was significantly lower in both low (p=0.02) and high dose (p<0.001) conditions compared to placebo. Differences between conditions were also observed in infusion blocks one (placebo vs low: p=0.03, placebo vs high: p=<0.001) and two (placebo vs high: p=0.01). No dose-dependent differences were observed for Glc+Tau and Asp (Figure 4B)
Conclusion & Discussion
Using an interleaved fMRI/fMRS sequence, the dynamic and dose-dependent effects of es-ketamine on the functional brain response were investigated. In line with our hypothesis, es-ketamine increased ACC Glu, in both a time- and dose-dependent manner. Additionally, expected concomitant decreases in Glc+Tau and Asp were observed, as previously reported with increased neuronal activity. In line with expectations and literature17, decreases in linewidth were also observed in es-ketamine conditions. Future directions include assessing the early response with increased temporal resolution, in line with previous work3. In addition, the relative contribution of the neurometabolic and hemodynamic response to the total functional response to antidepressant medication remains to be investigated.Acknowledgements
This study was supported by the NWO ZonMw (Veni 016.196.153). We would like to thank all people who have contributed to the project, as well as all participants who participated in the study.References
1. Deakin JFW, Lees J, McKie S, et al. Glutamate and the Neural Basis of the Subjective Effects of Ketamine. Arch Gen Psychiatry. 2008;65(2):154.
2. McKie S, Del-Ben C, Elliott R, Williams S, Del Vai N, Anderson I, Deakin JFW. Neuronal effects of acute citalopram detected by pharmacoMRI. Psychopharmacology. 2005;180(4):680-686.3. McMillan R, Sumner R, Forsyth A, Campbell D, Malpas G, Maxwell E, et al. Simultaneous EEG/fMRI recorded during ketamine infusion in patients with major depressive disorder. Prog Neuropsychopharmacol Biol Psychiatry. 2020;99(August 2019):109838.
4. Boucherie DE, Reneman L, Ruhé HG, Schrantee A. Neurometabolite changes in response to antidepressant medication: A systematic review of 1H-MRS findings. Neuroimage Clin. 2023 Sep 25;40:103517.
5. Javitt DC, Carter CS, Krystal JH, Kantrowitz JT, Girgis RR, Kegeles LS, et al. Utility of imaging-based biomarkers for glutamate-targeted drug development in psychotic disorders: A randomized clinical trial. JAMA Psychiatry. 2018;75(1):11-19.
6. Li M, Demenescu LR, Colic L, Metzger CD, Heinze HJ, Steiner J, Walter M. Temporal Dynamics of Antidepressant Ketamine Effects on Glutamine Cycling Follow Regional Fingerprints of AMPA and NMDA Receptor Densities. Neuropsychopharmacology. 2017;42(6):1201-1209.
7. Rowland LM, Bustillo JR, Mullins PG, Jung RE, Lenroot R, Landgraf E, et al. Effects of ketamine on anterior cingulate glutamate metabolism in healthy humans: A 4-T proton MRS study. Am J Psychiatry. 2005;162(2):394-396.
8. Henningsson M, Mens G, Koken P, Smink J, Botnar RM. A new framework for interleaved scanning in cardiovascular MR: Application to image-based respiratory motion correction in coronary MR angiography. Magn Reson Med. 2015;73(2):692-696.
9. Boer VO, Andersen M, Lind A, Lee NG, Marsman A, Petersen ET. MR spectroscopy using static higher order shimming with dynamic linear terms (HOS-DLT) for improved water suppression, interleaved MRS-fMRI, and navigator-based motion correction at 7T. Magn Reson Med. 2020; 84(3):1101-1112.
10. Esteban O, Markiewicz CJ, Blair RW, Moodie CA, Isik AI, Erramuzpe A, Kent JD, Goncalves M, DuPre E, Snyder M, Oya H, Ghosh SS, Wright J, Durnez J, Poldrack RA, Gorgolewski KJ. fMRIPrep: a robust preprocessing pipeline for functional MRI. Nat Methods. 2019 Jan;16(1):111-116.
11. Gorgolewski K, Burns CD, Madison C, Clark D, Halchenko YO, Waskom ML, Ghosh SS. Nipype: a flexible, lightweight and extensible neuroimaging data processing framework in python. Front Neuroinform. 2011 Aug 22;5:13.
12. Woolrich MW, Ripley BD, Brady M, Smith SM. Temporal autocorrelation in univariate linear modeling of FMRI data. Neuroimage. 2001; 14(6):1370-86. doi: 10.1006/nimg.2001.0931.
13. Clarke, W. T., Stagg, C. J., & Jbabdi, S. (2021). FSL-MRS: An end-to-end spectroscopy analysis package. Magnetic Resonance in Medicine, 85(6), 2950-2964.
14. Clarke, W. T., Bell, T. K., Emir, U. E., Mikkelsen, M., Oeltzschner, G., Shamaei, A., Soher, B. J., & Wilson, M. (2022). NIfTI-MRS: A standard data format for magnetic resonance spectroscopy. Magnetic Resonance in Medicine, 88(6), 2358-2370.
15. Tal A. The future is 2D: spectral-temporal fitting of dynamic MRS data provides exponential gains in precision over conventional approaches. Magn Reson Med. 2023 Feb;89(2):499-507.
16. Tkác I, Oz G, Adriany G, Uğurbil K, Gruetter R. In vivo 1H NMR spectroscopy of the human brain at high magnetic fields: metabolite quantification at 4T vs. 7T. Magn Reson Med. 2009; 62(4):868-79.
17. Mangia S, Tkác I, Gruetter R, Van De Moortele PF, Giove F, Maraviglia B, Uğurbil K. Sensitivity of single-voxel 1H-MRS in investigating the metabolism of the activated human visual cortex at 7 T. Magn Reson Imaging. 2006 May;24(4):343-8.
Figures