1913
31P MRSI multi-channel signal combination using 23Na coil sensitivity profiles at 7T: further evaluations in silico, on phantom, and in vivo1UMC Utrecht, Utrecht, Netherlands, 2Tesla Dynamic Coils B.V., Zaltbommel, Netherlands, 3Eindhoven University of Technology, Eindhoven, Netherlands
Synopsis
Keywords: Image Reconstruction, Spectroscopy, multi-channel signal combination
Motivation: Multi-channel 31P MRSI signal combination is challenging due to low intrinsic SNR.
Goal(s): Improve multi-channel 31P signal combination for a multi-tuned 31P/23Na head coil receiver array.
Approach: Combining 15-channel 31P data using the 23Na sensitivity maps received with the same dual-tuned array. The results are evaluated quantitatively and qualitatively in silico, on phantom scans, and in vivo.
Results: Simulation shows <5% SNR-decrease by combining 31P signals using 23Na sensitivities. Phantom data shows 25% SNR-decrease but also potential for mitigating point-spreading effect. In vivo data analysis shows 5% SNR increase when the intrinsic SNR is low but 15% decrease after the dataset is denoised.
Impact: This study explores an alternative approach for multi-channel 31P MRSI signal combination. The performance is positive when intrinsic SNR is low. This approach can be extended to other X-nuclei with not-too-far Larmor frequencies if multi-tuned receiver antennas are used.
Introduction
31P MRSI has potential in oncology and metabolism studies, yet the SNR is low. Attributing to the increasing field strength and parallel imaging technique, the interest in 31P MRSI, as well as other X-nuclei is rising again. However, unlike conventional MRI which benefits from the massive natural abundance of 1H, 31P is not sufficiently abundant for coil sensitivity approximation within reasonable scan time. A commonly used method is to approximate the sensitivity maps by averaging the first few FID points of received 31P signal. However, this method is severely sub-optimal when the intrinsic SNR is low. As an alternative, we use 23Na sensitivity maps acquired with the same dual-tuned receiver array for multi-channel signal combination1. Such method prevents areas with low SNR but surrounded by areas with high SNR from a coil combination biased by erroneous coil sensitivity maps. We performed evaluations based on numerical simulations, multi-compartment phantom scans, and in vivo scans. We did qualitative and quantitative comparisons over the commonly used 31P-based combination and the 23Na-based combination side by side.Methods
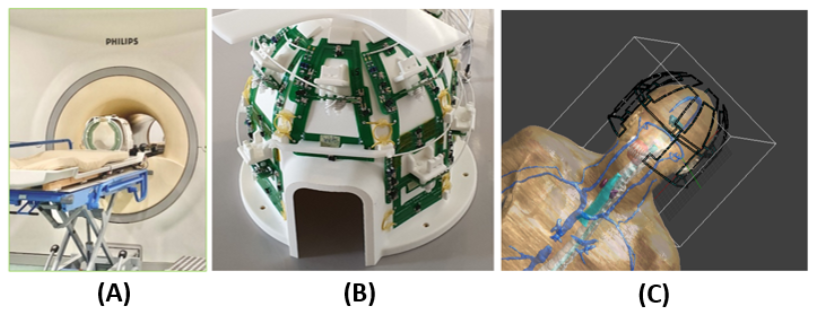
Hardware: A 15-channel dual-tuned (31P-23Na) head coil array is used2 (Figure 1A-B). MR experiments were performed on Philips Achieva 7T system (Philips, Best).Simulations: EM simulations were performed on Sim4Life (ZMT, Switzerland). Duke3 was used as the subject load. With the model in Figure 1C, we simulated B1- distributions of each coil array element at 120.7 MHz (31P@7T) and 78.9 MHz (23Na@7T).
Phantom scans: The phantom is in the shape of two concentric spheres. The outer sphere contains 7 g/L KH2PO4 and 9 g/L NaCl. The inner sphere contains 9 g/L NaCl only. MR data was acquired with 3D FID with 20x20x20 mm3 voxel size and 140(AP)x160(LR)x120(FH) mm3 FOV.
In vivo scans: In vivo data was acquired with 3D FID with 20x20x20 mm3 voxel size and 140(AP)x140(LR)x120(FH) mm3 FOV covering the brain of the subject.
Data processing: The EM simulations were exported and analyzed in Python using Spyder (Anaconda, USA). There we evaluated the SNR of the 31P-based and the 23Na-based combination methods as below4: $$\mathrm{SNR}\propto \frac{\mathbf{p}^{\mathbf{H}}\mathbf{R}^{-1}\mathbf{b}}{\sqrt{\mathbf{b}^{\mathbf{H}}\mathbf{R}^{-1}\mathbf{b}}}$$
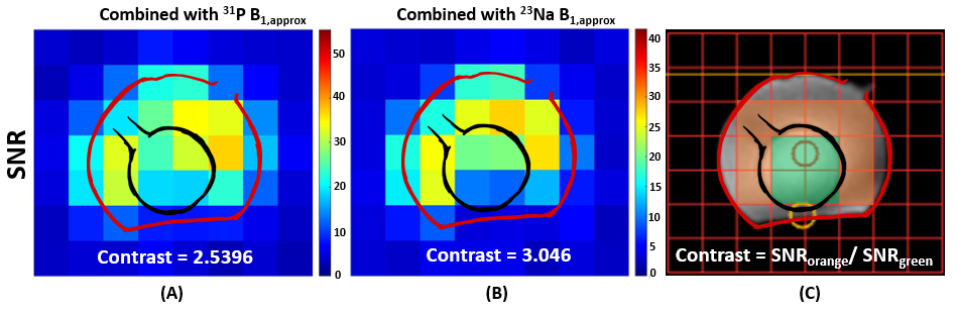
$$$\mathbf{p}$$$ is the multi-channel MR signal that is approximated by directly using 31P B1- values, $$$\mathbf{R}$$$ is the coil noise resistance matrix, $$$\mathbf{b}$$$ contains the B1- values of either 23Na or 31P. The outer-inner-sphere contrast is defined by taking the ratio between the inner sphere’s SNR summation and its neighboring voxels’ SNR summation (Figure 4C), in the central transverse slice.
The MR data were analyzed on MATLAB (Mathworks, USA). There we combined the multi-channel signal by Roemer’s uniform-sensitivity method4: $$\mathrm{S}= \frac{\mathbf{p}^{\mathbf{H}}\mathbf{R}^{-1}\mathbf{b}}{\mathbf{b}^{\mathbf{H}}\mathbf{R}^{-1}\mathbf{b}}$$
$$$\mathbf{p}$$$ is the acquired 15-channel 31P data. $$$\mathbf{R}$$$ is the coil noise resistance matrix, $$$\mathbf{b}$$$ is the approximated B1- by taking the average of the 2 to 50 FID points of 31P or 23Na signals.
Results
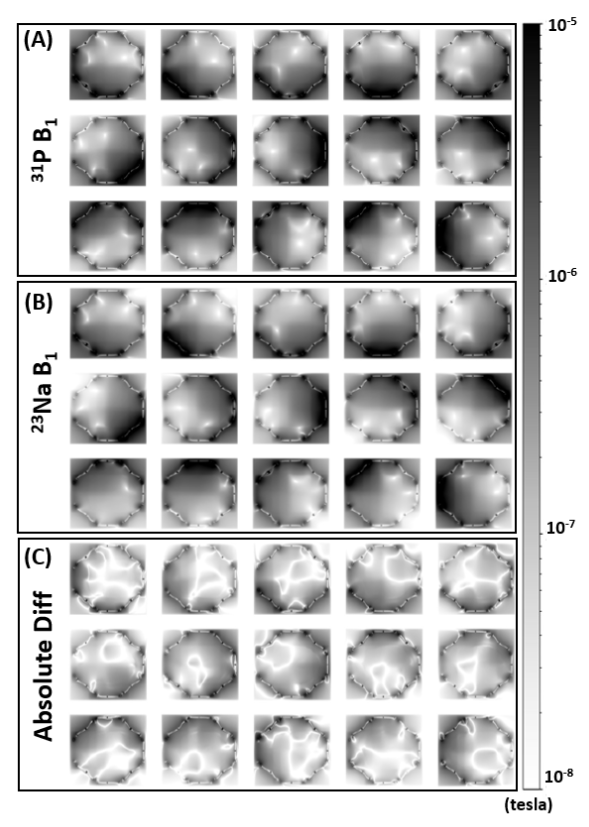
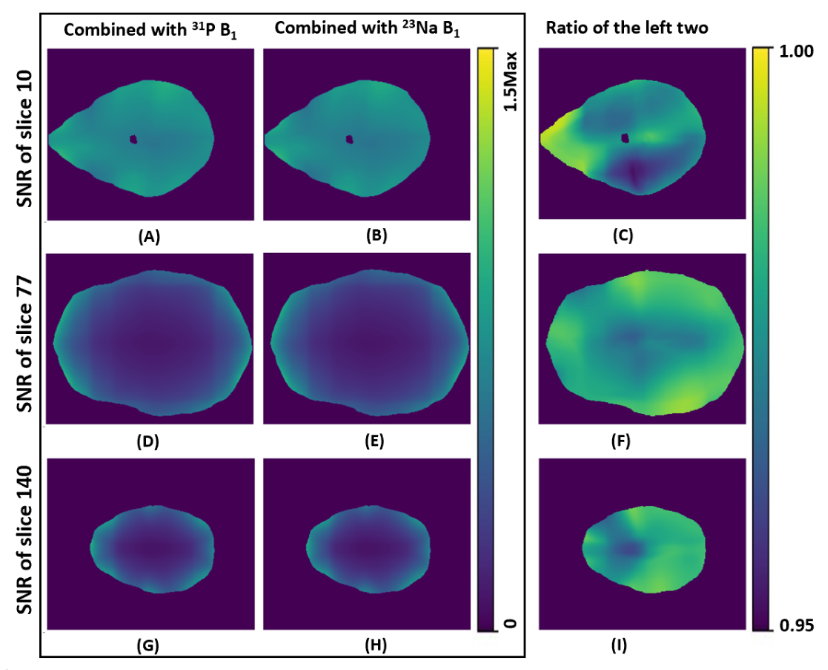
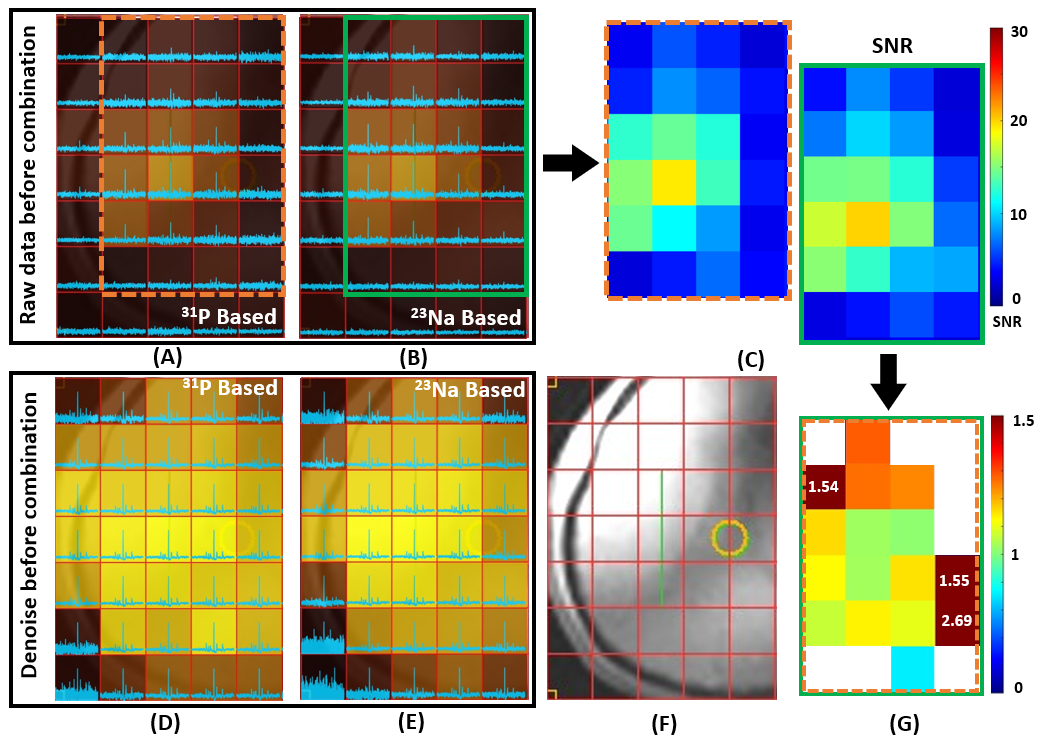
Figure 2 shows a comparison between the simulated 31P and 23Na B1- fields. Figure 3 shows the SNR evaluation of the combined results using the 31P-based method and the 23Na-based method for three transverse slices. The ratio shows the SNR loss by using 23Na sensitivity is below 5%. Figure 4 shows a comparison of the two methods based on multi-compartment phantom data. The whole-FOV SNR summation decreases 25% by using 23Na sensitivity. However, the inner-outer-sphere contrast is 20% higher when combined with 23Na sensitivities. Figure 5 shows the comparison based on in vivo data. The whole-FOV SNR summation increases 5% when using 23Na sensitivity to combine raw 31P signals, and it decreases 15% when using 23Na sensitivity to combine PCA-denoised5 31P signals.Conclusion and discussion
The EM-simulation-based analysis shows very promising results for the 23Na-based combination, which is within 5% SNR loss compared to using the exact 31P sensitivity maps. This negligible SNR loss turns into a gain when the intrinsic SNR is so low that no proper sensitivity map can be approximated from the multi-channel data. For example, in Figure 5A-B, the raw data SNR is so low that the combined result is only dominated by a few sensitive channels (might be due to subject positioning). The few dominating voxels show an SNR enhancement when using 23Na sensitivity maps for combination, particularly for voxels more distant from the coils (Figure 5G). However, when the multi-channel signals have high SNR (longer scans, denoising tools), the 31P-based method performs adequately. In contrast, the 23Na-based method underperforms quantitatively, yet qualitatively still adequate. The phantom-based analysis shows that the inner-sphere voxels, where no phosphate exists, are more distinguishable when using 23Na sensitivity for combination. This confirms our hypothesis that self-weighting can amplify the point-spread effect, while 23Na weighting provides mitigation.Acknowledgements
No acknowledgement found.References
1. Dai J, Gosselink WJM, Raaijmakers AJE, Klomp DWJ. 31P MRSI coil combination using 23Na sensitivity information acquired with the same loop array at 7T: preliminary verification. ISMRM2023 Annual meeting, Abstract number 3939.
2. Dai J, Gosselink M, van der Velden TA, Meliadò EF, Raaijmakers AJE, Klomp DWJ. An RF coil design to enable quintuple nuclear whole-brain MRI. Magn Reson Med. 2023 May;89(5):2131-2141. doi: 10.1002/mrm.29577. Epub 2023 Feb 5. PMID: 36740899.
3. Christ A, Kainz W, Hahn EG, et al. The virtual family-development of surface-based anatomical models of two adults and two children for dosimetric simulations. Phys Med Biol. 2009;55:N23-N38.
4. Roemer, P.B., Edelstein, W.A., Hayes, C.E., Souza, S.P. and Mueller, O.M. (1990), The NMR phased array. Magn Reson Med, 16: 192-225. https://doi.org/10.1002/mrm.1910160203
5. Froeling M, Prompers JJ, Klomp DWJ, van der Velden TA. PCA denoising and Wiener deconvolution of 31P 3D CSI data to enhance effective SNR and improve point spread function. Magn Reson Med. 2021; 85: 2992– 3009. https://doi.org/10.1002/mrm.28654
Figures