1912
Quantitively Accurate Bipolar Quantitative Chemical Shift Encoded Imaging Using the Gradient Impulse Response Function1Medical Physics, UW Madison, Madison, WI, United States, 2Radiology, UW Madison, Madison, WI, United States
Synopsis
Keywords: Image Reconstruction, Quantitative Imaging, GIRF, PDFF, CSE
Motivation: Quantitative chemical shift encoded (CSE) imaging enables accurate measurement of proton density fat fraction (PDFF) but requires breath holding that can be affected by motion artifacts.
Goal(s): We aim to develop a more rapid, bipolar readout CSE acquisition.
Approach: Gradient impulse response function (GIRF) was used to account for gradient-related phase errors that complicate PDFF measurements in bipolar acquisitions.
Results: Bipolar CSE with GIRF correction enabled accurate PDFF measurement with similar results to conventional unipolar readout CSE with a 40% reduction in scan time.
Impact: This study explores the application of GIRF and how it could be used in a bipolar CSE for PDFF measurement. Results are comparable to conventional unipolar CSE but yield significant scan time reduction.
Introduction
Chemical shift-encoded (CSE) MRI sequences can provide accurate proton density fat fraction (PDFF) quantification while accounting for multiple confounding factors1. These sequences find much use especially in abdominal and liver imaging due to the clinical need to diagnose and stage liver steatosis or non-alcoholic fatty liver disease1,2. However, one of the drawbacks of is that these acquisitions suffer from prolonged scan times which can be exacerbated by the necessity for breath holds to control for motion artifacts. CSE acquisitions are typically multi-echo with unipolar readouts. The unipolar setup is intrinsically less time efficient than a bipolar readout, however it is utilized to reduce phase errors. To improve scan efficiency, we explored implementing a gradient impulse response function (GIRF) correction to a bipolar CSE sequence. The GIRF technique has been previously explored as a linear-time invariant method used to estimate the k-space trajectory by accounting for systemic errors3,4.Methods
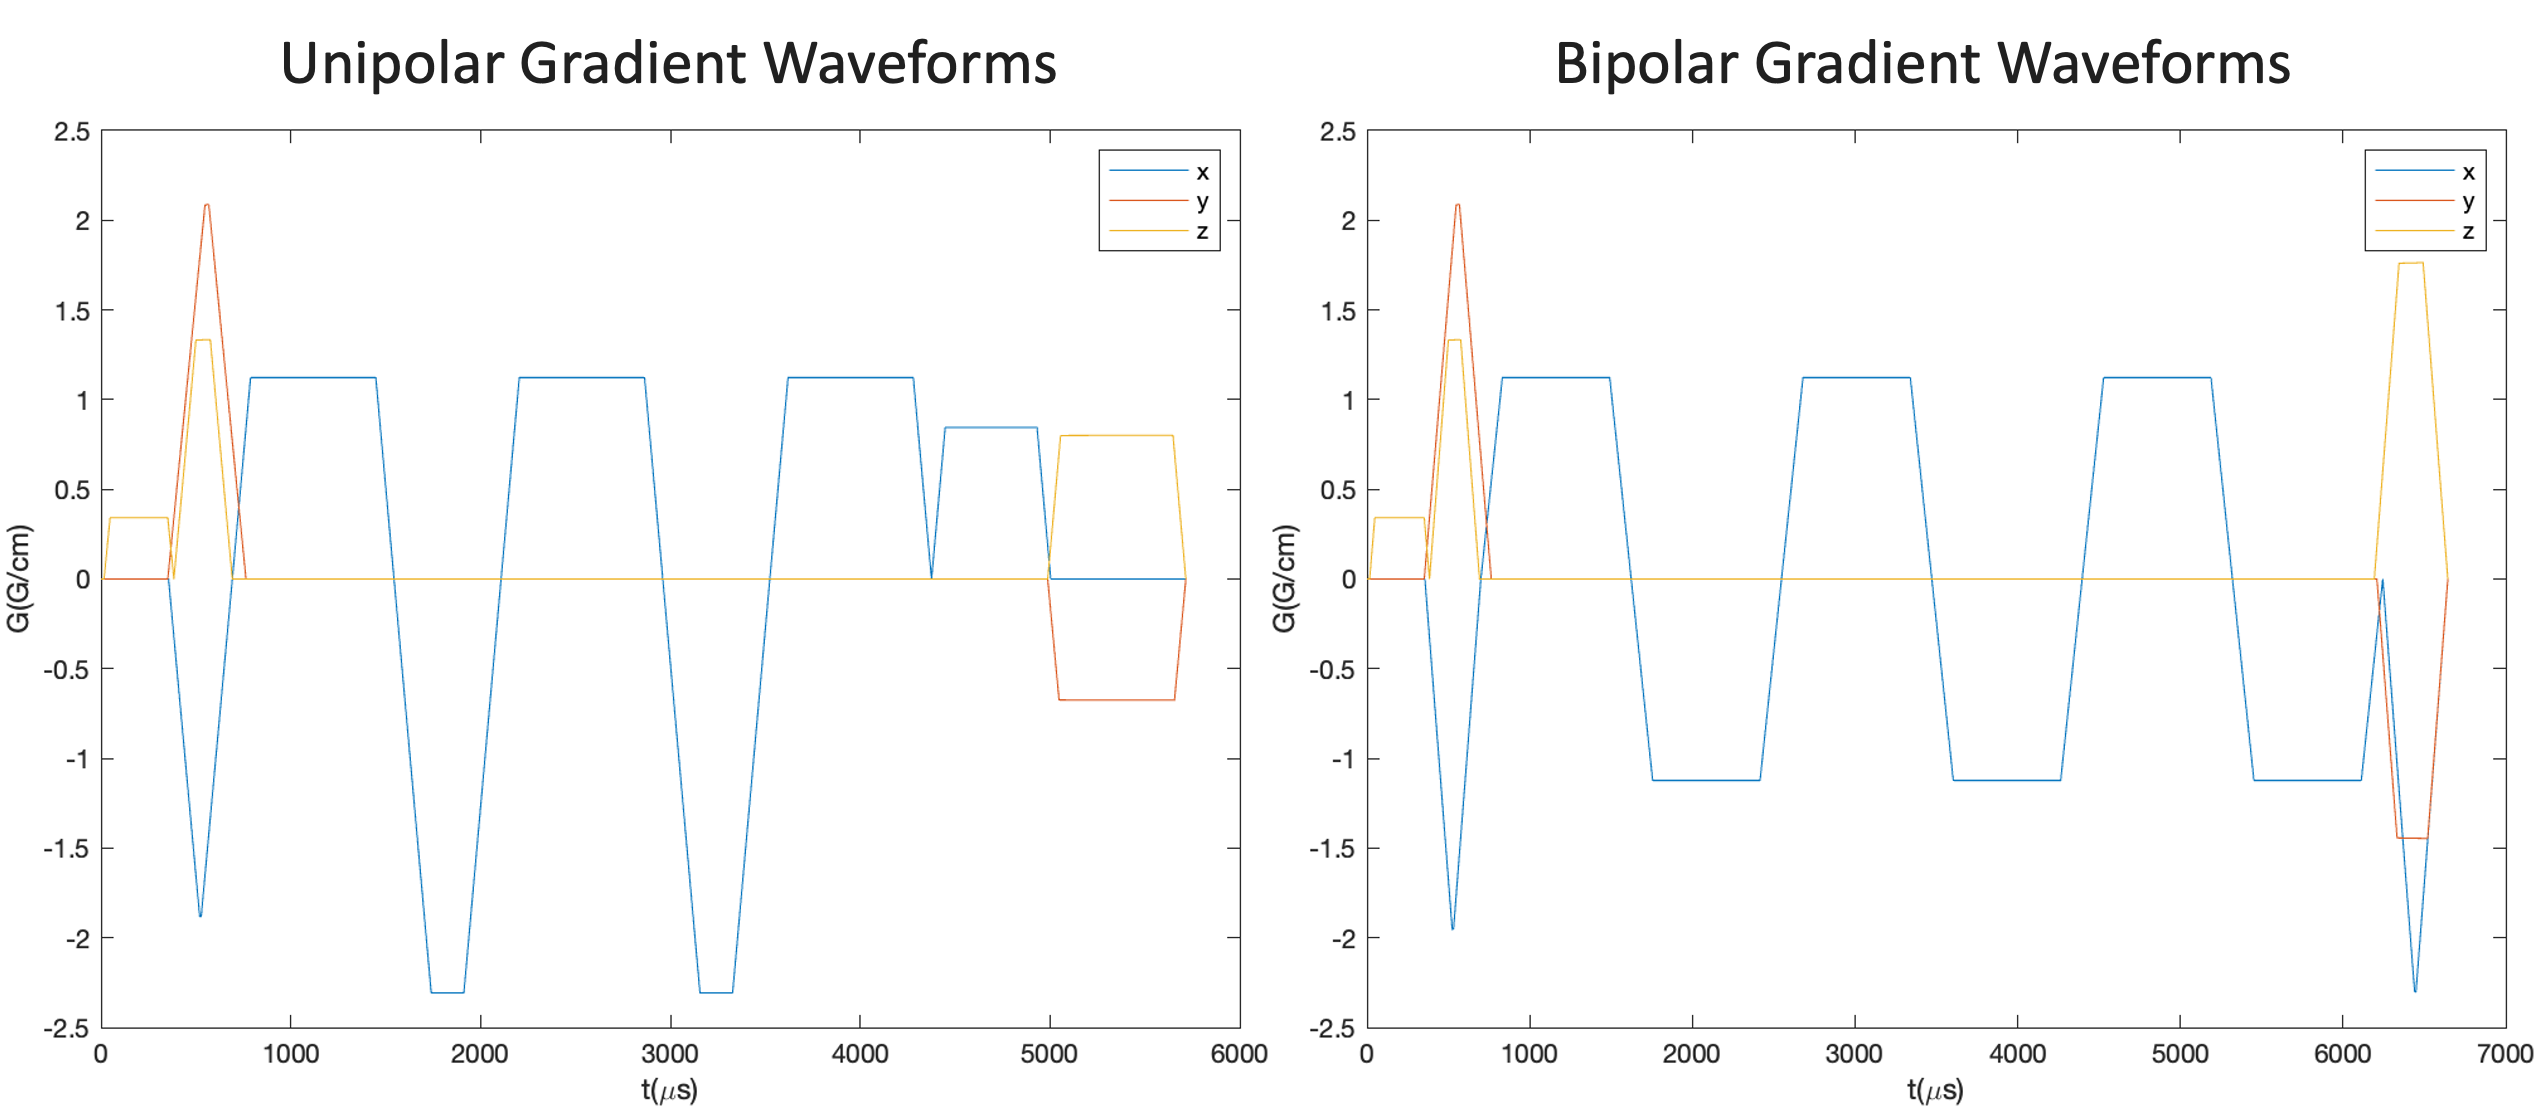
GIRF Acquisition: Before the CSE scans were acquired, a custom pulse sequence was used to measure GIRF on a 3T PET/MR scanner (GE Signa PET/MR). Our implementation of GIRF was performed using a single point imaging approach with acquisition along each physical gradient axis (X, Y, and Z)3. GIRF measurement was performed on a spherical phantom with a chirp waveform that was played out with a frequency sweep of 0.1 to 10kHz4,5.Quantitative CSE Acquisition: After GIRF was acquired, images were obtained in both unipolar and bipolar configurations in a phantom and in two subjects. Unipolar images were acquired in two shots with three echoes; due to TE constraints, one shot with six echoes was not possible. The bipolar images were acquired with one shot with six echoes. Other parameters used were set identically: FOV = 40cm, slice thickness = 5, slices = 38, frequency = 160, phase = 160, TE = minimum, NEX = 0.75, BW = 100, ARC slice = 2, ARC phase = 2. The phantom contained 15 vials with fat fractions of 0%, 10% and 20% from bottom to top. In-vivo evaluations were conducted on two volunteers.
Reconstruction: During each of the CSE acquisitions, the gradient waveform was saved to perform a GIRF-corrected reconstruction using regridding for both unipolar and bipolar acquisitions. The nominal (uncorrected) readout was reconstructed for bipolar acquisitions to demonstrate the large improvement enabled by incorporating GIRF. CSE data were processed with a graph-cut water/fat separation script and a magnitude fitting script to generate water-only, fat-only, and fat fraction images6,7.
Results
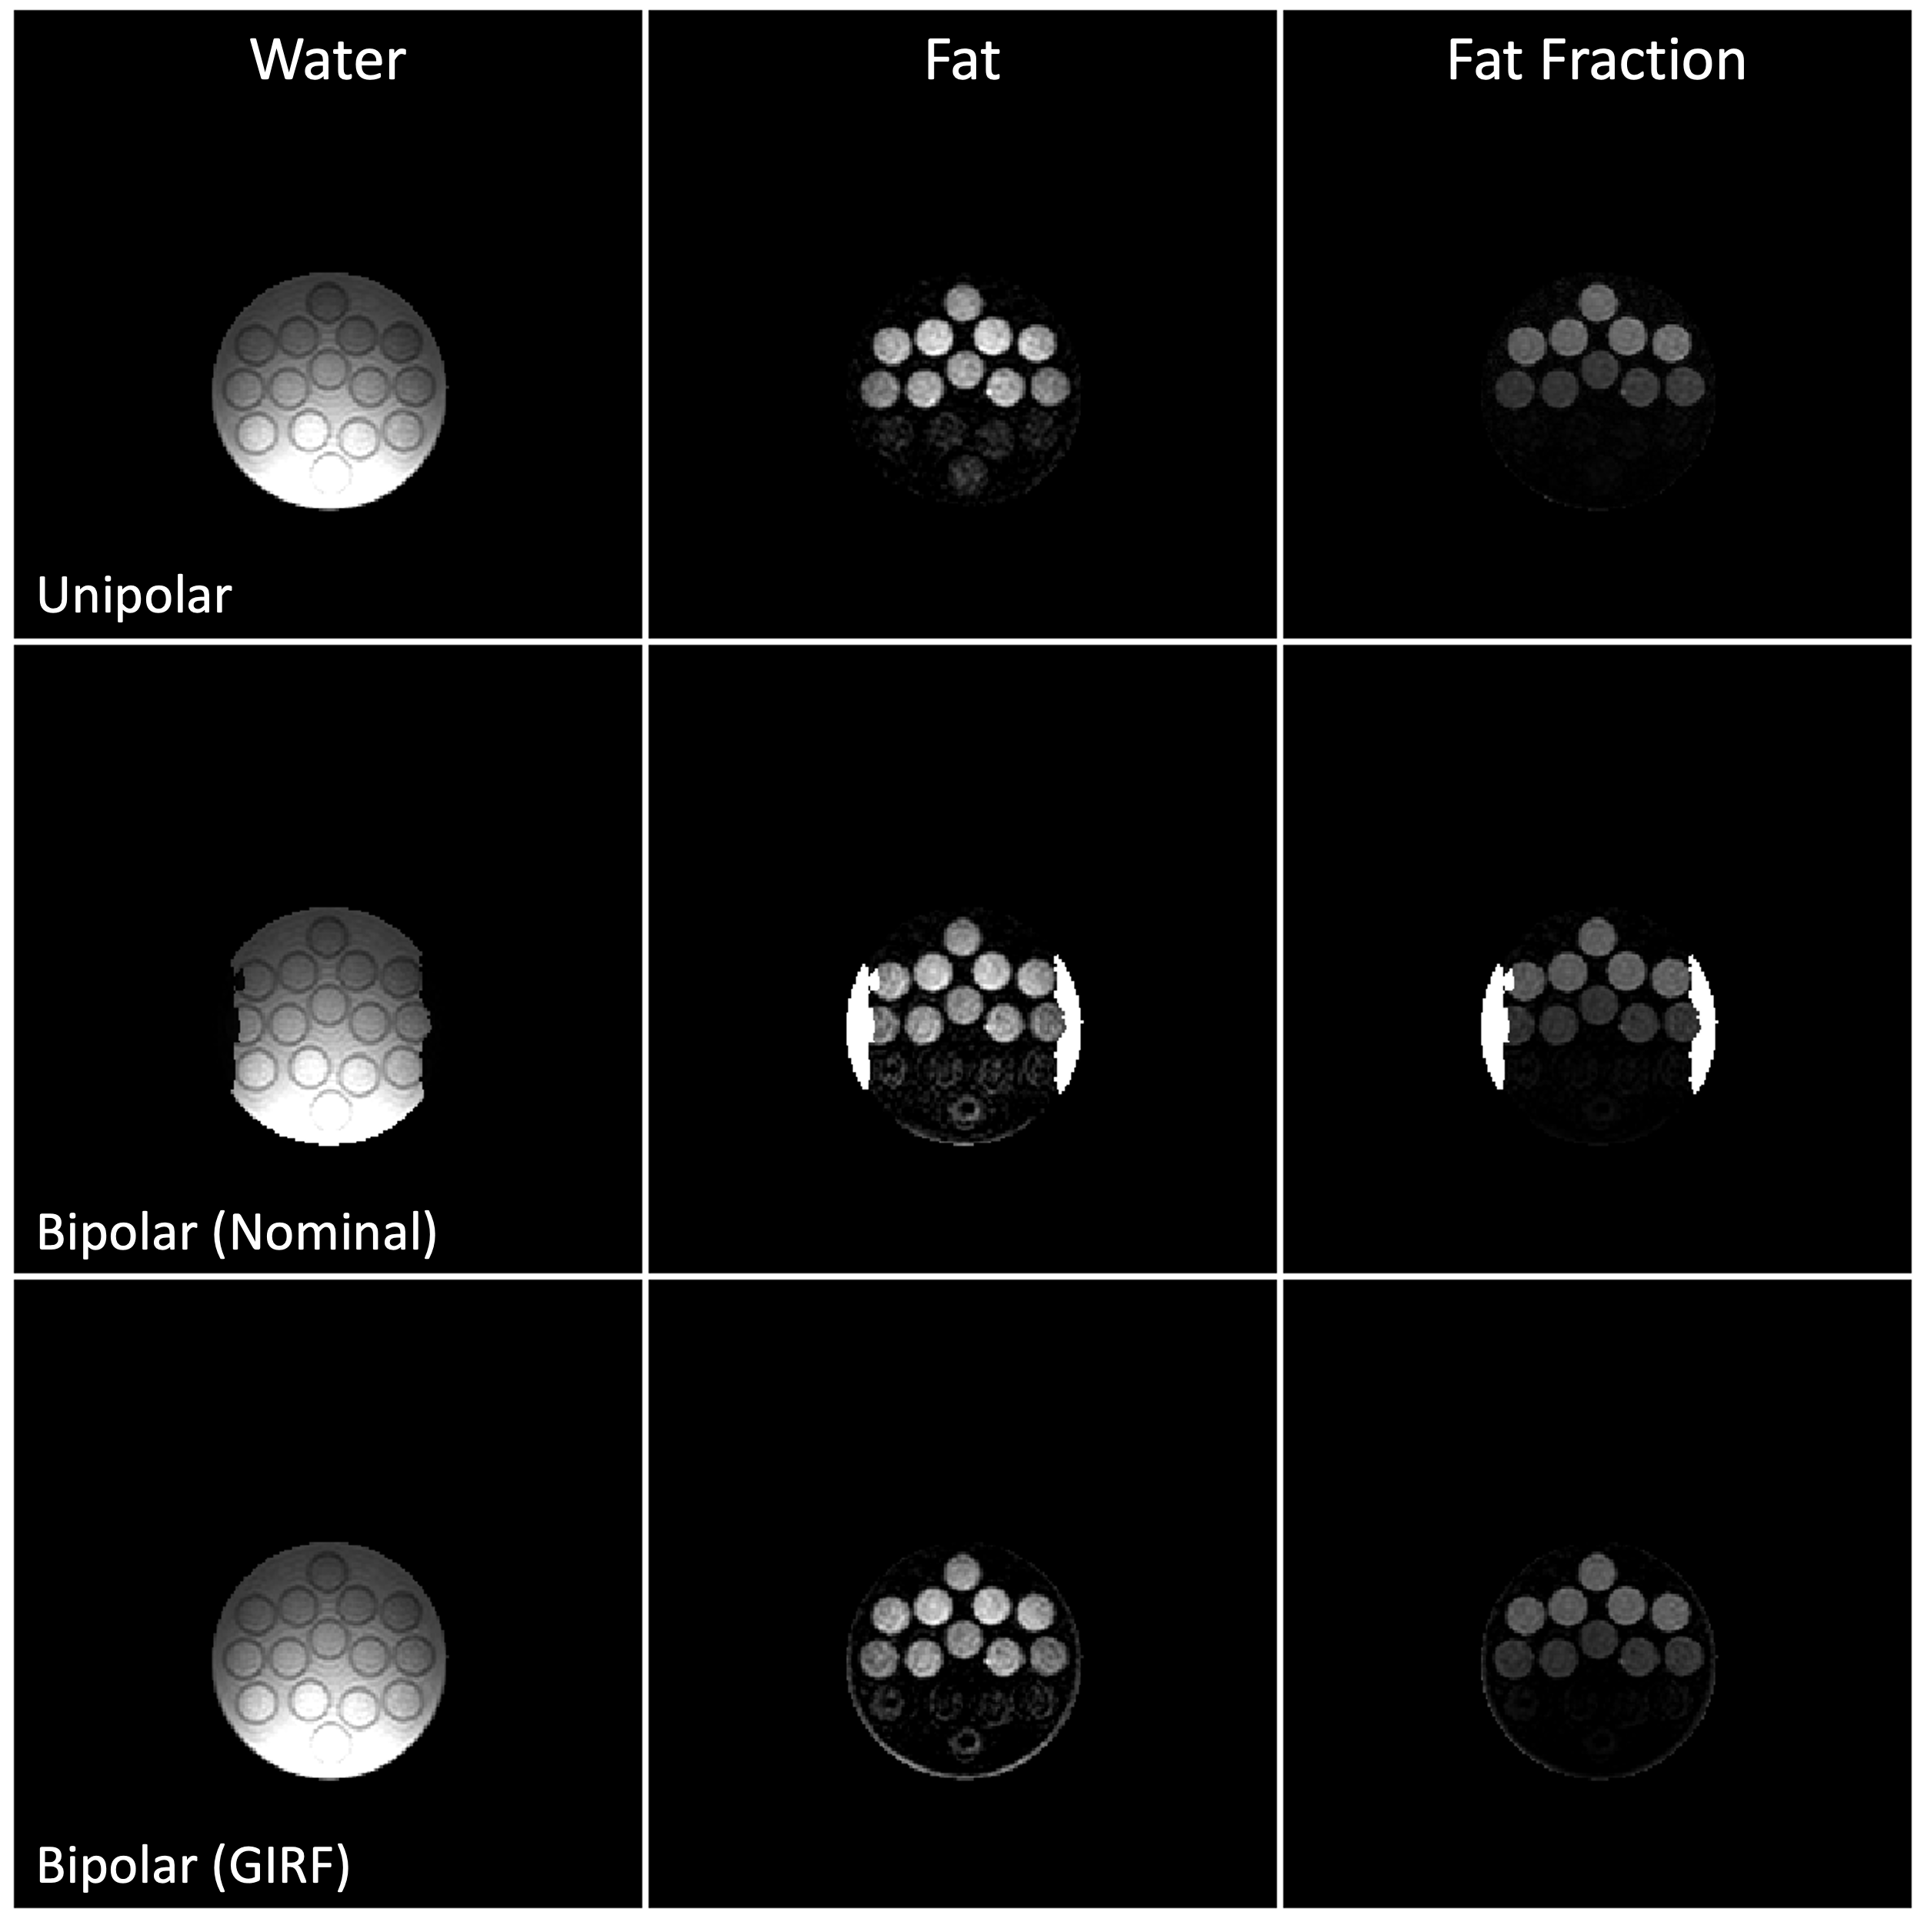
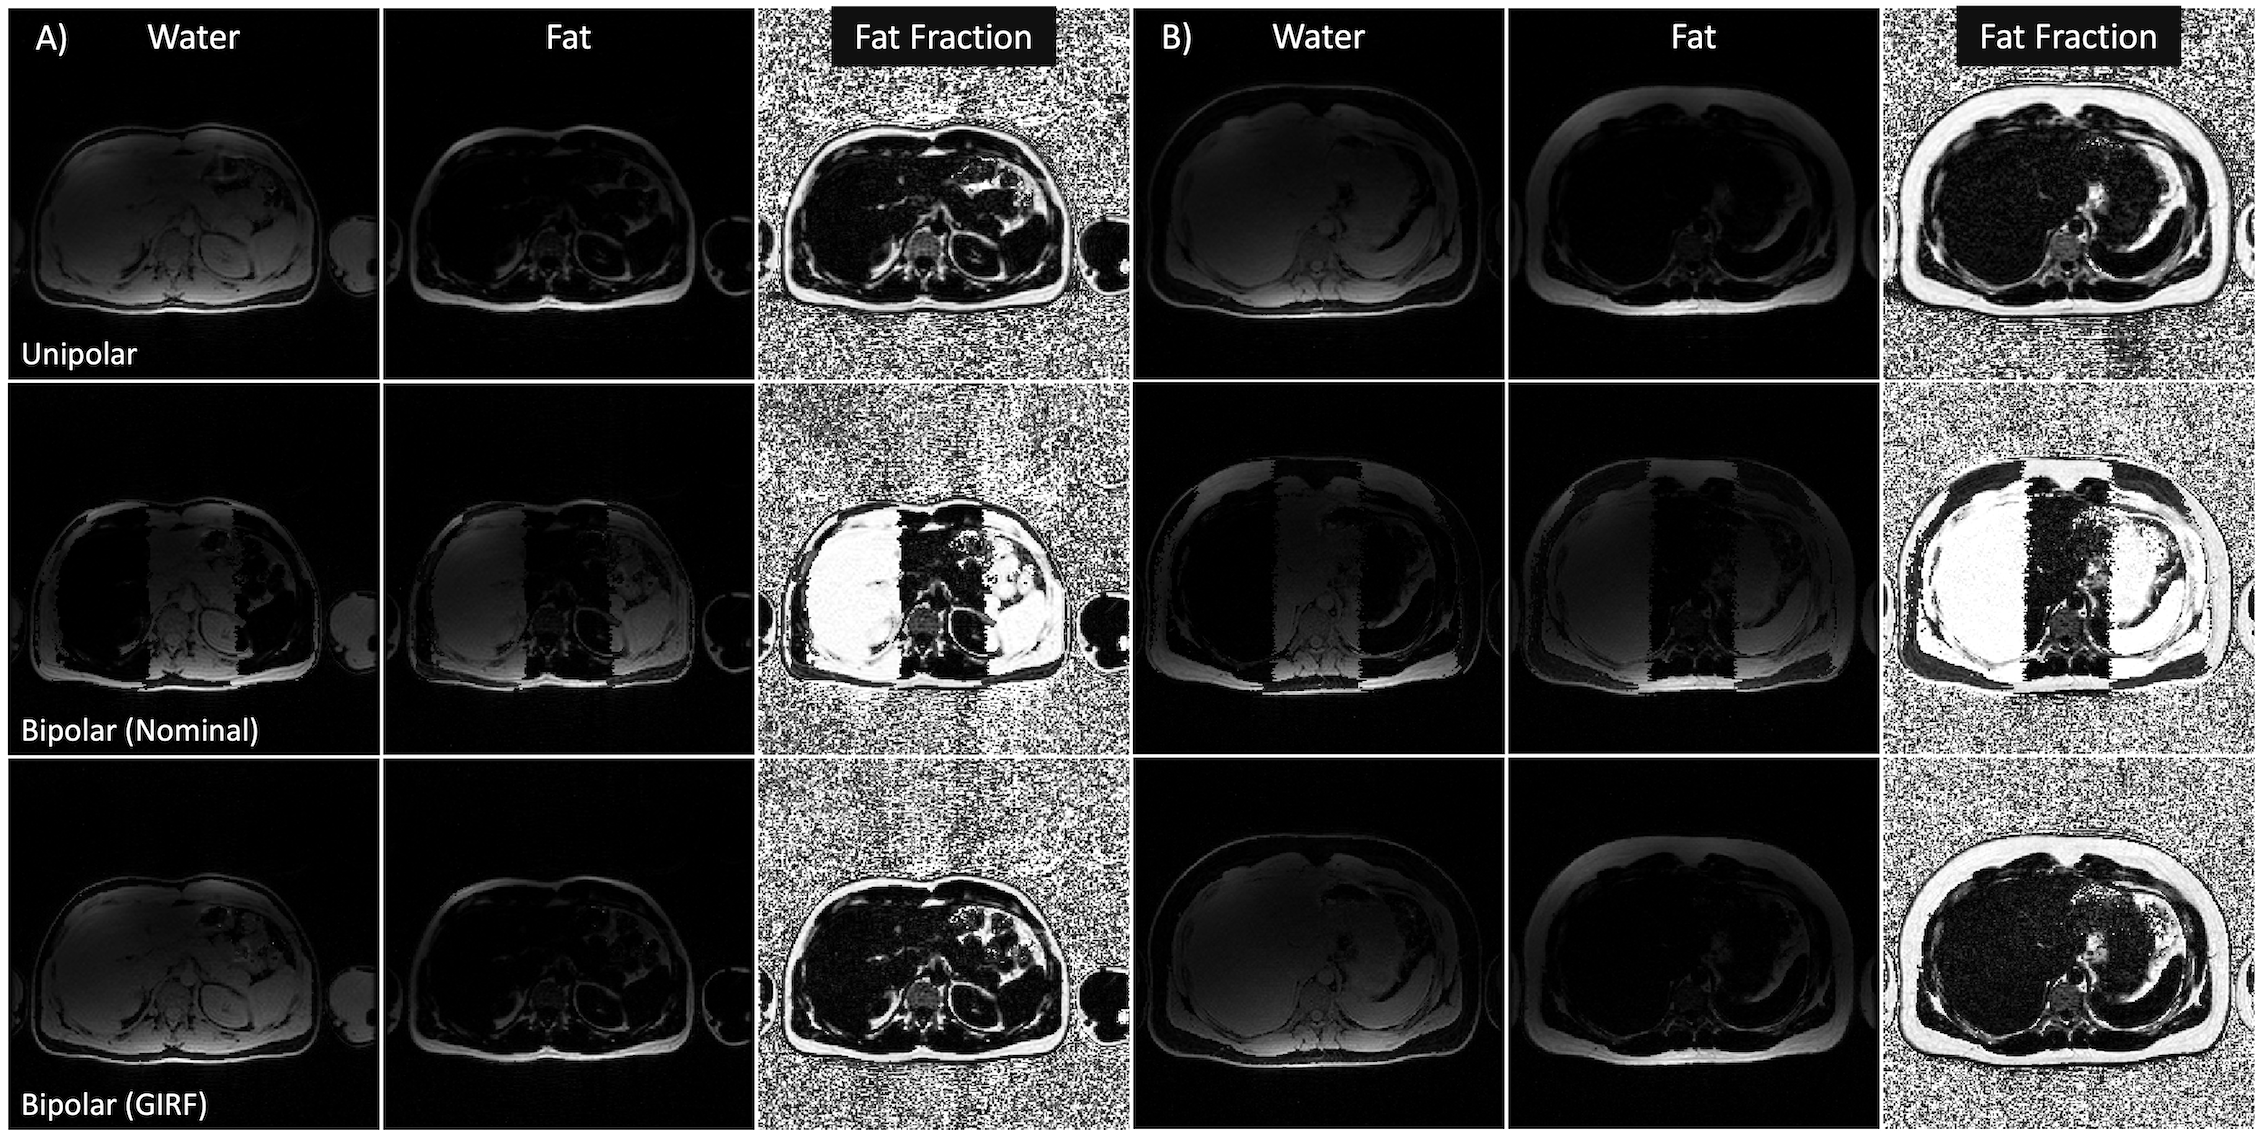
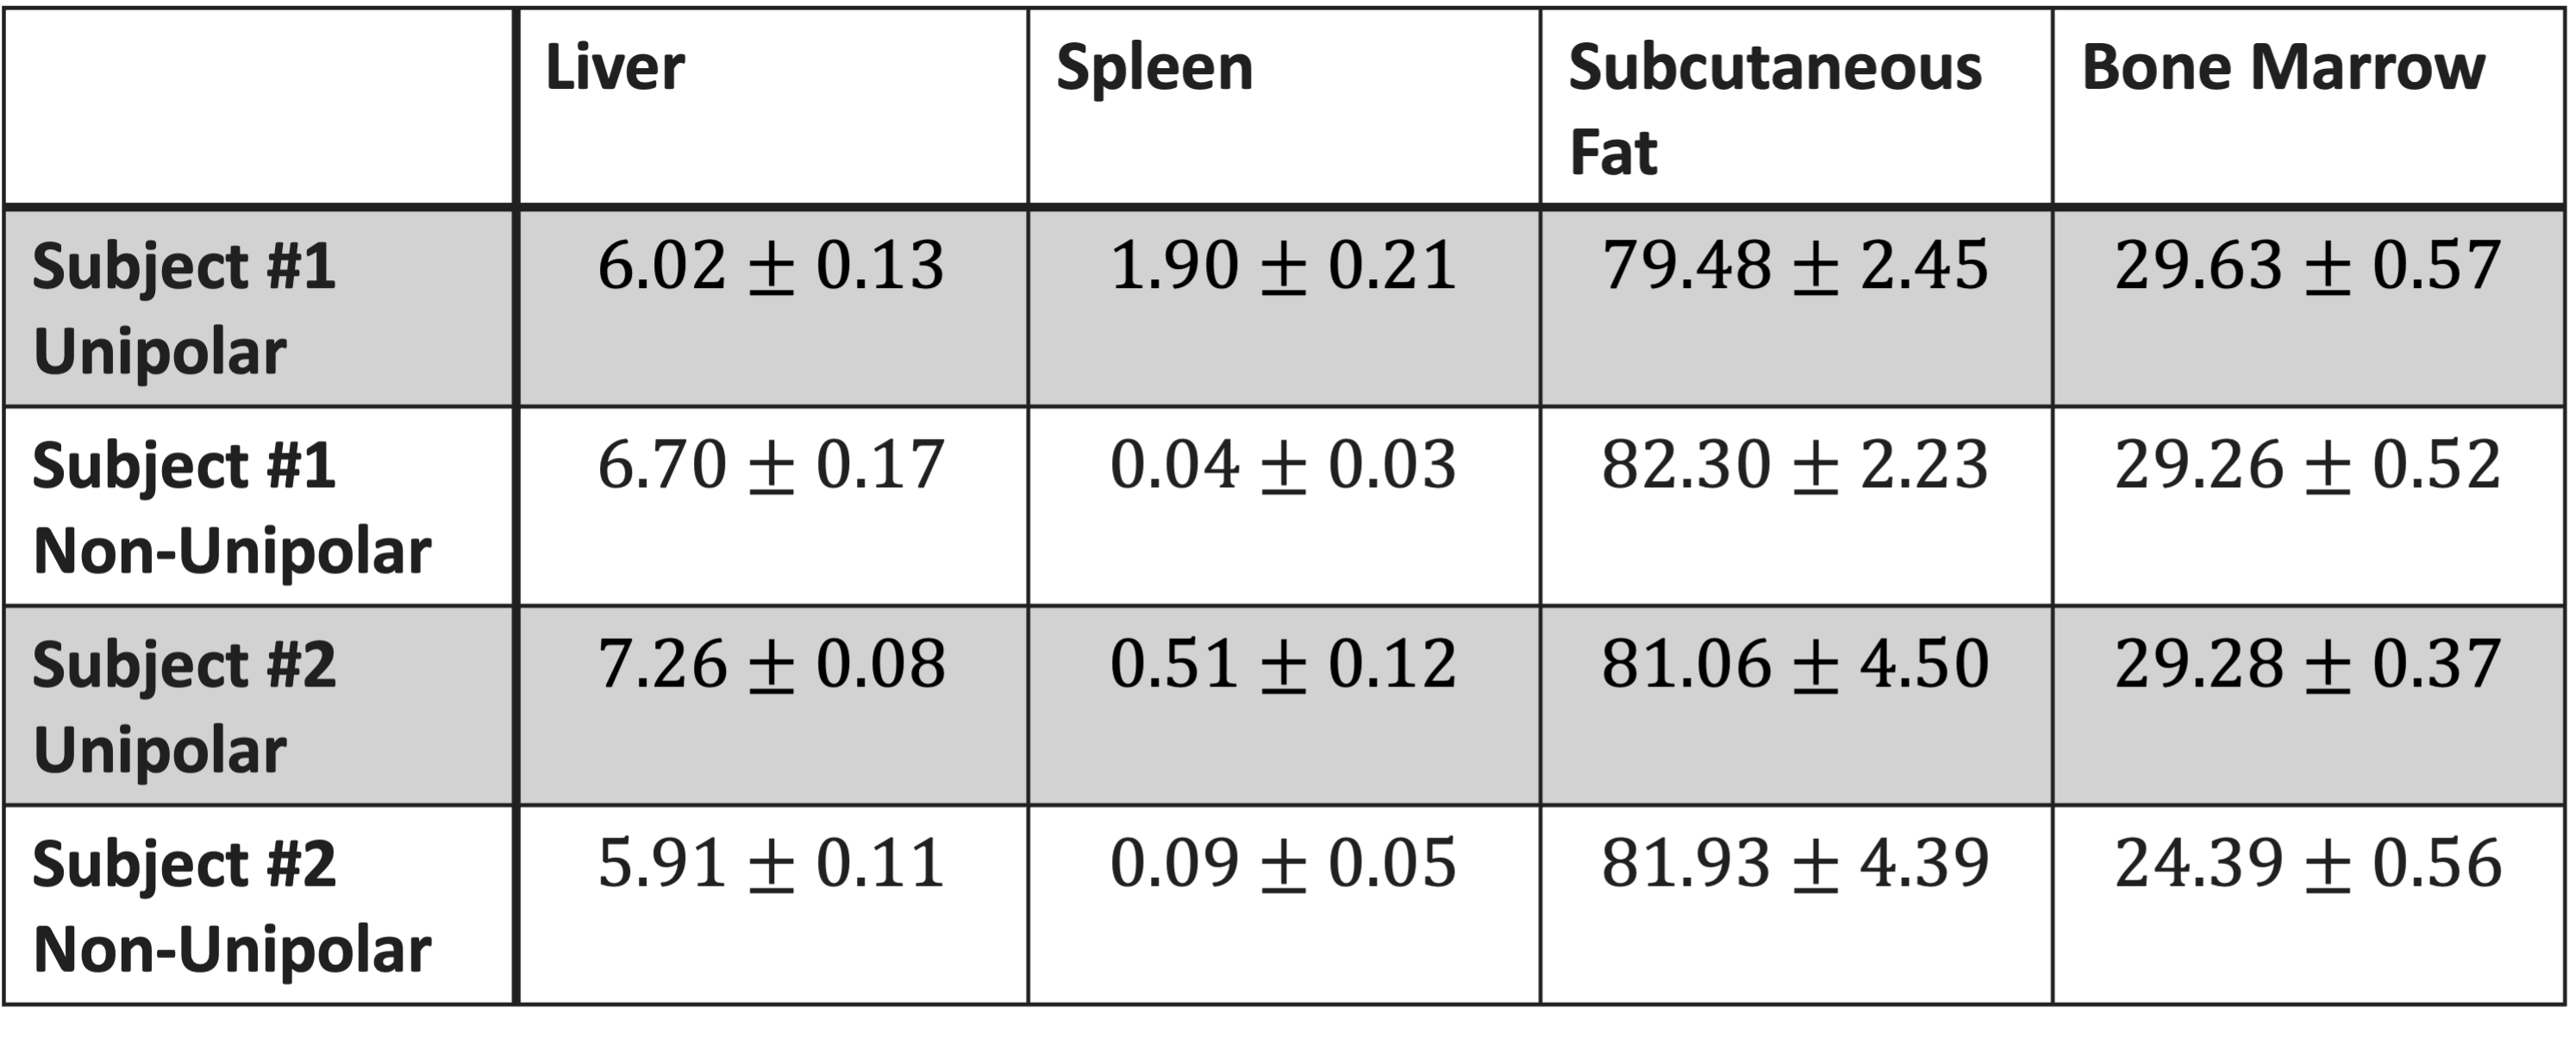
The standard unipolar configuration had a scan time of 22s while the bipolar configuration had a scan time of 13s when using the best matching scanning parameters. Further changes to parameters such as BW could reduce the bipolar scan time down to 10s. With the time saved, this allows for higher resolution images up to 256x256 (21s) or to enable significantly shorter breath-holds. The phantom images obtained show very similar fat fractions when using a bipolar readout with GIRF-corrected reconstruction compared to the standard unipolar readout (also using GIRF-corrected reconstruction) as seen in Figure 2. Comparing the fat fraction values of unipolar to the bipolar showed fat fraction differences of 1.87%. The nominal uncorrected bipolar reconstruction showed fat fraction differences of 12.0% and poor image quality.Although the fat fraction values are very similar within the phantom, fat fraction values show a bit more variability in-vivo. The images acquired for subjects #1 and #2 are shown below in Figure 3. ROIs were drawn to determine fat fractions in organs of interest. The fat fractions results for each ROI are shown below in Figure 4.
Discussion and Conclusion
The use of a bipolar readout in CSE enables greatly reduced scan times; however, the impact of gradient imperfections is quite significant as seen from the nominal images in Figures 2 and 3. As such, it is necessary to use a GIRF adjusted k-space trajectory to counteract the effects observed. Fat fraction measurements show that GIRF-corrected bipolar CSE produced similar results to the unipolar CSE in both phantom and in-vivo scans. Future research will focus on further evaluating the fat fraction quantification and exploring other strategies that could be used to increase scan efficiency.Acknowledgements
No acknowledgement found.References
1. Eskreis-Winkler S, Corrias G, Monti S, Zheng J, Capanu M, Krebs S, Fung M, Reeder S, Mannelli L. IDEAL-IQ in an oncologic population: meeting the challenge of concomitant liver fat and liver iron. Cancer Imaging. 2018 Dec 12;18(1):51. doi: 10.1186/s40644-018-0167-3. PMID: 30541635; PMCID: PMC6292167.
2. Corrias G, Krebs S, Eskreis-Winkler S, Ryan D, Zheng J, Capanu M, Saba L, Monti S, Fung M, Reeder S, Mannelli L. MRI liver fat quantification in an oncologic population: the added value of complex chemical shift-encoded MRI. Clin Imaging. 2018 Nov-Dec;52:193-199. doi: 10.1016/j.clinimag.2018.08.002. Epub 2018 Aug 8. PMID: 30103108; PMCID: PMC6289595.
3. Jang H, McMillan AB. A rapid and robust gradient measurement technique using dynamic single-point imaging. Magn Reson Med. 2017 Sep;78(3):950-962. doi: 10.1002/mrm.26481. Epub 2016 Oct 3. PMID: 27699867; PMCID: PMC5378680.
4. Addy NO, Wu HH, Nishimura DG. Simple method for MR gradient system characterization and k-space trajectory estimation. Magn Reson Med. 2012 Jul;68(1):120-9. doi: 10.1002/mrm.23217. Epub 2011 Dec 21. PMID: 22189904; PMCID: PMC4048453.
5. Kronthaler S, Rahmer J, Börnert P, Makowski MR, Schwaiger BJ, Gersing AS, Karampinos DC. Trajectory correction based on the gradient impulse response function improves high-resolution UTE imaging of the musculoskeletal system. Magn Reson Med. 2021 Apr;85(4):2001-2015. doi: 10.1002/mrm.28566. Epub 2020 Nov 30. PMID: 33251655.
6. Hernando D, Kellman P, Haldar JP, Liang ZP. Robust water/fat separation in the presence of large field inhomogeneities using a graph cut algorithm. Magn Reson Med. 2010 Jan;63(1):79-90. doi: 10.1002/mrm.22177. PMID: 19859956; PMCID: PMC3414226.
7. Hu HH, Börnert P, Hernando D, Kellman P, Ma J, Reeder S, Sirlin C. ISMRM workshop on fat-water separation: insights, applications and progress in MRI. Magn Reson Med. 2012 Aug;68(2):378-88. doi: 10.1002/mrm.24369. Epub 2012 Jun 12. PMID: 22693111; PMCID: PMC3575097.
Figures