1909
Improved receive coil signal combination for large volume single voxel spectroscopy at ultra-high field1CAMIPM, Dept. of Radiology, University of Pennsylvania, Philadelphia, PA, United States
Synopsis
Keywords: Image Reconstruction, Spectroscopy, ultrahigh field
Motivation: Spectroscopic detection of low concentration metabolites (< 1mM) requires either lengthy signal averaging or large volume voxels. The latter can lead to significant variations in B0 across the volume, especially at ultrahigh field.
Goal(s): Correct for B0 heterogeneity in large volume SVS when detecting with multi-channel receive coils.
Approach: Using a metric for receive signal similarity, apply frequency and phase alignment of individual channel signals, prior to coil combination.
Results: The method was applied to 18 in vivo scans of 1H brain spectra at 7 T. Narrower linewidths and increased SNR were observed for water and down-field NAD+ resonances.
Impact: This approach provides an automated and robust method to improve spectral resolution and signal-to-noise ratio with large volume single voxel spectroscopy of low concentration metabolites when using multichannel receive arrays.
Introduction
1H resonances from NAD+ and tryptophan have been recently detected in human brain in the 1H downfield MRS spectrum using spectrally selective excitation single voxel spectroscopy1. To accurately measure these low concentration metabolites (< 1 mM), either lengthy signal averaging or a large voxel is needed. With large voxels, significant spatial variation of the main magnetic (B0) field can occur, particularly at ultrahigh field. The effect is compounded with detection by multi-channel receive coils, resulting in signals from different coil channels which are frequency and phase shifted with respect to one another. Subsequent coil combination of the raw signals can result in sub-optimal summation of the resulting FID.In this work, we present a method for correcting channel-wise receive signal frequency and phase shifts before coil channel combination. We demonstrate the application of this approach in large voxel 1H down-field spectroscopy (DFS) in the human brain at 7 T, with resulting improvements in spectral linewidths and peak SNR.
Methods
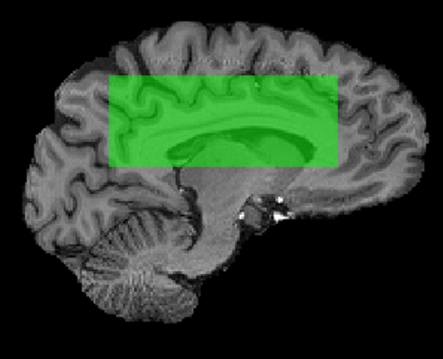
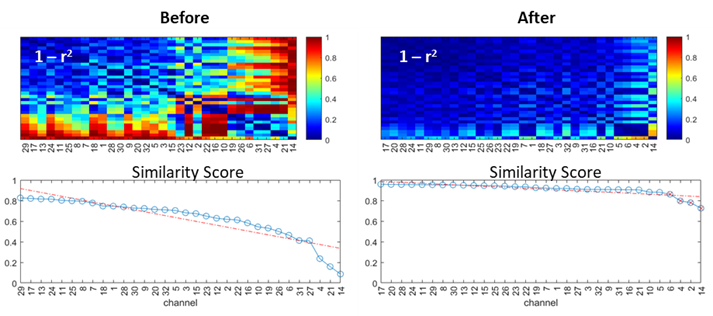
Brain scans of 18 healthy subjects were acquired on a 7 T whole-body scanner (MAGNETOM Terra, Siemens Healthcare, Erlangen, Germany) using a single-channel transmit and 32-channel receive head coil (Nova Medical). A custom down-field SVS pulse sequence2 was used to selectively excite either water or a downfield spectral region containing NAD+ and tryptophan. A large SVS voxel (50 x 100 x 55mm) was centrally located in the superior portion of the brain (Figure 1). Two scans were performed 1) water reference: RF center/width=4.7/2ppm, TR/TE=10000/18ms, 16 averages; and 2) metabolite: RF center/width=9.1/2ppm TR/TE=1000/18ms; 256 averages.From the water reference scan, using an approach similar to Mikkelsen et al3, the complex correlation coefficient (r2) was computed between each raw coil channel signal and all other coil channels, producing a similarity index ranging from 0 to 1. The similarity scores, defined as the median of each channel’s similarity index values, were then ranked from most similar to least similar to all other channels. The highest ranked channel was selected as the reference signal to which the remaining channel signals are aligned. Frequency and phase correction of the N-1 (i.e. 31) complex time-domain signals was accomplished using non-linear minimization of the following expression
$${\parallel}a_{k}e^{i{\omega_{k}}t}e^{i\phi_{k}}fid_{k} - fid_{ref}\parallel{\:}\textrm{for}{\:}{k} = 1{\cdot\cdot}N-1$$
Where fidk and fidref are the source and reference coil channel signals, respectively, and ak, ϕk, ωk are fitted parameters for amplitude, zero-order phase, and frequency. The frequency, $$$e^{i{\omega_{k}}t} $$$, and phase, $$$e^{i\phi_{k}}$$$, terms were applied to align the signals before channel combination. The same channel-specific frequency and phase correction terms were also applied to the metabolite scan data (i.e. water-free signals). An additional pruning step was implemented to remove coil channel signals with very low residual similarity scores (Figure 2).
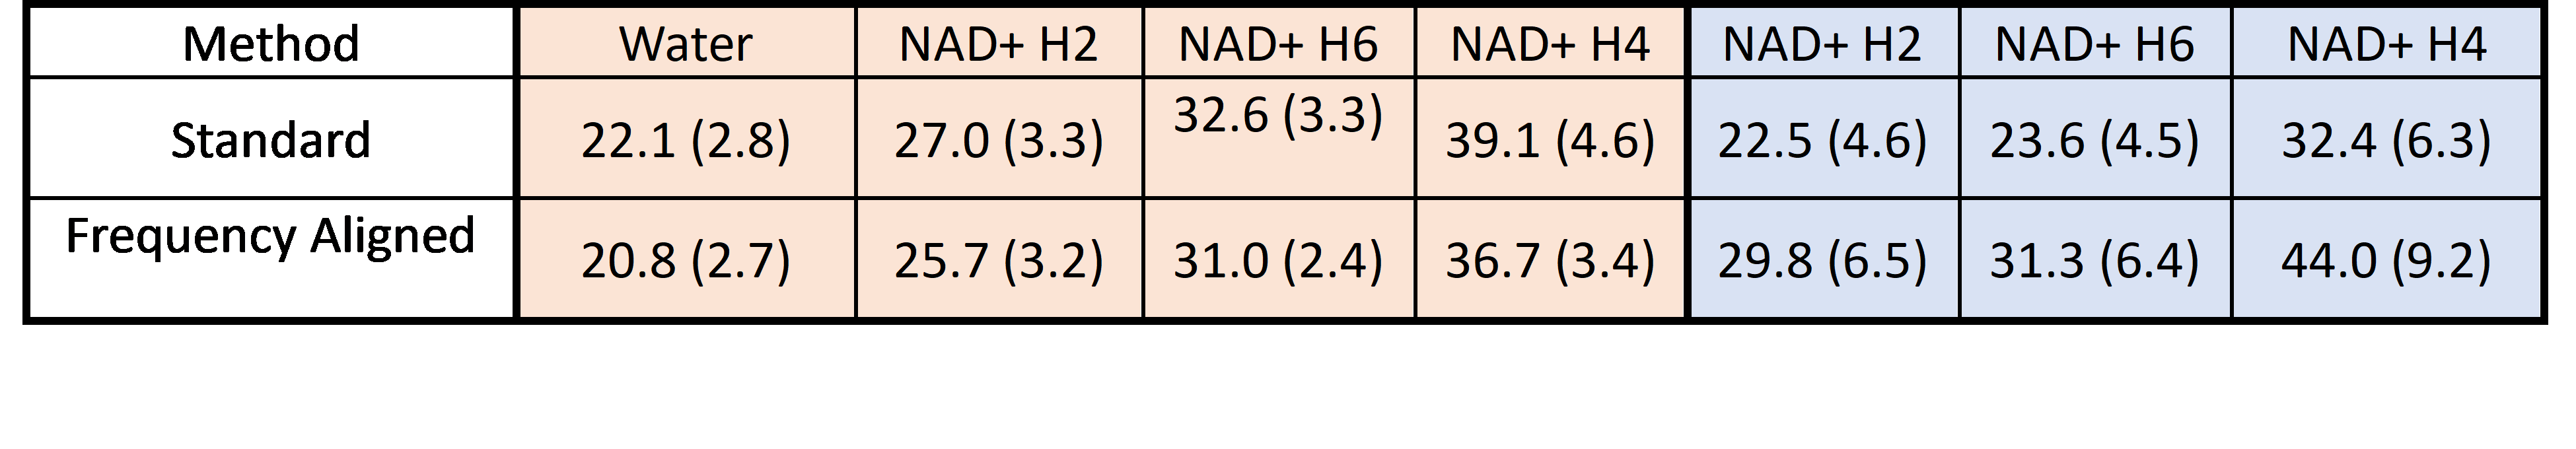
Spectroscopy data were quantified with custom software designed for fitting DFS spectra, using a time-domain HSVD method2. Fitted spectral linewidths were measured for water and the NAD+ resonances at 9.35, 9.17, and 8.84 ppm. In addition, NAD+ SNR estimates were derived from the fitted peak maxima divided by the standard deviation of the noise taken from a signal-free region of the spectrum.
Results
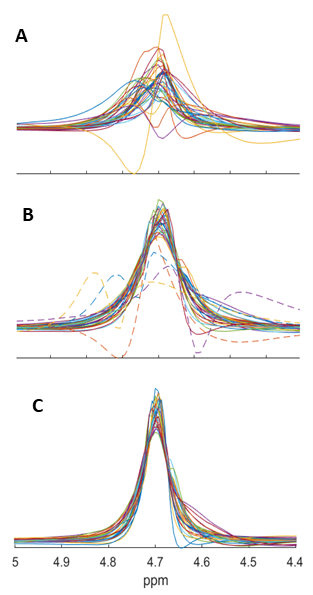
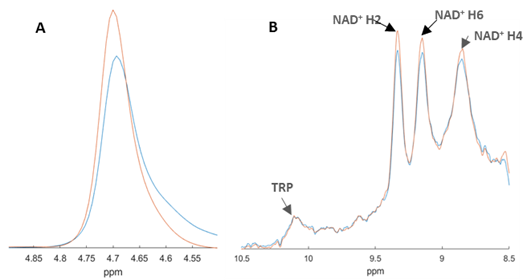
Coil channel spectra from a typical water reference scan are depicted in Figure 3, showing the raw signals and those after frequency alignment and pruning. The effects on the reconstructed water and related metabolite spectra are seen in Figure 4. The water linewidth is narrowed and the spectral resolution of the NAD+ resonances is improved. Across all scans, the estimated frequency shifts ranged from -20.1 to 23.4 Hz, with an average absolute value of 2.8 Hz. Table 1 summarizes the average improvements in water and NAD+ linewidths, and the estimated NAD+ SNR. Tryptophan linewidths were not observed to change with this method, likely due to its broad natural linewidth.Discussion
The method presented here accounts for Larmor frequency variation arising from heterogeneous B0 fields in large volume SVS experiments. The method is analogous to the correction needed for scanner frequency drift during long signal averaging epochs3. However, this application has the advantage that the frequency shifts are identified from high SNR water reference scans and are then applied to lower SNR metabolite signals. The result is narrower line shapes with increased spectral SNR. While this work is demonstrated for downfield spectroscopy, the method is equally applicable to more conventional up-field spectroscopy where water suppression is used. Future work will focus on the related effects of transmit and receive B1 field heterogeneity expected with large spectroscopy voxels.Acknowledgements
Research reported in this publication was supported by the following:
National Institute of Biomedical Imaging and Bioengineering of the National Institutes of Health
· Award numbers P41EB029460 and T32EB020087
National Heart, Lung, and Blood Institute of the National Institutes of Health
· Award numbers R01HL137984, R01HL169378, and F31HL158217
References
1. Nanga RP, Elliott MA, et al. Identification of l-Tryptophan by down-field 1 H MRS: A precursor for brain NAD+ and serotonin syntheses. Magn Reson Med. 2022; 88(6):2371-2377.
2. Swago S, Elliott MA, et al. Quantification of cross-relaxation in downfield 1 H MRS at 7 T in human calf muscle. Magn Reson Med. 2023;90(1):11-20
3. Mikkelsen M, Tapper S, et al. Correcting frequency and phase offsets in MRS data using robust spectral registration. NMR Biomed. 2020; 33(10): e4368.
Figures