1895
Optimal Visualization and Morphologic Findings of Thoracic Dorsal Root Ganglia Using MR Neurography1The First Affiliated Hospital of Fujian Medical University, Fuzhou, China, 2Philips Healthcare, Shanghai, China, Shanghai, China
Synopsis
Keywords: Peripheral Nerves, Neurography
Motivation: A more consistent visualization of the thoracic ganglia is needed to aid in identifying abnormal anatomical patterns and disease progression for the formulation of therapeutic strategies.
Goal(s): To prospectively evaluate the clinical feasibility of MR neurography in detecting thoracic dorsal root ganglia and related morphologic information for clinical decisions.
Approach: The T2_FFE, B_FFE, and SHINKEI sequences were applied to identify the best sequence that can precisely provide nerve root visualization and describe the morphological information of thoracic DRG.
Results: T2_FFE offers enhanced nerve visualization and improved image quality, and provides valuable morphological information, with shorter sequence acquisition time.
Impact: This method has a potential role in the diagnosis and treatment of diseases involving unilateral or even bilateral ganglia. By applying morphological MRN, the detailed nerve visualization may help surgeons develop effective DRG-targeted treatment and detect the therapeutic effect.
Introduction
The dorsal root ganglion (DRG), a collection of primary sensory nerve-cell bodies, plays a critical role in transmitting sensory signals from the peripheral nervous system to the central nervous system.1-3 Due to the permeability of the blood DRG barrier, it is vulnerable to herpes zoster virus infection,4-6 with the chest and back regions being particularly affected.7, 8 Dehydration, Wallerian degeneration, and chronic inflammatory cell infiltration occur in the DRG after viral infection, inducing changes in DRG volume.9, 10 The volume and anatomical location of DRG play a role in the diagnosis and treatment of herpes zoster patients in some aspects. However, the clinical efficacy of treatment does not achieve the intended outcomes owing to inadequate evaluation of preoperative imaging in thoracic DRG. Hence, a more consistent visualization of the DRG should be applied for identifying abnormal anatomical patterns and disease progression to the formulation of therapeutic strategies.The DRG can be visualized by CT myelography, CT discography, and MR neurography (MRN).11 MRN is an ideal diagnostic tool for the evaluation of the nerve injury and end-organ damage.12 The most commonly used MRN sequences are T2_FFE with principles of selective excitation technique (PROSET), nerve-sheath signal increased with inked rest-tissue rapid acquisition of relaxation enhancement imaging (SHINKEI), and 3D_FIESTA sequence.13-15 Nevertheless, systematic MRN studies for imaging or describing the normal anatomy of thoracic DRG remain scarce.
Methods
Fifty-three participants were enrolled for MR neurography scan. B_FFE, T2_FFE, and SHINKEI sequences were compared for morphometric analysis of thoracic ganglia. The visualization effect for the thoracic nerve root (ganglia, preganglionic, and postganglionic nerves) and overall image quality were scored on a 5-point Likert scale. The anatomical location and volume of ganglia were determined. Inter-observer and intra-observer agreement were assessed by intraclass correlation coefficient (ICC) analysis. The sequences were compared by one-way repeated measures ANOVA and the Friedman test. The paired samples t-test was used to compare right- and left-sided ganglia volumes for each segment. The Pearson’s correlation coefficient r was used to evaluate the correlations of ganglia volume with demographic variables.Results
Mean visualization scores for ganglia, preganglionic, and postganglionic nerve tissue were higher for the T2_FFE sequence (4.25, 3.42 and 4.36, respectively) compared with the B_FFE (3.01, 2.57 and 3.00, respectively) and SHINKEI (3.33, 2.71 and 3.87, respectively) sequences (all P < 0.01). There was no statistically significant difference in ganglia volume between the left and right sides (all P > 0.05), and the overall trend from T1 to T12 was large at both ends and small in the middle. Ganglia volume (mean of T1 to T12) was correlated with body height (r = 0.39, P = 0.03). However, sex, age, and weight showed no significant correlations with ganglia volume (P = 0.19, P = 0.14 and P = 0.60, respectively). As for the location of ganglia, the extra-foraminal type had the highest proportion (89.86%).Discussion
In the current study, three sequences (T2_FFE, B_FFE and SHINKEI) were compared to determine the best sequence for thoracic DRG imaging. Unlike B_FFE that employs FID with SE and STE echoes 16, T2_FFE only collected SE echo. This indicates that T2_FFE is T2 weighted rather than T2* weighted. The feature of T2_FFE using the SE component renders it insensitive to local magnetic field inhomogeneity.17 In addition, the fat suppression technology (PROSET) used by T2_FFE not only does not increase the scanning time but also enables better details visualization for DRG. While SHINKEI often leads to incomplete suppression of slow flow when applied in thoracic DRG imaging, while the use of low flow velocity-encoding values in iMSDE results in motion artifacts and image degradation. Therefore, T2_FFE is considered the most suitable sequence for evaluating anatomical information according to nerve visualization score and overall image quality score.As expected, these results corroborated previous anatomical findings showing the usual DRG location.13, 18, 19 Although we found no cases with intra-spinal type. Considering the variability of such anatomical findings, this is potentially due to the small cohort of the study. Interestingly, there was a significant correlation of DRG volume with height in this study, which corroborated previous studies.20 Unlike height, however, no correlation was detected for weight and sex.
Conclusion
This study marks the inaugural application of the T2_FFE sequence in thoracic DRG imaging. Compared with commonly used MRN sequences such as B_FFE and SHINKEI, T2_FFE offers enhanced nerve visualization and improved image quality, and provides valuable morphological information, with shorter sequence acquisition time. As such, this innovative imaging procedure may be considered for inclusion in preoperative evaluation of patients.Acknowledgements
The authors of this manuscript declare no relationships with any companies, whose products or services may be related to the subject matter of the article. The authors state that this work was supported the Fujian Provincial Health Technology Project (No. 2021GGA025), and the National Natural Science Foundation of China (No. 82071869). No complex statistical methods were necessary for this paper. Institutional Review Board approval was obtained. Written informed consent form was obtained from subjects in this study. This article has not been published elsewhere in whole or in part. Methodology: prospective, performed at one institution.
References
1. Finnerup NB, Kuner R, Jensen TS. Neuropathic Pain: From Mechanisms to Treatment. Physiological reviews 2021;101:259-301. doi: https://doi.org/10.1152/physrev.00045.2019
2. Malik K, Benzon HT. Radiofrequency applications to dorsal root ganglia: a literature review. Anesthesiology 2008;109:527-542. doi: https://doi.org/10.1097/ALN.0b013e318182c86e
3. Nascimento AI, Mar FM, Sousa MM. The intriguing nature of dorsal root ganglion neurons: Linking structure with polarity and function. Progress in neurobiology 2018;168:86-103. doi: https://doi.org/10.1016/j.pneurobio.2018.05.002
4. Acharjee S, Zhu Y, Maingat F, et al. Proteinase-activated receptor-1 mediates dorsal root ganglion neuronal degeneration in HIV/AIDS. Brain : a journal of neurology 2011;134:3209-3221. doi: https://doi.org/10.1093/brain/awr242
5. Abram SE, Yi J, Fuchs A, et al. Permeability of injured and intact peripheral nerves and dorsal root ganglia. Anesthesiology 2006;105:146-153. doi: https://doi.org/10.1097/00000542-200607000-00024
6. Jimenez-Andrade JM, Herrera MB, Ghilardi JR, et al. Vascularization of the dorsal root ganglia and peripheral nerve of the mouse: implications for chemical-induced peripheral sensory neuropathies. Molecular pain 2008;4:10. doi: https://doi.org/10.1186/1744-8069-4-10
7. Mareque M, Oyagüez I, Morano R, et al. Systematic review of the evidence on the epidemiology of herpes zoster: incidence in the general population and specific subpopulations in Spain. Public health 2019;167:136-146. doi: https://doi.org/10.1016/j.puhe.2018.10.015
8. Kawai K, Yawn BP. Risk Factors for Herpes Zoster: A Systematic Review and Meta-analysis. Mayo Clinic proceedings 2017;92:1806-1821. doi: https://doi.org/10.1016/j.mayocp.2017.10.009
9. Arvin AM. Varicella-zoster virus. Clinical microbiology reviews 1996;9:361-381. doi: https://doi.org/10.1128/cmr.9.3.361
10. Zerboni L, Sen N, Oliver SL, et al. Molecular mechanisms of varicella zoster virus pathogenesis. Nature reviews Microbiology 2014;12:197-210. doi: https://doi.org/10.1038/nrmicro3215
11. Ohmori K, Kanamori M, Kawaguchi Y, et al. Clinical features of extraforaminal lumbar disc herniation based on the radiographic location of the dorsal root ganglion. Spine 2001;26:662-666. doi: https://doi.org/10.1097/00007632-200103150-00022
12. Chhabra A, Madhuranthakam AJ, Andreisek G. Magnetic resonance neurography: current perspectives and literature review. European radiology 2018;28:698-707. doi: https://doi.org/10.1007/s00330-017-4976-8
13. Shen J, Wang HY, Chen JY, et al. Morphologic analysis of normal human lumbar dorsal root ganglion by 3D MR imaging. AJNR Am J Neuroradiol 2006;27:2098-2103. doi:
14. Kasper JM, Wadhwa V, Scott KM, et al. SHINKEI--a novel 3D isotropic MR neurography technique: technical advantages over 3DIRTSE-based imaging. European radiology 2015;25:1672-1677. doi: https://doi.org/10.1007/s00330-014-3552-8
15. Li B, Huang Y, Zhang Y, et al. Utilizing pre-operative MR imaging and adapting optimal needle puncture approach to improve radiofrequency ablation fraction of thoracic dorsal root ganglia. Sci Rep 2021;11:18589. doi: https://doi.org/10.1038/s41598-021-98050-4
16. Aydın H, Altın E, Dilli A, et al. Evaluation of jugular foramen nerves by using b-FFE, T2-weighted DRIVE, T2-weighted FSE and post-contrast T1-weighted MRI sequences. Diagnostic and interventional radiology (Ankara, Turkey) 2011;17:3-9. doi: https://doi.org/10.4261/1305-3825.Dir.2744-09.3
17. Yang A, Xiao XH, Wang ZL, et al. Carotid wall imaging with 3D_T2_FFE: sequence parameter optimization and comparison with 3D_T2_SPACE. Sci Rep 2021;11:2255. doi: https://doi.org/10.1038/s41598-021-81309-1
18. Kikuchi S, Sato K, Konno S, et al. Anatomic and radiographic study of dorsal root ganglia. Spine 1994;19:6-11. doi: https://doi.org/10.1097/00007632-199401000-00002
19. Wang H, Li K, Wang Q, et al. Magnetic Resonance Neurography for Evaluation of Dorsal Root Ganglion Morphology. World Neurosurg 2021;154:e54-e60. doi: https://doi.org/10.1016/j.wneu.2021.06.123
20. Kronlage M, Fischer TD, Behnisch R, et al. Dorsal Root Ganglia Volume-Normative Values, Correlation with Demographic Determinants and Reliability of Three Different Methods of Volumetry. Diagnostics (Basel) 2022;12doi: https://doi.org/10.3390/diagnostics12071570
Figures
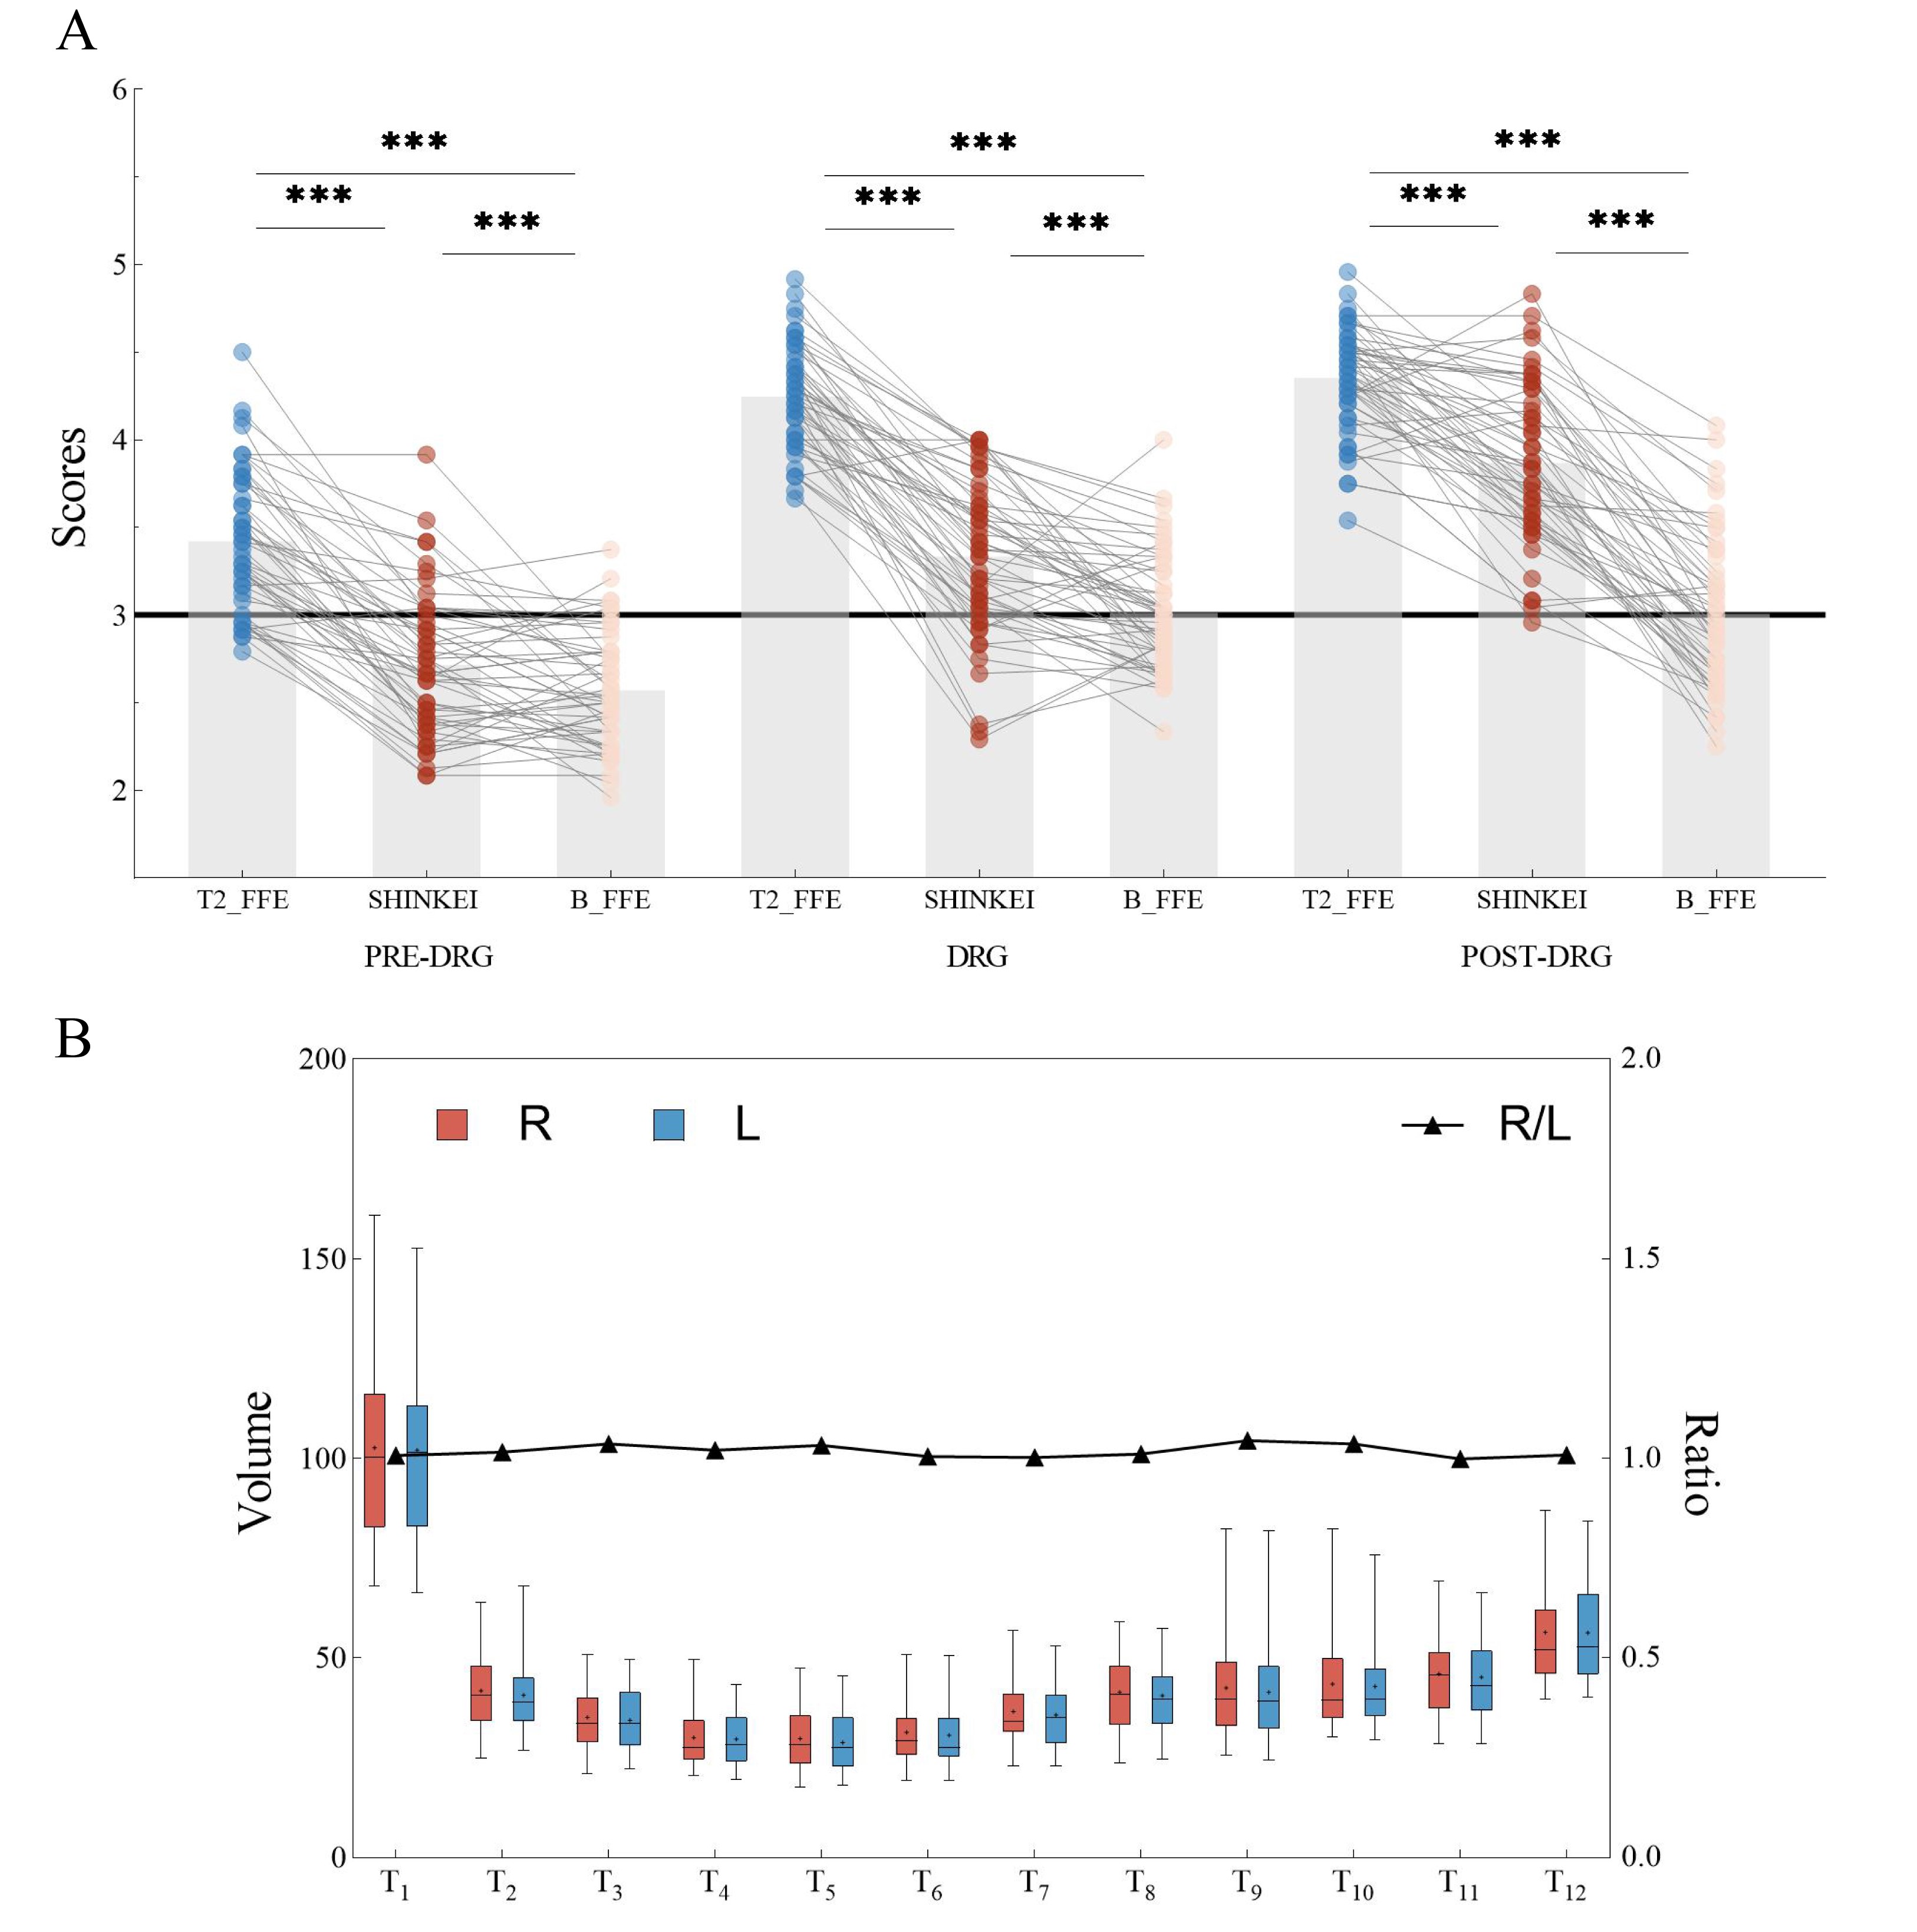
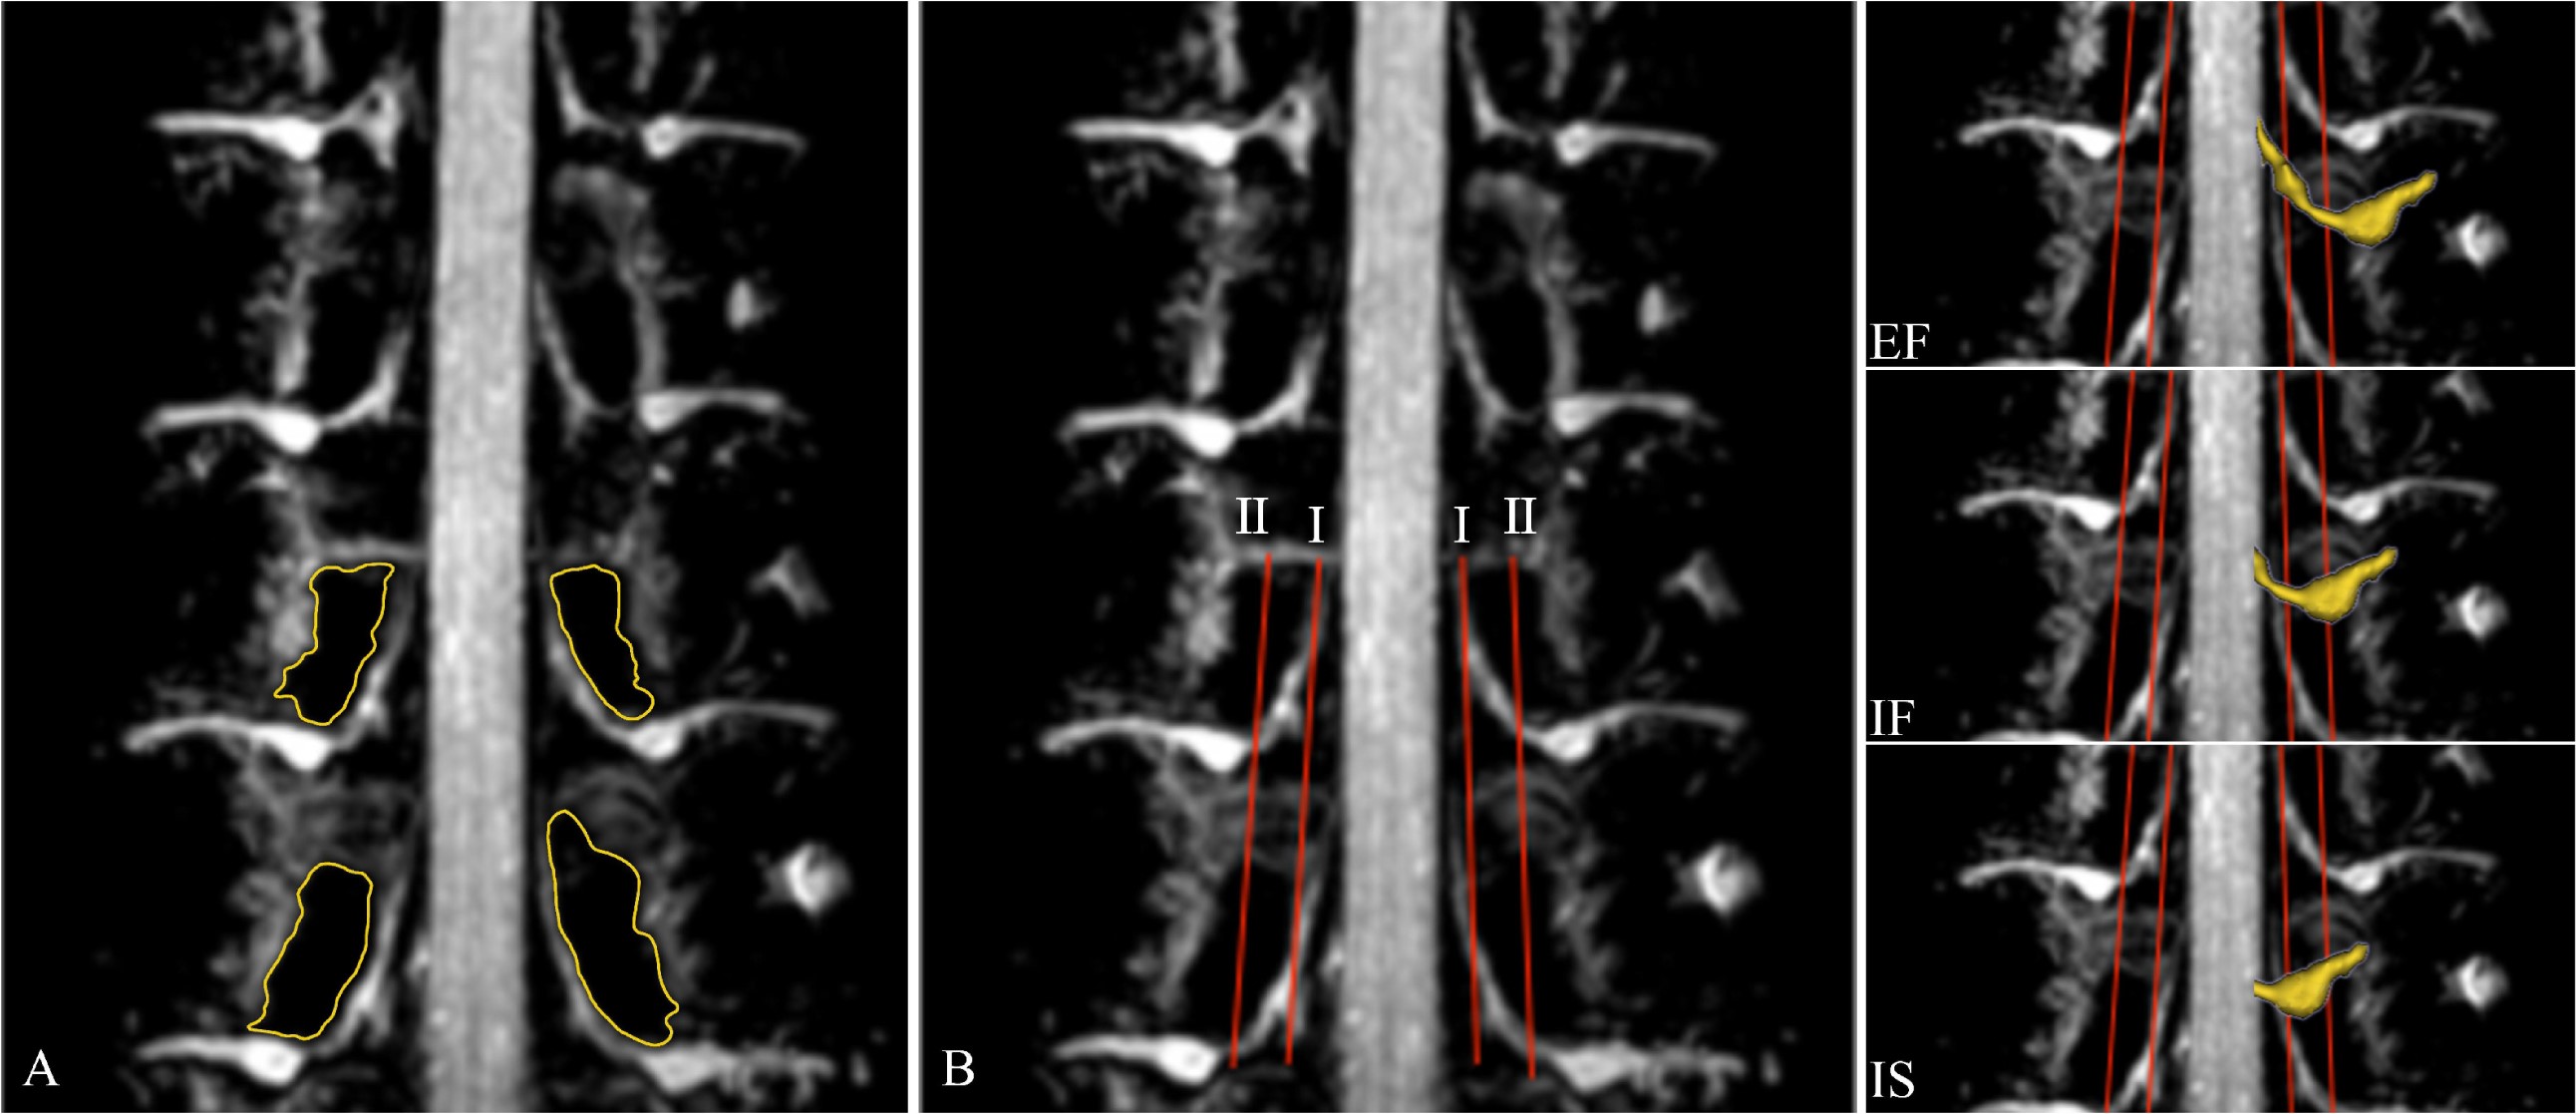
Figure 2 The margin of the pedicle (yellow) can be seen on the T2_FFE sequence (A). Two auxiliary lines were drawn to evaluate DRG position: line Ⅰ connects the medial border of the upper and lower pedicles of the ganglion, and line Ⅱ connects the centers of the upper and lower pedicles (B). The proximal end of DRG lying proximal to line Ⅰ indicates an intra-spinal location (IS); proximal end of DRG between Ⅰ and Ⅱ, intra-foraminal (IF); proximal end of DRG lying distal to line Ⅱ, extra-foraminal (EF).
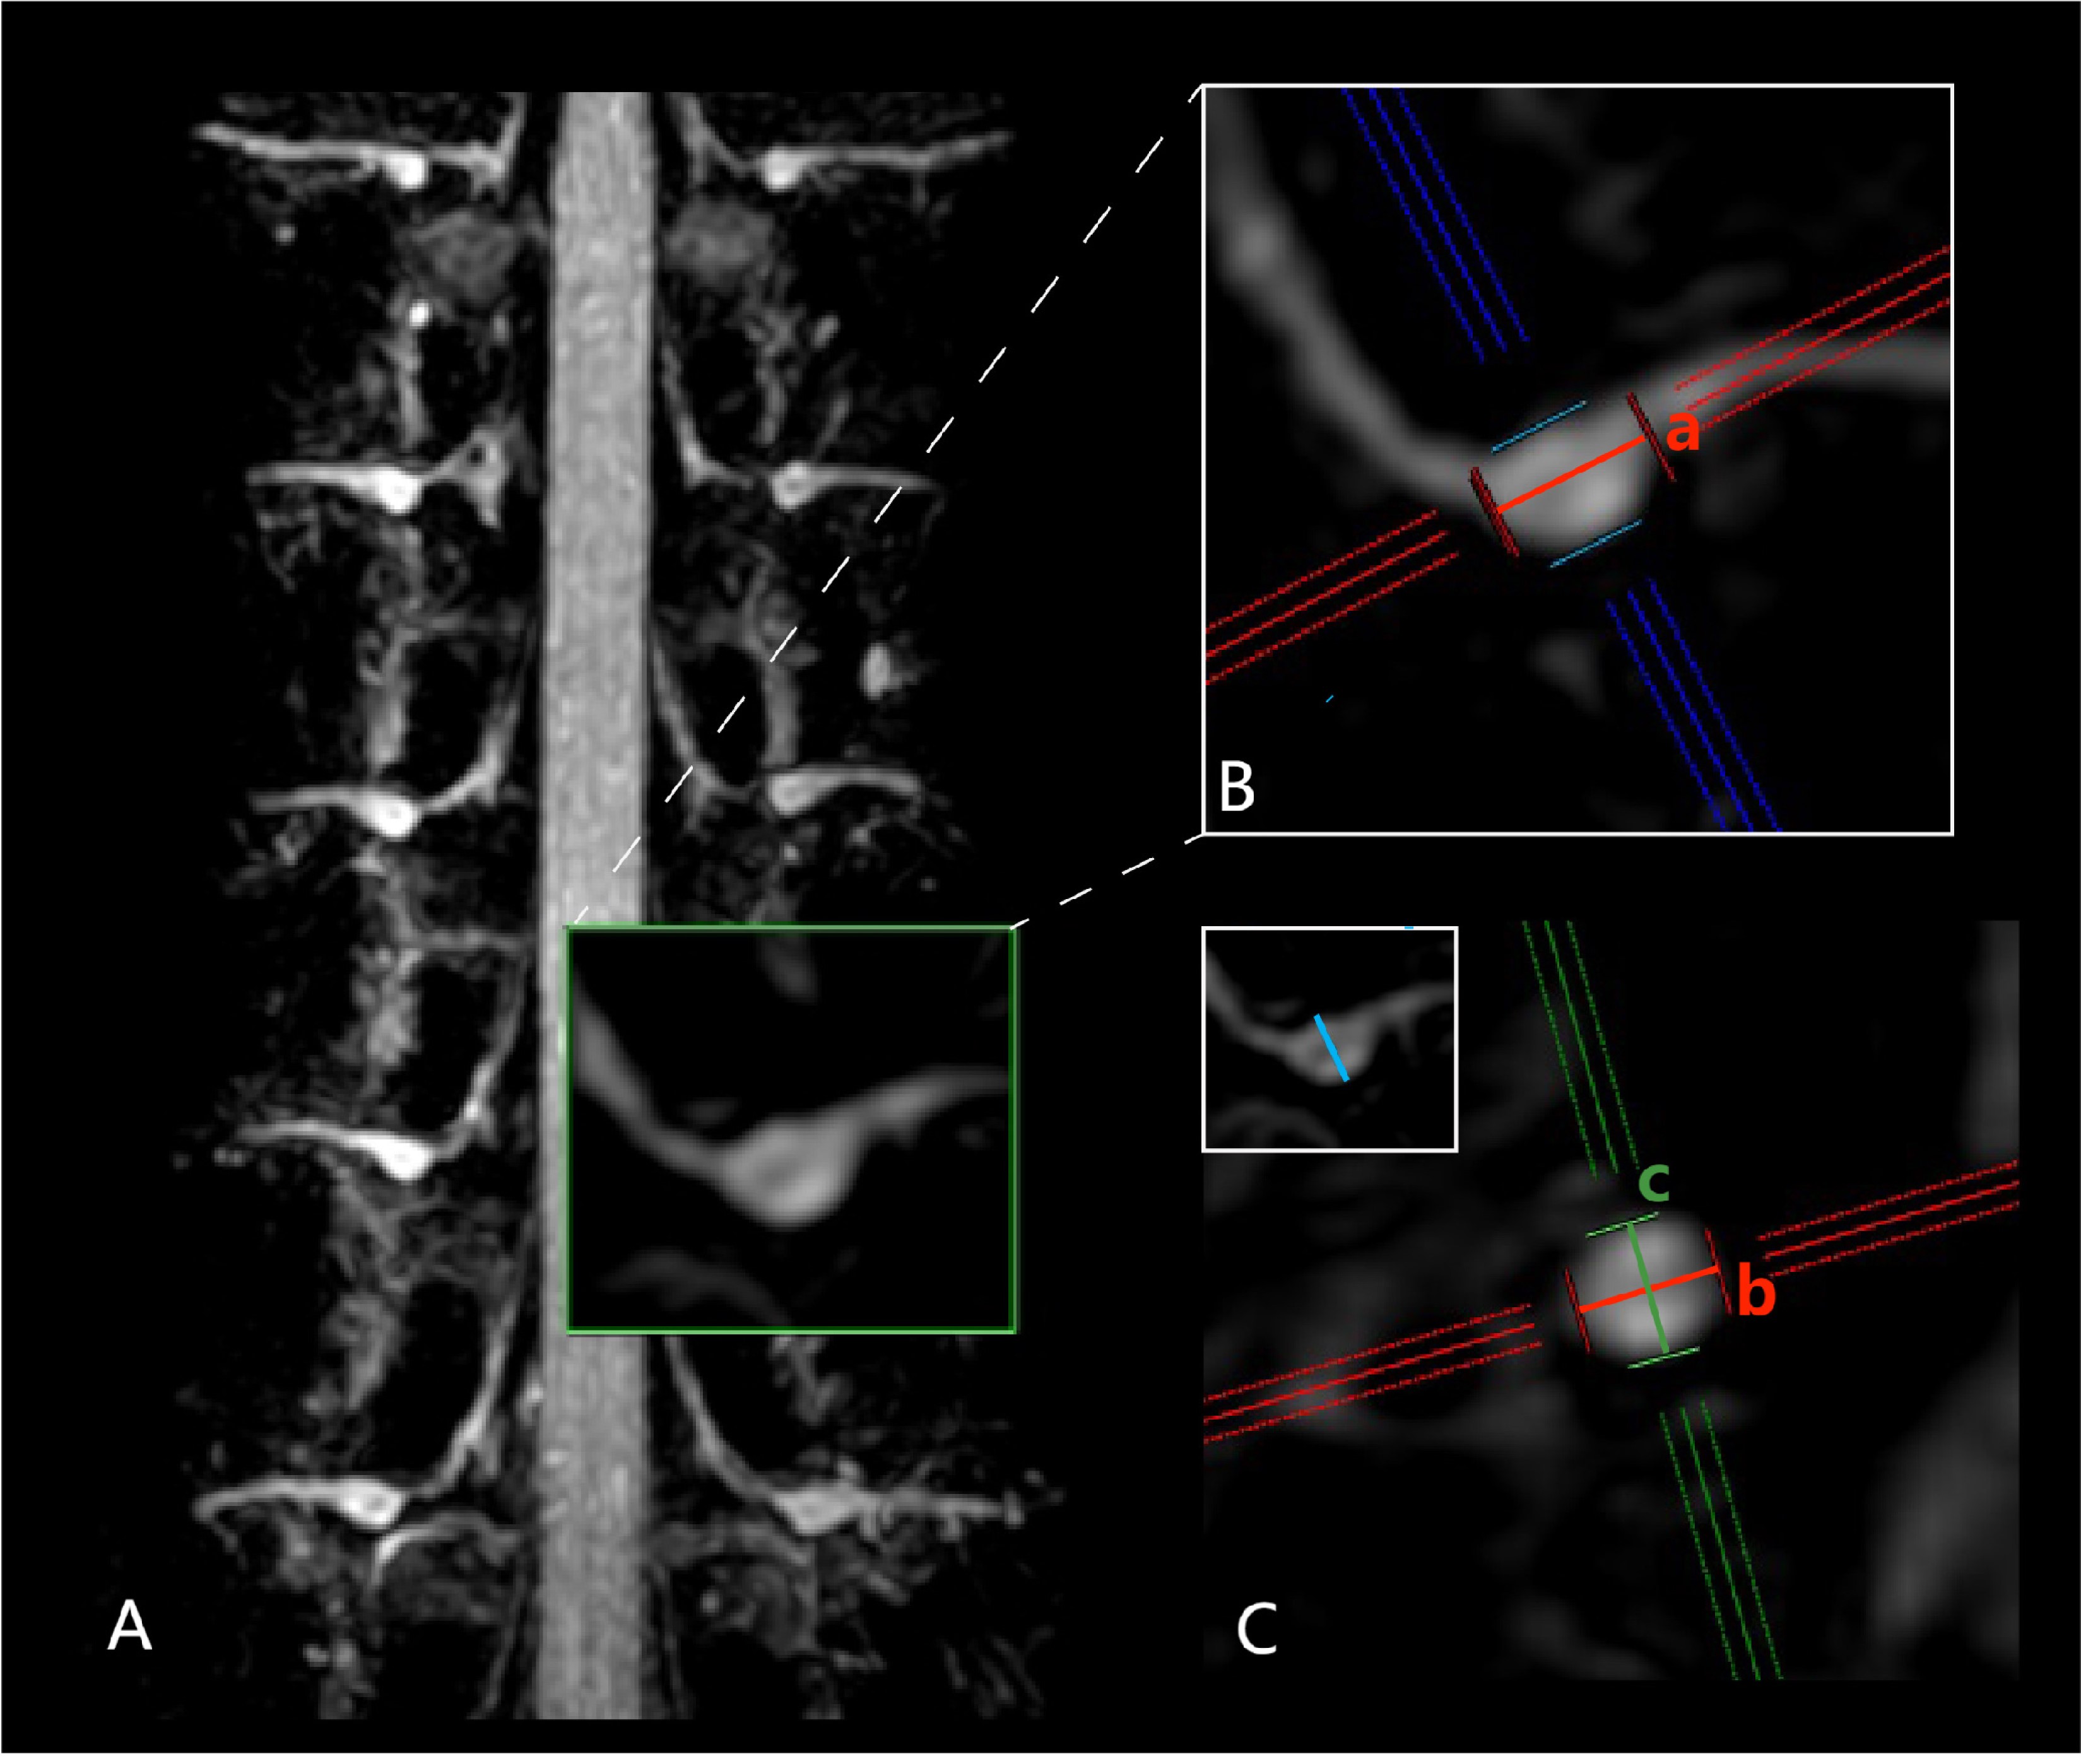
Figure 3 DRG volume and course on representative 3D T2_FFE slices using coronal MIP images. The nerve root ran from the spinal cord to the intervertebral foramen; the enlarged part was the ganglion (A). Coronal oblique (B) and sagittal oblique (C) views depicting the nerve root course and its axis.
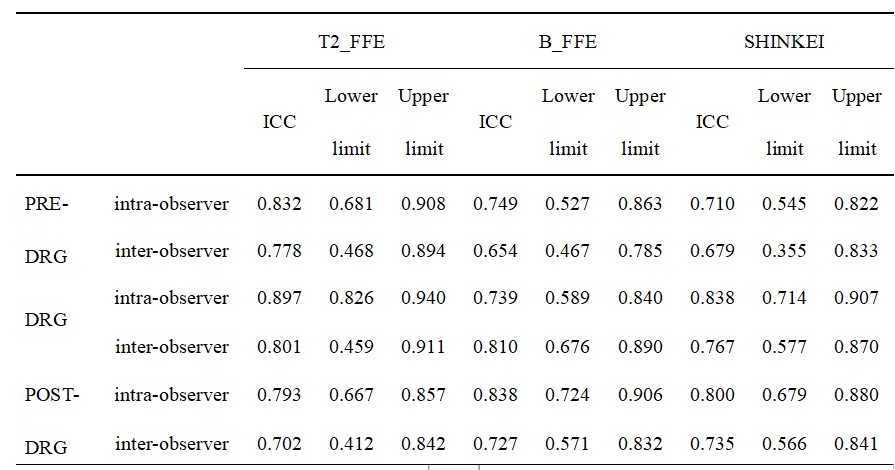
Table 1 Intraclass Correlation Coefficients (ICC) for Nerve Visualization Scores by Two Observers
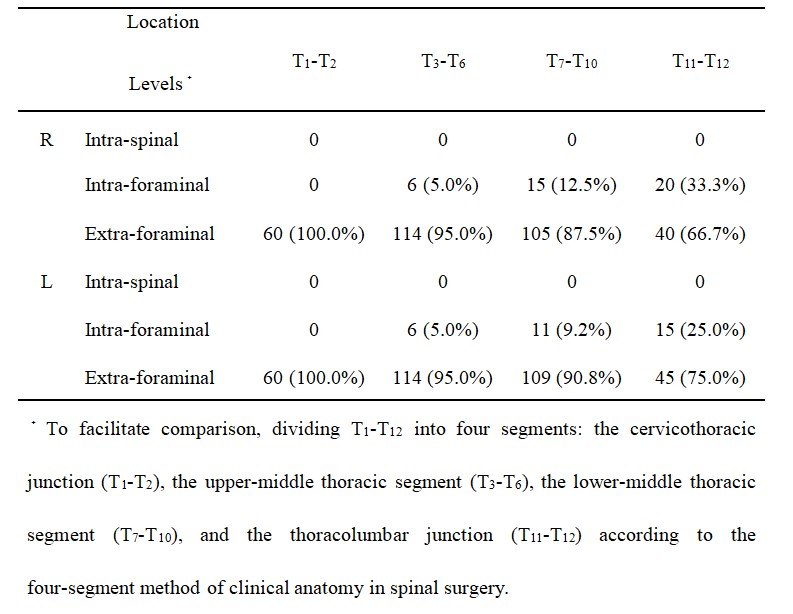
Table 2 Distribution of the Anatomical Location of the DRG at Different Segments (n, %)