1891
Measurement of Dorsal Root Ganglia Volume for Patients with Low Back Pain by MR Neurography1Radiology and Biomedical Imaging, University of California, San Francisco, San Francisco, CA, United States, 2Department of Neurological Surgery, University of Washington School of Medicine, Seattle, WA, United States, 3UC Berkeley-UCSF Graduate Program in Bioengineering, University of California, San Francisco, San Francisco, CA, United States
Synopsis
Keywords: Peripheral Nerves, Nerves, Degenerative
Motivation: Multiple studies have shown volumetric changes in the dorsal root ganglia (DRG) in association with various neuropathies, but volumetric changes in patients with low back pain are not much known.
Goal(s): To check a semi-automatic region-growing technique can be used to segment DRG on 3D MR neurography images and to determine if DRG volumes differ in patients.
Approach: 3D MR neurography images were acquired from 10 patients and 4 control subjects at 3T. Segmentation algorithms were applied for DRG volume measurement, and measured volumes were compared between control and patient groups.
Results: Lower DRG volumes were measured with patients.
Impact: Through a semi-automatic 3D region growing technique, dorsal root ganglia volume can be efficiently measured with 3D MR neurography. Morphological assessment of dorsal root ganglia might help to understand overall lumbar spine pathology and low back pain.
Introduction
MR neurography (MRN) provides direct visualization of peripheral nerves and allows for detecting peripheral nerve pathologies1-2. A dorsal root ganglion (DRG) is located in a dorsal root of a spinal nerve at each spinal level and contains the cell bodies of sensory neurons. A DRG is highly sensitive to mechanical compression and radiculopathy3, and pathological alterations can affect DRG morphology. Volumetric changes due to metabolic peripheral nervous system or diabetes have been reported4-5 but changes for patients with chronic low back pain have not been much reported. Through this work, we used a semi-automatic 3D region-growing technique6 on 3D MRN images to compare DRG volumes beween patients with chronic low back pain and asymptomatic controls.Methods
MR imaging was performed using a GE Signa Premier 3T scanner (GE Healthcare, Waukesha, WI) and 30 channel adaptive image receive (AIR) anterior-array coil and a 60 channel spine posterior-array coil embedded in the table. Ten patients with lower back pain (3 males and 7 females, age: 66.3±10.1 years, height: 168.9±8.9 cm, weight:89.7±20.9 kg) and 4 healthy controls (1 male and 3 females, age: 31.8±8.1 years, height: 168.4±6.6 cm, weight: 81.5±21.0 kg) were imaged after obtaining informed consent. After clinical lumbar spine MRI, 3D MRN imaging was performed using fat-water separated Cube (Cube-Flex) using optimized flip angle trains for nerve visualization and blood suppression in the axial prescription7, with other sequence parameters of 1.2 mm isotropic resolution, 36 x 25.2 cm2 in-plane FOV, and 300 slices, 2500 ms TR, 80 ms TE, ±166.7 kHz readout bandwidth, and 100 echo train length. ARC acceleration with phase/slab accelerations of 2/1.7 were applied, yielding 7 min 30 sec scan time.To measure DRG volume, a seed ROI was drawn on a coronally-reformatted Cube-Flex slice containing the largest visible DRG by a resident and a radiologist, and then 3D region growing was applied using a morphological snake technique and active contour without edges algorithm6 (MorphACWE. Scikit-image, Python). DRG volumes were calculated as the segmented volume. Wilcoxon rank sum test was used to check the difference between patients and healthy controls (P < 0.05).
Results
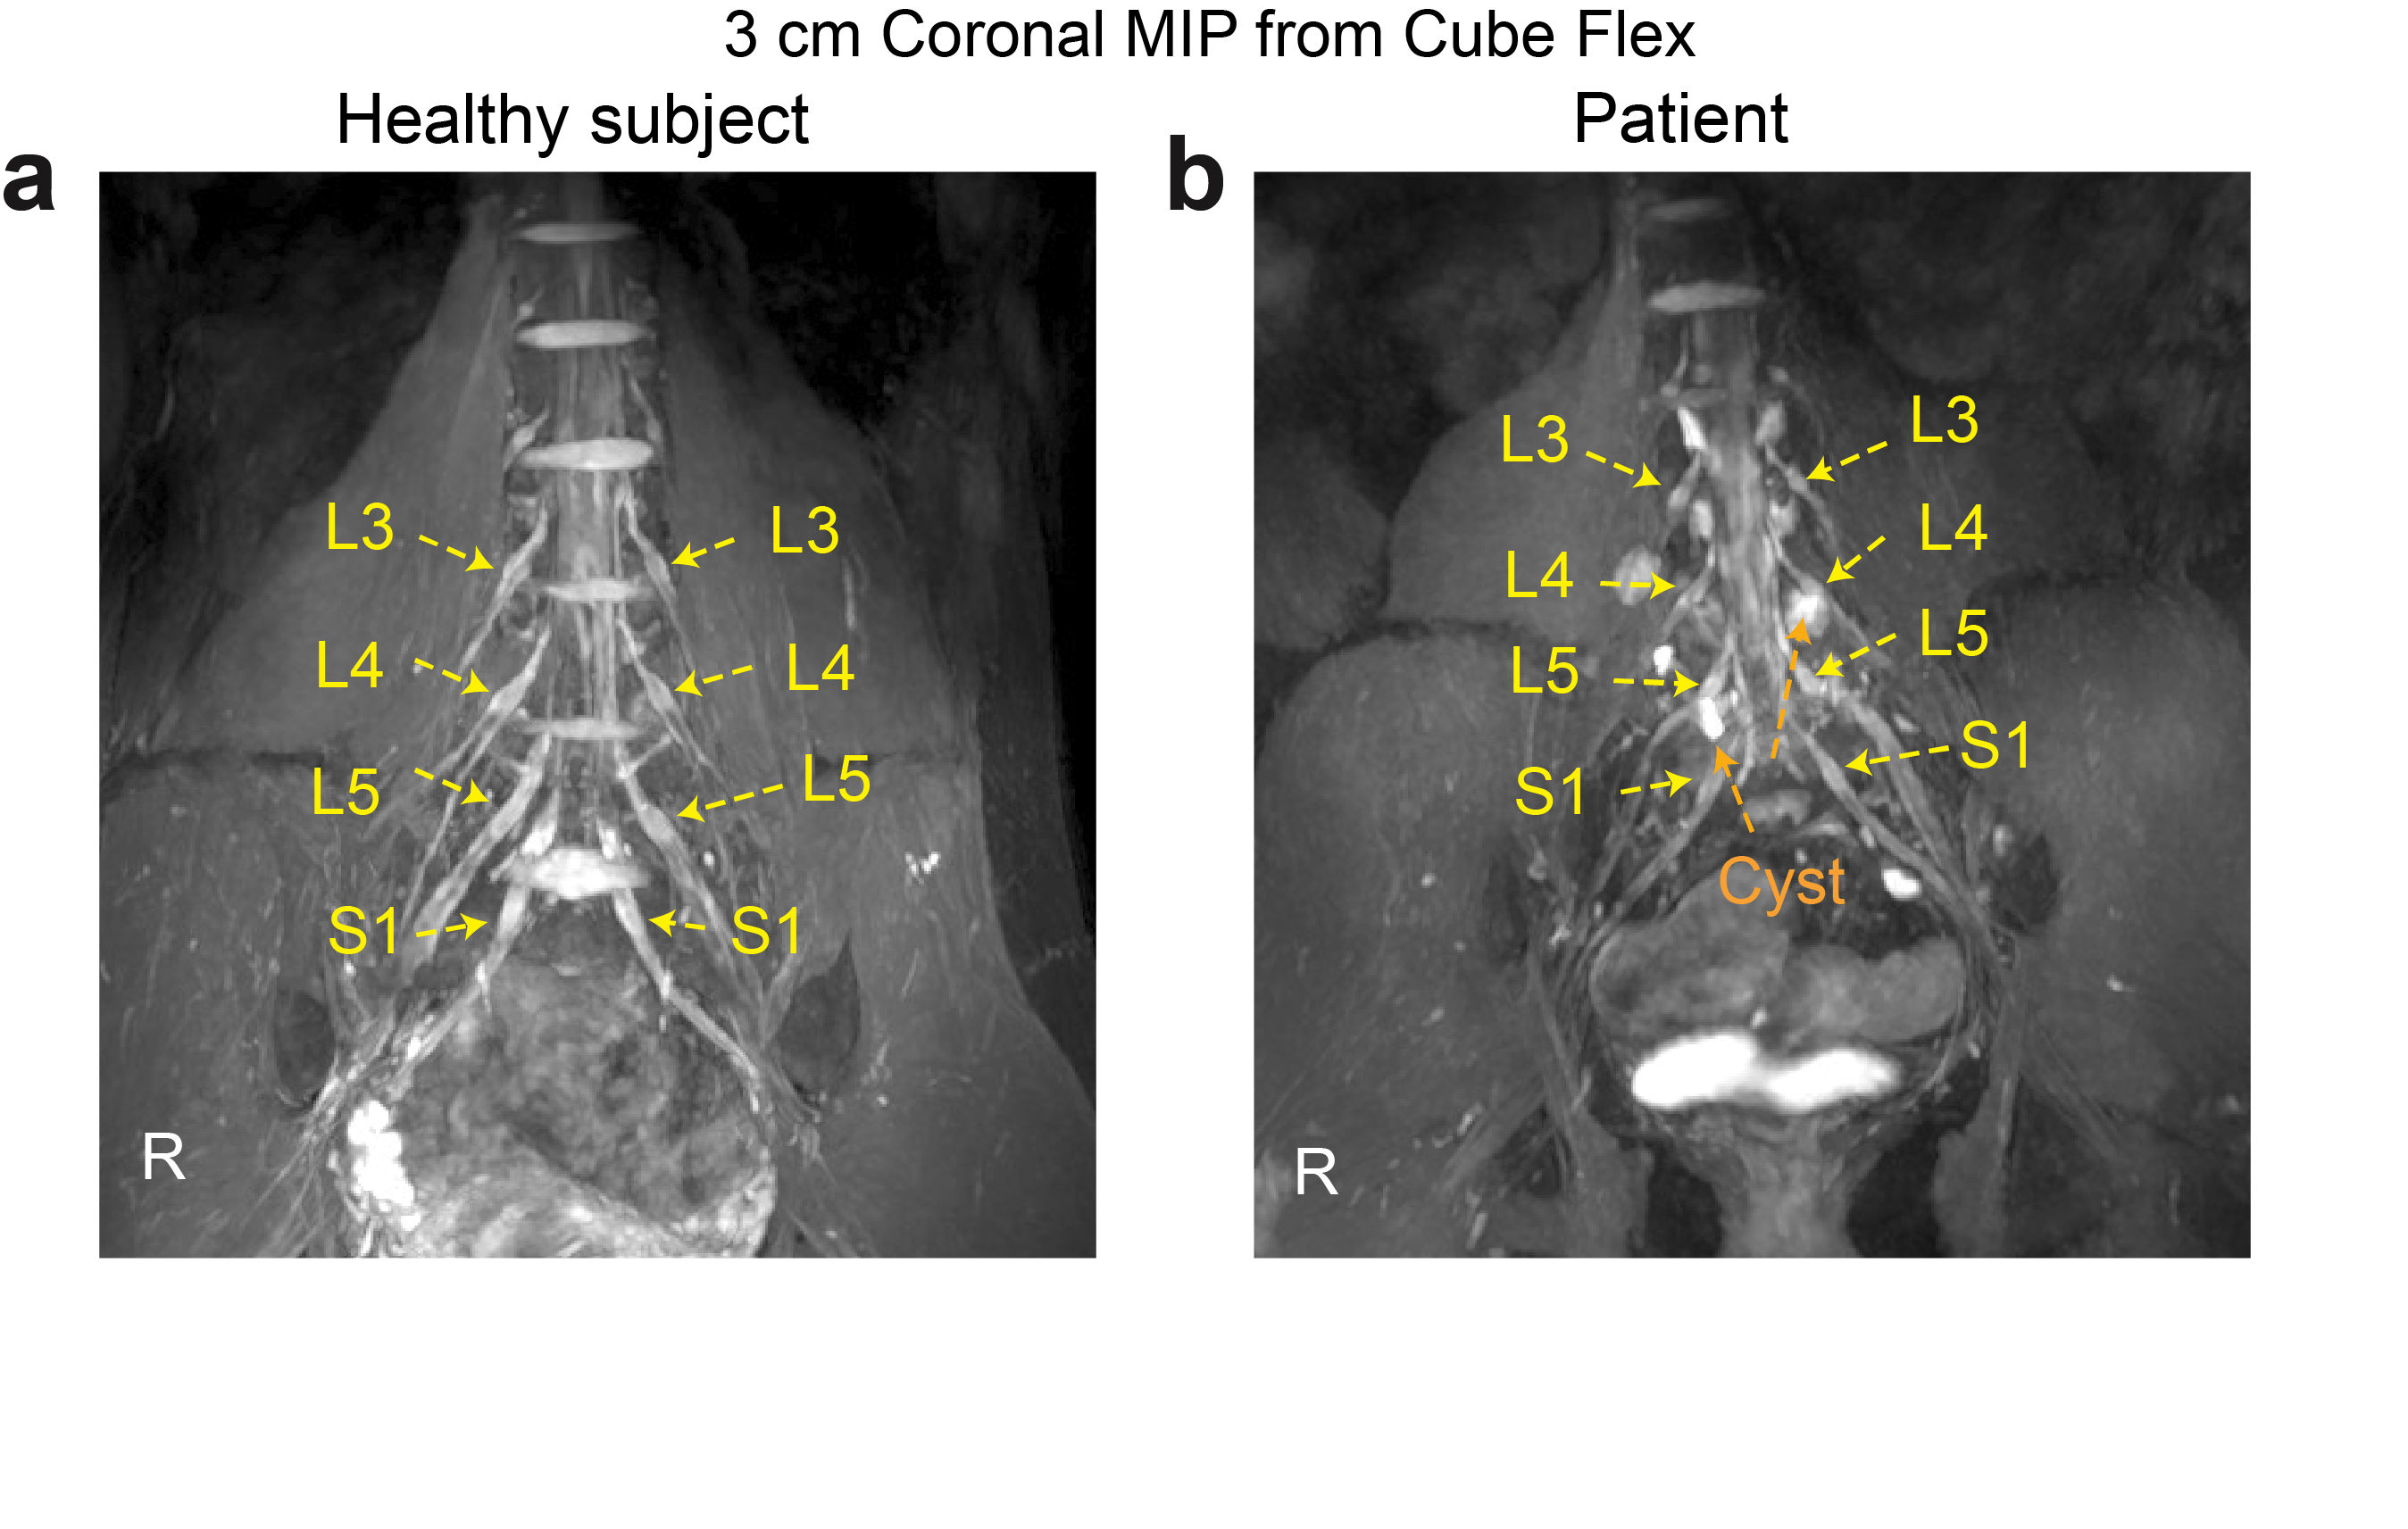
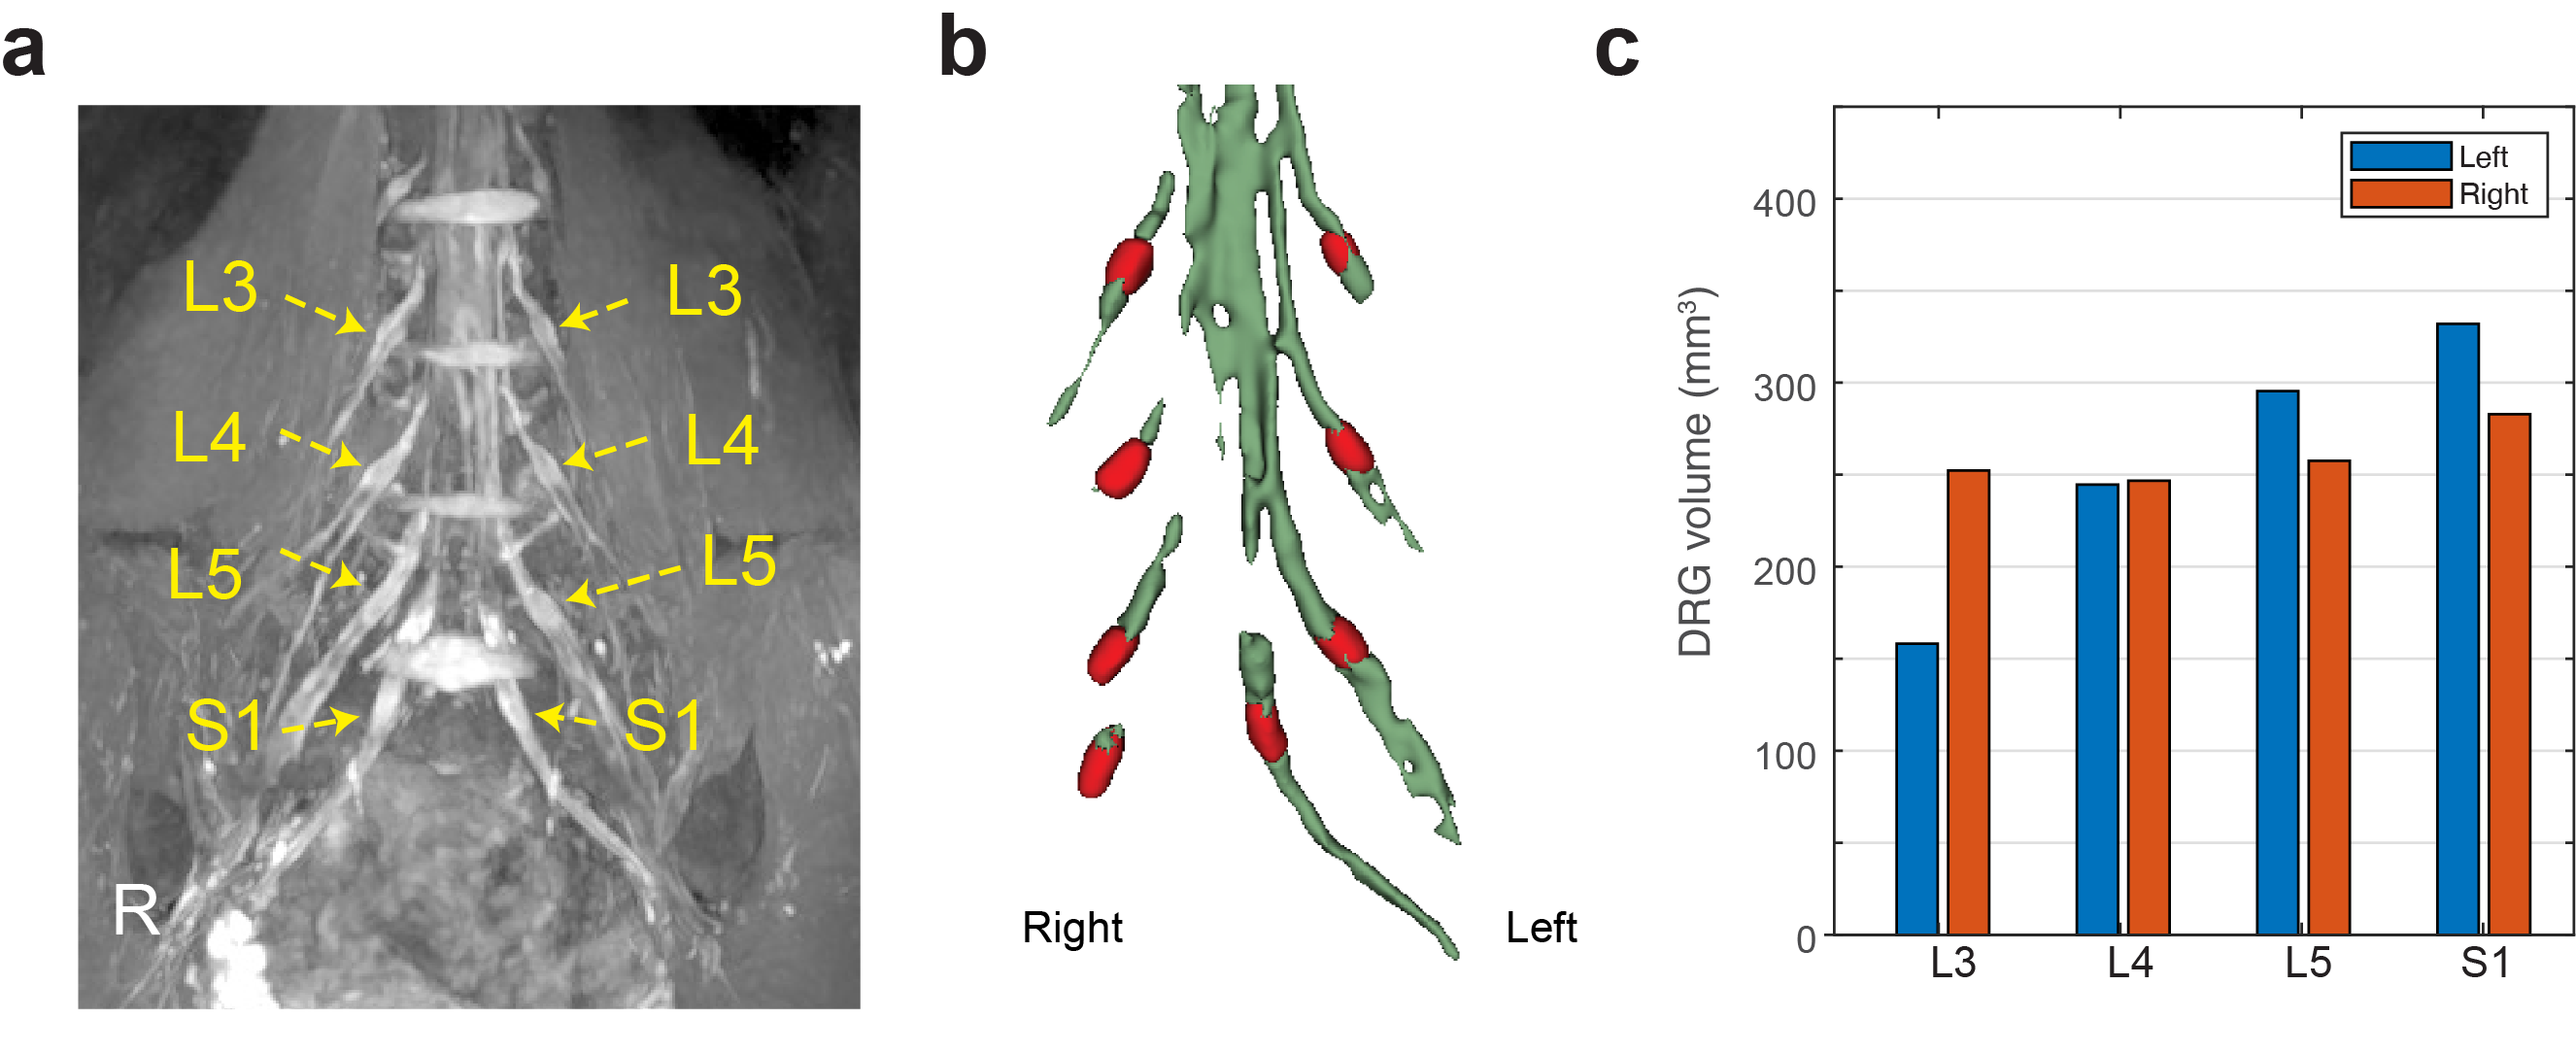
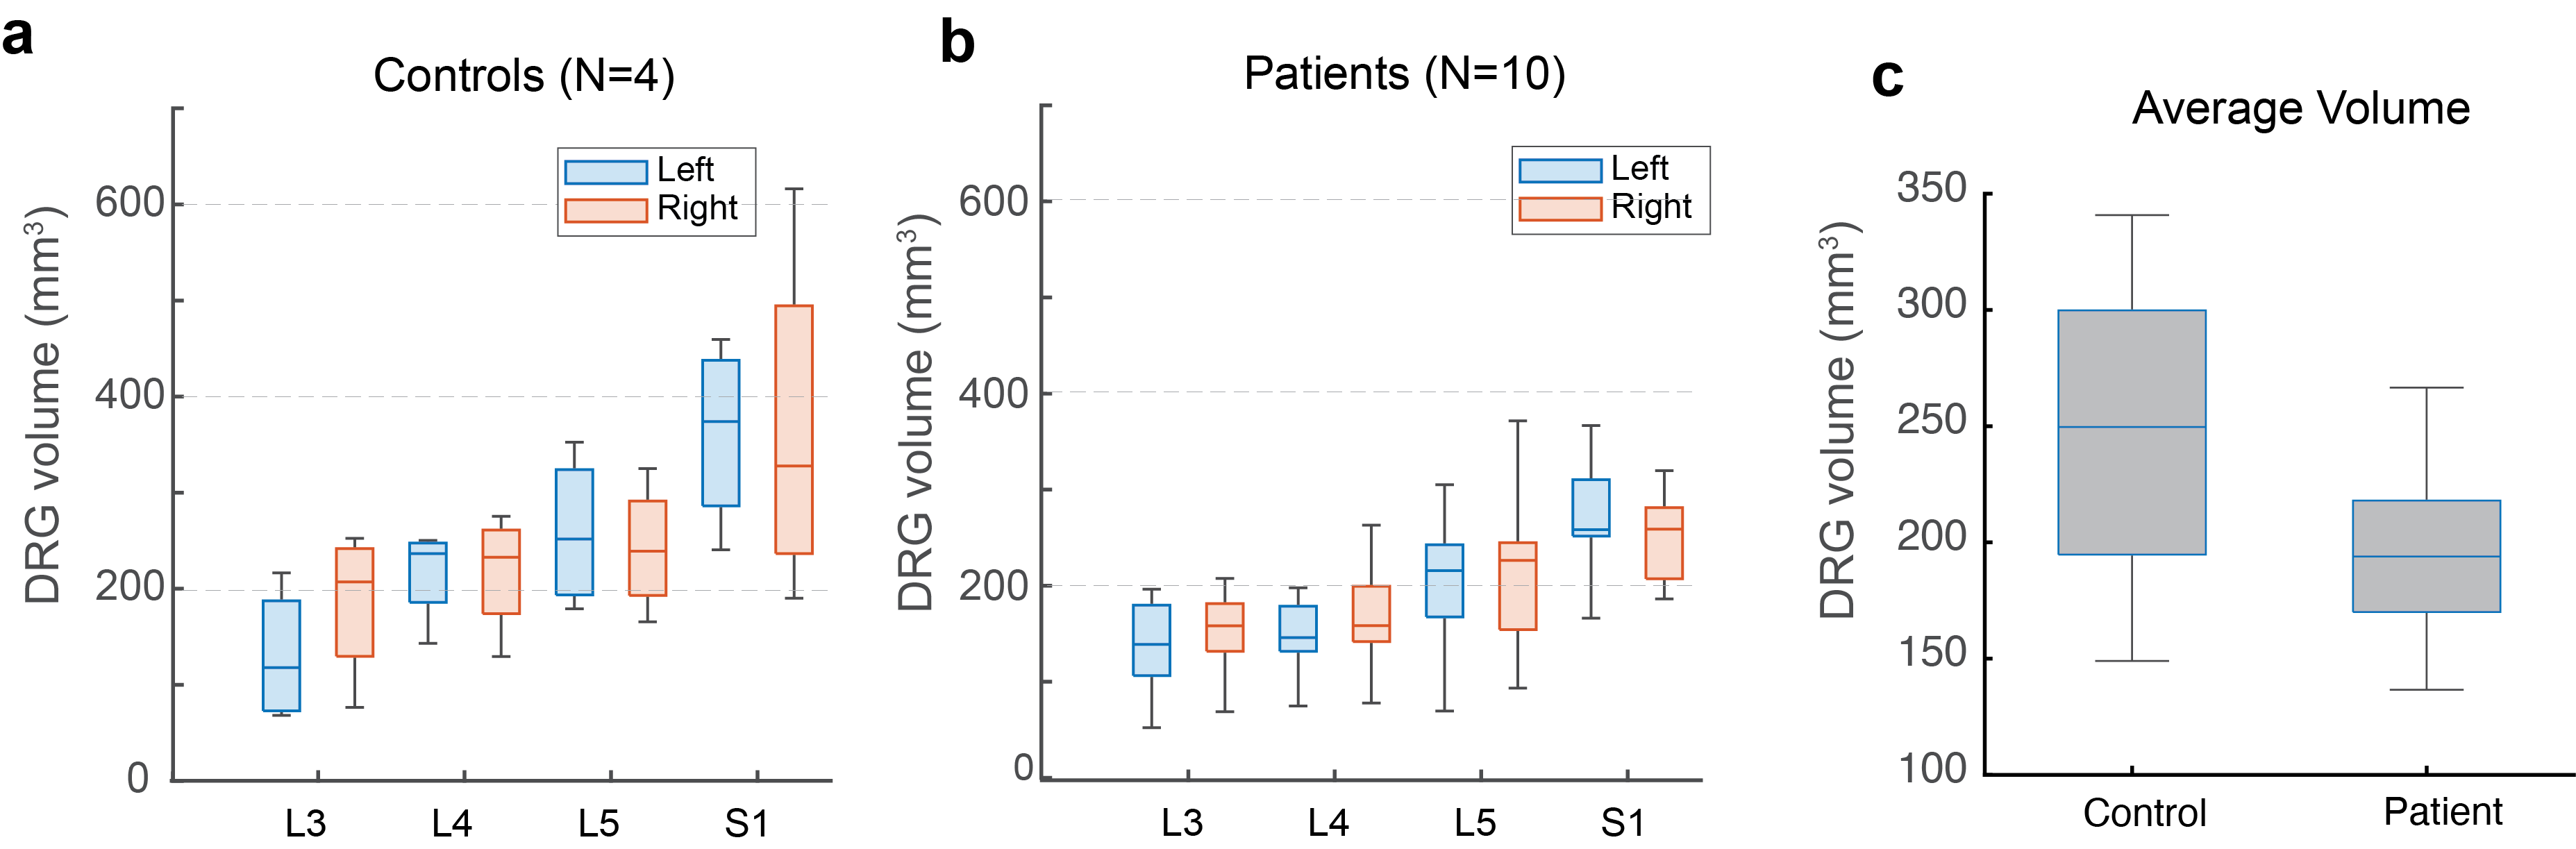
Figure 1 compares maximum-intensity projection (MIP) images over a 3-cm slab from Cube-Flex images between a representative healthy control and a patient. The patient had multi-level degenerative changes in the lumbar spine with nerve root compression and inflammation. DRG on L3-S1 spinal nerves was denoted by arrows. Figure 2 demonstrates the volume-rendered images of the segmented DRG and peripheral nerves for the healthy subject shown in Figure 1 and measured DRG volumes.Figure 3a-b shows box-and-whisker plots of the mean DRG volumes over L3 to S1 spinal nerves for the control and patient groups separately. With the control group, mean DRG volumes continuously increased from L3 to S1 spinal nerves as expected8. However, with the patient group, it was less obvious. Figure 3c compares average DRG volume over L3 to S1 between the control and patient groups. Even though statistical significance was not met based on the Wilcoxon rank sum test, the patient group provided a lower average DRG volume.
Discussion
To best of our knowledge, DRG volume measurement for patients with chronic low back pain has not been presented. 3D manual segmentation of DRG can be time consuming, but in this work, we applied semi-automatic 3D region growing algorithm using seed ROIs to measure them more efficiently. Our DRG volume estimation from healthy control subjects matched well with previously reported values from 3D manual segmentation or geometric ellipsoid approximation based on diameters measured in three principal axis8-9. An association of DRG volume with subject height and weight has been also demonstrated8, but in our data, the mean height and weight between the two groups were not that different, so no compensation was performed. Reduction of DRG volumes for patients can result from mechanical compression and morphological flattening by stenosis but it might also result from local degeneration and loss of neurons9. Microvascular compromise may also contribute to atrophy of the DRG5.Conclusion
This work presented the use of semi-automatic region-growing techniques to analyze DRG volume on 3D MRN. Even though the sample size was limited, we observed a decreased DRG volume in patients with chronic lower back pain compared to asymptomatic controls.Acknowledgements
We would like to acknowledge GE Healthcare for general research support and our funding sources, NIH/NIAMS UH3AR076724 and NIH/NIAMS K01AR075895.References
[1] Howe FA, Filler AG, Bell BA, Griffiths JR. Magnetic resonance neurography. Magn Reson Med. 1992;28(2):328-338.
[2] Delaney H, Bencardino J, Rosenberg ZS. Magnetic resonance neurography of the pelvis and lumbosacral plexus. Neuroimaging Clin N Am. 2014;24(1):127-150.
[3] Sugawara O, Atsuta Y, Iwahara T, Muramoto T, Watakabe M, Takemitsu Y. The effects of mechanical compression and hypoxia on nerve root and dorsal root ganglia. An analysis of ectopic firing using an in vitro model. Spine (Phila Pa 1976). 1996;21(18):2089-2094.
[4] Godel T, Bäumer P, Pham M, Köhn A, Muschol N, Kronlage M, Kollmer J, Heiland S, Bendszus M, Mautner VF. Human dorsal root ganglion in vivo morphometry and perfusion in Fabry painful neuropathy. Neurology. 2017; 89(12):1274-1282.
[5] Jende JM, Kender Z, Rother C, et al. Diabetic polyneuropathy is associated with pathomorphological changes in human dorsal root ganglia: a study using 3T MR neurography. Frontiers in Neuroscience. 2020;14:570744.
[6] Chan TF and Vese LA. Active contours without edges. IEEE Transactions on Image Processing. 2001;10(2):266-277.
[7] Han M, Chin CT, Majumdar S. Efficient Dixon-Based 3D Fast Spin-Echo MR Neurography of Lumbosacral Plexus. In: Joint Annual Meeting ISMRM-ESMRMB, London, England, UK, 2022, p1377.
[8] Kronlage M, Fischer TD, Behnisch R, et al. Dorsal Root Ganglia Volume—Normative Values, Correlation with Demographic Determinants and Reliability of Three Different Methods of Volumetry. Diagnostics. 2022;12(7):1570.
[9] West CA, Davies KA, Hart AM, Wiberg M, Williams SR, Terenghi G. Volumetric magnetic resonance imaging of dorsal root ganglia for the objective quantitative assessment of neuron death after peripheral nerve injury.Experimental neurology. 2007;203(1):22-33.
Figures