1886
Quantitative in vivo imaging of median and ulnar nerves using ultrashort echo time (UTE) MRI: a feasibility study1Department of Radiology, University of California San Diego, San Diego, CA, United States, 2Department of Bioengineering, University of California San Diego, San Diego, CA, United States, 3Radiology Service, Veterans Affairs San Diego Healthcare System, San Diego, CA, United States, 4Department of Orthopedic Surgery, University of California San Diego, San Diego, CA, United States
Synopsis
Keywords: Peripheral Nerves, Nerves, Median, Ulnar
Motivation: Improvements in the medical imaging of nerves have broad medical applications in the diagnosis, tracking, and management of peripheral nerve disease, injury, and treatment.
Goal(s): We aim to demonstrate the feasibility of quantitative in vivo imaging of median and ulnar nerves using ultrashort echo time (UTE) MRI.
Approach: UTE magnetization transfer (MT) prepared Cones (UTE MT-Cones), UTE MT Fat-Sat-Cones, and UTE Multi-echo-T2-FS-Cones sequences were performed in nine healthy adults using a clinical 3T scanner.
Results: Cross-sectional area (CSA), T2*, MMF, and all MTR values were lower in the ulnar nerve, but the differences were significant only for CSA, non-fat-sat MTR 800-2k and 500-10k.
Impact: This demonstration of high-contrast, quantitative imaging of the wrist nerve has considerable potential in practical applications for managing and monitoring nerve disease, injury, and treatment.
Introduction
Peripheral nerves are comprised of nerve fibers contained within endoneurial sheaths, arrayed together with blood vessels and bundled within the perineurium, and then altogether packaged in epineurium 1,2. This compact extracellular matrix structure encasing the nerve creates great challenges in medical imaging due to its complex composition, structure, and size 2. It is difficult to obtain accurate signals from nerve collagen water protons and intra-facile myelin with clinical MR sequences due to the shortened spin-spin relaxation time (T2) caused by the linear orientation/anisotropy of the collagen structure and water interactions 3,4. This has limited the previous studies to only qualitative observations of nerve signal, structure, and shape that lack consistency and accuracy5.Recently, quantitative ultrashort echo time (UTE) imaging has been applied in ex vivo peripheral nerve MR imaging with limited success influenced by freeze-thaw damage as well as embedding and fixation artifacts 2.
The in vivo application of quantitative UTE-MRI has not been investigated in the literature to the author’s knowledge. In this study, we examine the feasibility of in vivo application of the quantitative UTE-MRI techniques, such as 3D UTE MT-Cones, 3D UTE MT Fat-Sat-Cones, and UTE Multi-echo-T2-FS-Cones in median and ulnar nerve assessment.
Methods
Nine healthy volunteers (33±5 years old, 5 females, 4 males) were recruited and scanned. The institutional review board approved this study. Informed consent was obtained from each volunteer.Figure 1 shows two representative axial images of the wrist (slices are 2 cm apart) acquired by the multi-echo in steady-state acquisition (MENSA), 3D UTE MT-Cones, 3D UTE MT Fat-Sat-Cones, and UTE Multi-echo-T2-FS-Cones (1st echo) sequences on a healthy 32-year-old male volunteer. MENSA was performed to measure the nerves’ cross-sectional area and ensure accurate localizing of the nerves in UTE images. 3D UTE MT Fat-Sat and UTE Multi-echo-T2-FS-Cones sequences show efficient suppression of fat signals, compared to the non-fat-sat 3D UTE MT-Cones. The UTE Multi-echo-T2-FS-Cones was used to measure the apparent spin-spin relaxation time (T2*) of the two nerves across the range of TEs (TE=0.03, 4.7, 9.4, 14.1, and 18.8 ms). Detailed sequence parameters in this study are listed in Table 1.
Regions of interest (ROIs) were drawn to sample the median and ulnar nerves and exclude off-target tissue such as muscle, blood vessels, or bone with the morphological guidance of the MENSA sequence images. MT ratio (MTR), T2*, macromolecular proton fraction (MMF), and T2 of macromolecules (T2MM) were calculated in nerve ROIs selected on 2 slices in the mid-arm and then averaged together per nerve. MMF and T2MM were obtained from two-pool MT modeling. Median and ulnar nerve results were compared using a paired two-tailed student t-test.
Results and Discussion
Figure 2 shows the summarized bar plots of average T2*, cross-sectional area, MTR Fat Sat (800-2k), non-Fat-Sat MTRs (800-2k, 800-5k, 500-2k, and 500-5k), MMF, and T2-MM for the median and ulnar nerves of the nine volunteers. T2*, MMF, and MTR values were lower in the ulnar nerve, but the differences were insignificant. Only non-fat-sat MTR 800-2k and 500-10k were significantly lower in the ulnar nerve (p<0.05). The lower T2*, MTR, and MMF values in the ulnar nerve are likely due to the lower inter-fascicular space. Previous ex vivo studies reported lower T2* and MTR values in the median nerve when inter-fascial space was excluded artificially, implying the presence of less short T2 component tissue between fascicles2. This should be thoroughly investigated in future studies with larger sample sizes. This study does not consider race, gender, age, injury, etc., but demonstrates the feasibility of UTE-MR imaging of in vivo peripheral nerves in healthy controls. Future studies are required to better understand its clinical value in the accuracy of nerve quantification.Conclusion
The study illustrates the feasibility of imaging and quantifying median and ulnar nerves in vivo using 3D UTE MT-Cones, 3D UTE MT Fat-Sat-Cones, and UTE Multi-echo-T2-FS-Cones sequences. The observed differences between the median and ulnar nerve and the potential application of quantitative UTE MRI in clinical practice for assessing nerve disease, injury, and treatment should be examined in future investigations using a larger sample size.Acknowledgements
The authors acknowledge grant support from NIH and GE Healthcare.
References
1. Amrami KK, Felmlee JP, Spinner RJ. MRI of Peripheral Nerves. Neurosurg Clin N Am. 2008;19(4):559-572. doi:10.1016/j.nec.2008.07.019
2. Fan SJ, Wong J, Cheng X, et al. Feasibility of quantitative ultrashort echo time (UTE)-based methods for MRI of peripheral nerve. NMR Biomed. 2018;31(9):e3948. doi:10.1002/nbm.3948
3. Ma YJ, Chang EY, Bydder GM, Du J. Can ultrashort-TE (UTE) MRI sequences on a 3-T clinical scanner detect signal directly from collagen protons: freeze-dry and D 2 O exchange studies of cortical bone and Achilles tendon specimens: Are Collagen Protons Directly Detectable with UTE Sequences? NMR Biomed. 2016;29(7):912-917. doi:10.1002/nbm.3547
4. Chang EY, Du J, Chung CB. UTE imaging in the musculoskeletal system: UTE Imaging in the MSK System. J Magn Reson Imaging. 2015;41(4):870-883. doi:10.1002/jmri.24713
5. Goetz JE, Kunze NM, Main EK, et al. MRI-Apparent Localized Deformation of the Median Nerve Within the Carpal Tunnel During Functional Hand Loading. Ann Biomed Eng. 2013;41(10):2099-2108. doi:10.1007/s10439-013-0809-3
Figures
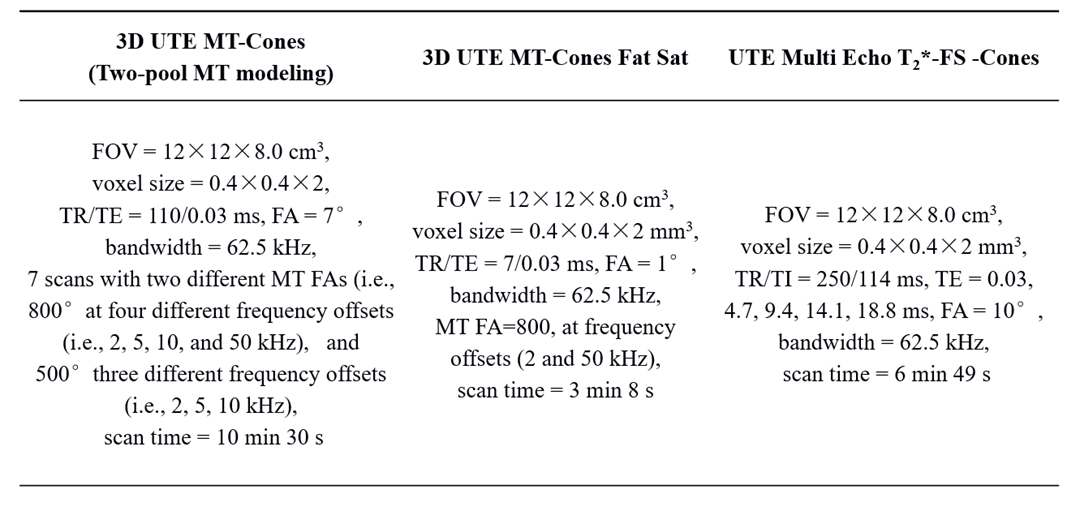
Table 1 Sequence parameters for the wrist MR imaging protocol.
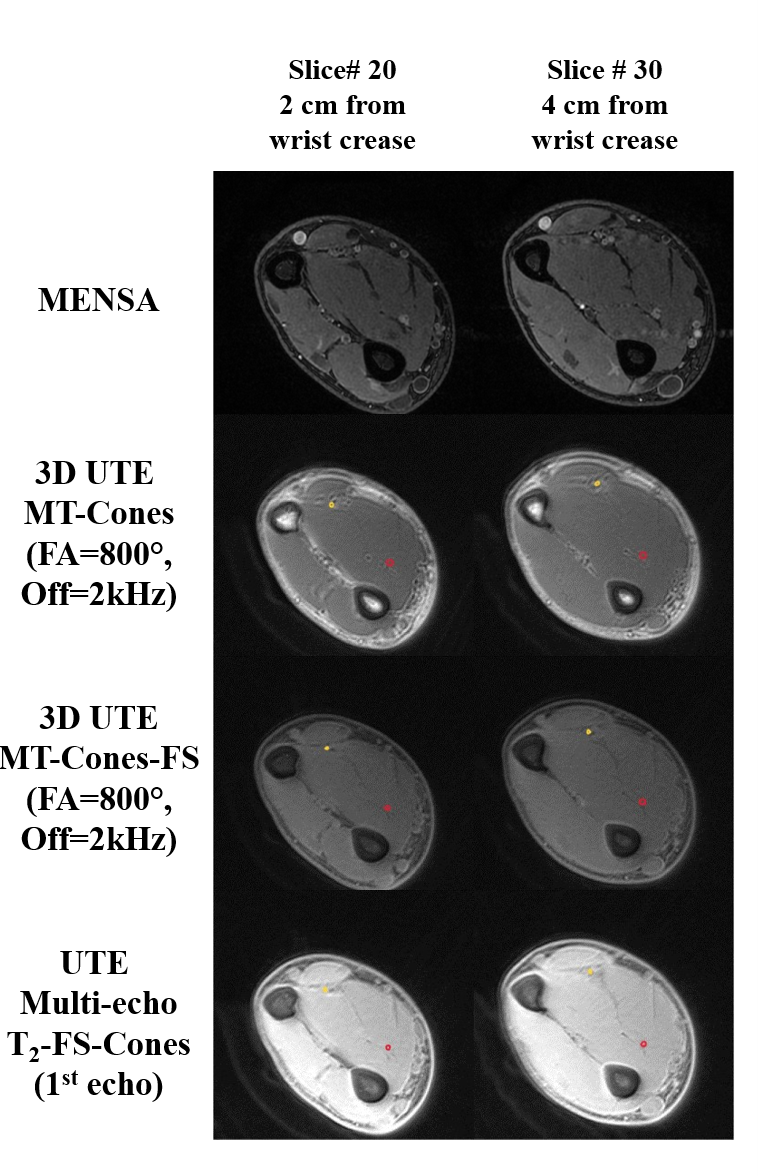
Figure 1 Representative images of the wrist acquired by the MENSA (first row), 3D UTE MT- (second row), Cones 3D UTE MT Fat-Sat-Cones (third row), and UTE Multi-echo-T2-FS-Cones (last row) sequences on a healthy 32-year-old volunteer. Median nerve ROIs are depicted in red and ulnar nerve ROIs are depicted in yellow. 3D UTE MT Fat-Sat and UTE Multi-echo-T2-FS-Cones sequences show efficient suppression of fat signals, compared to the non-fat-sat 3D UTE MT-Cones.
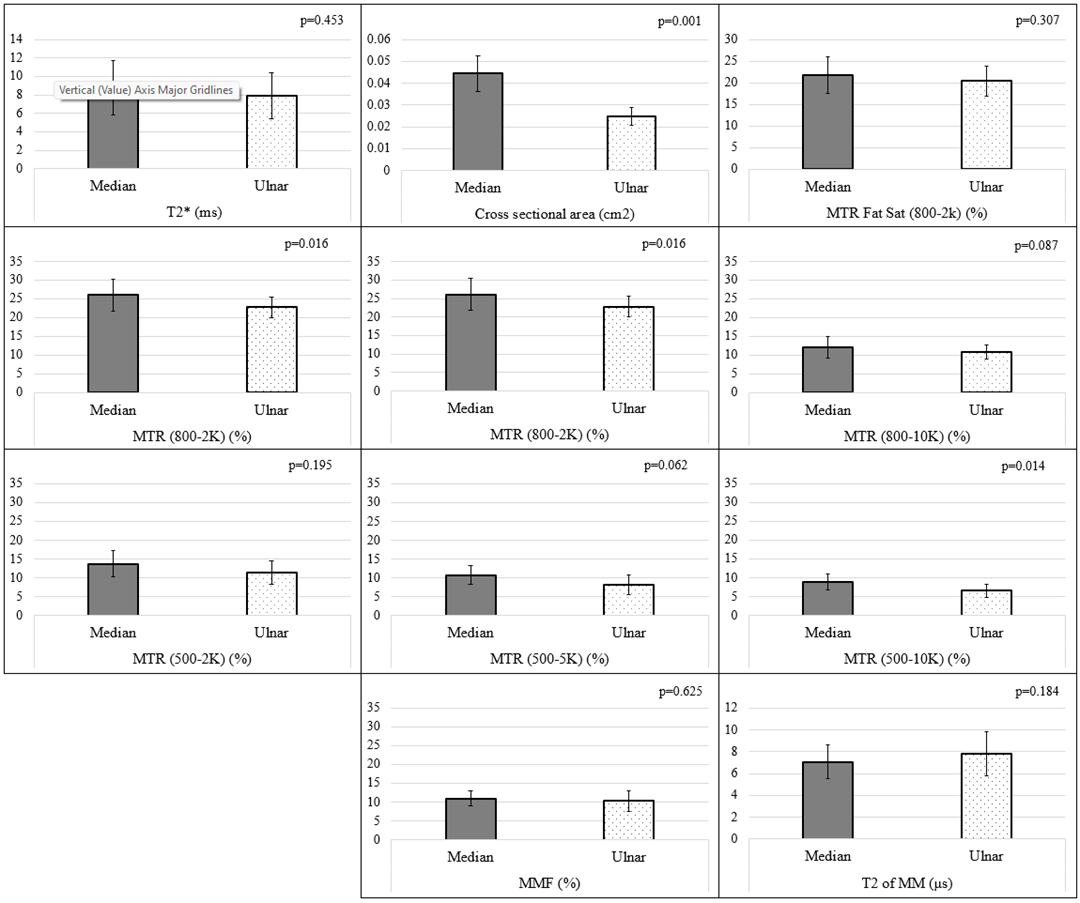
Figure 2 Bar plots of Average T2*, Cross-sectional area, MTR Fat Sat (800-2k) (top row); MTR FA 800° (second row) and FA 500° (third row), across offsets 2, 5, and 10 kHz, respectively; and MMF and T2 of MM (last row); for both the median and ulnar nerve of the wrists of nine healthy volunteers. Paired two-tailed student t-test was performed and p values are displayed in the top right corner corresponding to each graph.