1865
Super-resolution Y-Net for simultaneous 1H MRF/23Na MRI
1NMR Signal Enhancement, Max Planck Institute for Multidisciplinary Sciences, Göttingen, Germany, 2Bernard and Irene Schwartz Center for Biomedical Imaging, Department of Radiology, New York University School of Medicine, New York, NY, United States, 3Vilcek Institute of Graduate Biomedical Sciences, New York University School of Medicine, New York, NY, United States, 4Center for Advanced Imaging Innovation and Research, New York University School of Medicine, New York, NY, United States
Synopsis
Keywords: Non-Proton, Non-Proton, Super-resolution, fingerprinting
Motivation: To improve resolution for translating sodium MRI into clinical practice.
Goal(s): Develop a super-resolution neural network for brain sodium images.
Approach: A cascaded Y-Net is proposed to generate high-resolution sodium images from simultaneously acquired 1H MRF/23Na MRI data. Human brain images from 8 healthy subjects were used for training and validation (154), and testing (22).
Results: The generated high-resolution sodium images from the Y-Net showed a structural similarity index measure (SSIM) of 0.935, a RMSE=0.034 and a PSNR=28.8 compared with the ground truth.
Impact: We introduce a Y-Net super-resolution neural network that generates high-resolution sodium images from simultaneously acquired 1H MRF/23Na MRI data.
Introduction
Sodium (23Na) MRI can reveal valuable metabolic information1. However, its low natural abundance in the human body and low gyromagnetic ratio practically prohibits the acquisition of high-resolution (HR) 23Na images. Therefore, developing post-processing methods to increase sodium resolution is critical for translating sodium MRI into clinical practice. In this work, we introduce a Y-Net super-resolution method that generates HR sodium images from simultaneously acquired 1H MRF/23Na MRI data2.Methods
DatasetThe method was tested on simultaneously-acquired low-resolution (LR) sodium and HR proton density, T1 and T2 maps2. The images were acquired at 7T (MAGNETOM, Siemens) using an in-house developed 16-channel-Tx/Rx dual-tuned head coil3. Eight volunteers were scanned (2 females, 32±12 years old) after informed consent, in accordance with the relevant institutional and national guidelines.
The 3D simultaneous 1H MRF/23Na MRI sequence2 parameters were: FOV 240´240´280 mm3,1H 160´160´56/23Na 84´84´56 matrix, 1H 1.5´1.5´5/23Na 2.85´2.85´5 mm3 resolution, 1H 7.5ms/23Na 15ms TR, 30º constant FA for 23Na, pulse train of 500 FAs for 1H, 1 slab, 6 shots per slab, 1H full radial/23Na center-out radial trajectories, scan time 21 min. Ground truth HR 23Na images were acquired using a 3D stack-of-stars GRE sequence, with the acquisition parameters adjusted to match the LR 23Na image contrast (2 averages, and scan time 42 min). The resolution ratio between the HR and LR is 1.9 in both in-plane directions.
Y-Net super-resolution
The Y-Net is a deep convolutional neural network architecture like a U-Net but with two encoder paths4. It is composed of two contracting paths, an expanding path, and skip connections that allow the network to retain low-level features. We modified the Y-Net to use multi-contrast images in the 1H path and only sodium density in the 23Na path. Additionally, a second Y-Net was cascaded to the first one to refine the result, taking as input the 23Na output from the first Y-Net and the 1H images.
The network was trained using 160×160 1H images and 23Na images interpolated to match the 1H images as input and 160×160 23Na images as targets. The images from 7 healthy volunteers (22 images per volunteer) were augmented using rotation and additive Gaussian noise, generating a set of 1540 images used for training (1386) and validation (154). The dataset from volunteer #8 was used for testing (19). The network was trained using AdamW with a learning rate of 0.01, decreasing by 20% every 10 epochs for a total of 300 epochs. The loss function used was the structural-similarity-index-measure (SSIM)5. Fig.1 shows a schematic diagram of the network architecture.
The performance of the method was compared with a super-resolution method based on partial-least-squares-regression6 (PLS) and with bi-cubic interpolation.
Methods evaluation
To evaluate the method’s performance, the SSIM, the root-mean-square error (RMSE), and the peak-signal-to-noise ratio (PSNR) between ground truth and generated HR 23Na images were computed over the 3D volume of volunteer #8.
Results & Discussion
Fig. 2 shows the center slice of the initial 1H and 23Na data acquired with 3D simultaneous 1H MRF/23Na MRI and the ground truth HR 23Na acquired with 3D stack-of-stars GRE. Fig. 3 shows the acquired LR and HR (ground truth) 23Na images, the generated HR 23Na images, and the differences between ground truth and the generated HR images for the four central slices of volunteer #8 (test dataset). Fig. 4 shows the comparison between the Y-Net, PLS and bi-cubic interpolation methods for the central slice of volunteer #8. Table 1 shows the statistical parameters calculated for each method over the 3D volume.The results for the Y-Net over 3D volume of the test subject show a SSIM=0.935, RMSE=0.034, and PSNR=28.8. The results from the PLS method are SSIM=0.916, RMSE=0.040, and PSNR=28.0 and for the bi-cubic interpolation SSIM=0.928, RMSE=0.058, and PSNR=24.3. The Y-Net outperforms both methods for all the statistical parameters, with a small difference in the RMSE and PSNR compared with the PLS method.
Although the PLS method does not need any training, it takes a long time to be executed (≈616s), while the Y-Net running on a regular CPU takes ≈51s. Even with the high computational cost of training the Y-Net, the difference in running time can potentially allow for online implementation. When running the Y-Net on a A100 GPU, the prediction time falls to ≈1.2s.
Conclusion
We introduced a super-resolution Y-Net method to generate HR 23Na images. The final HR sodium image showed high similarity to the HR sodium ground truth image (SSIM=0.935). The performance of the Y-Net method was found superior to the performance of the bi-cubic interpolation and the super-resolution PLS method6.Acknowledgements
The research reported in this publication was supported by the NIH/NIBIB grant R01 EB026456, and performed under the rubric of the Center for Advanced Imaging Innovation and Research, a NIBIB Biomedical Technology Resource Center (P41 EB017183).References
1. Madelin G, & Regatte R R. Biomedical applications of sodium MRI in vivo. J. Magn. Reson. Imag., 2013;38:511-529.
2. Yu, Z., Hodono, S., Dergachyova, O., Hilbert, T., Wang, B., Zhang B., Sodickson, D. K., Madelin, G., & Cloos, M. A. Simultaneous 3D acquisition of 1H MRF and 23Na MRI. Mag. Res. in Med., 2021, 83(6), 00:1-14.
3. Wang, B, Zhang, B., Yu, Z., Ianniello C., Lakshmanan K., Paska, J., Madelin, G., Cloos, M. & Brown, R.. A radially interleaved sodium and proton coil array for brain MRI at 7T. NMR Biomed. 2021, e4608.
4. Do W., Seo S., Han Y., Ye JC, Choi SH, Park S, Reconstruction of multicontrast MR images through deep learning. Med. Phys., 2020, 47 (3).
5. Wang, Z., Bovik, A.C., Sheikh, H.R.; Simoncelli, E.P. Image quality assessment: from error visibility to structural similarity. IEEE Trans. on Imag. Process. 2004;13(4),600–612
6. Rodriguez G.G., Yu Z., Shaykevich S., O'Donnell, L., Alguilera L., Cloos M. A., & Madelin G., Super-resolution of sodium images from simultaneous 1H MRF/23Na MRI acquisition. NMR Biomed., 2023, vol 36, e4959.
Figures
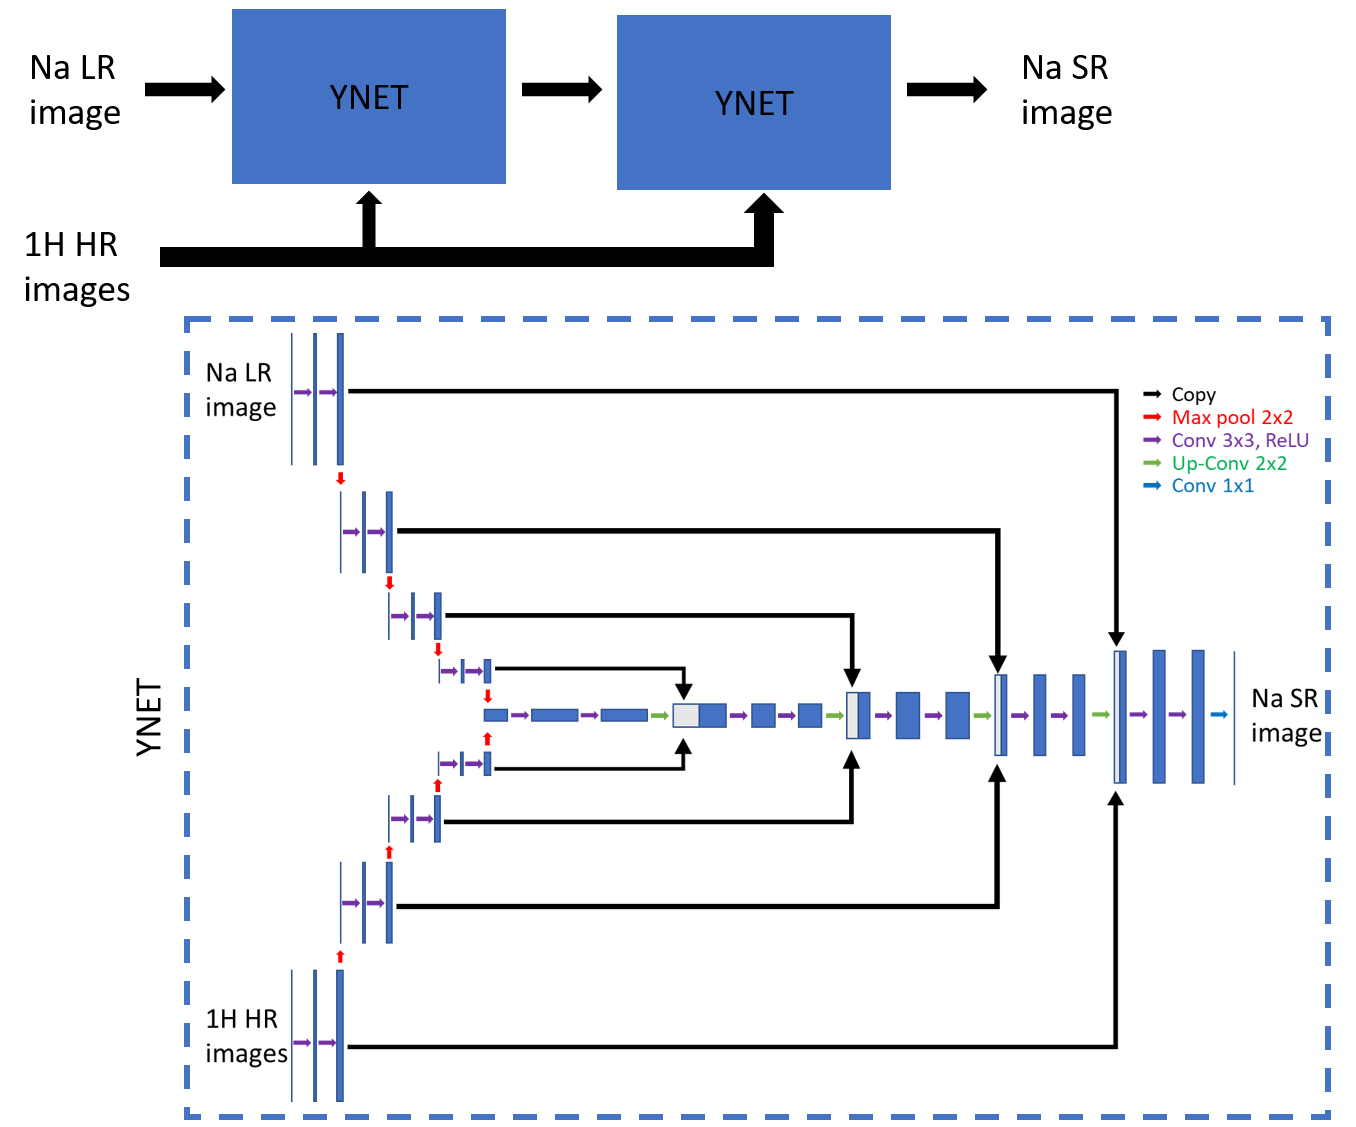
Figure 1: Y-Net super-resolution architecture. Top: schematic of the cascaded Y-Nets, where the input of the second Y-Net is the output from the first one. Bottom: diagram of one Y-Net.
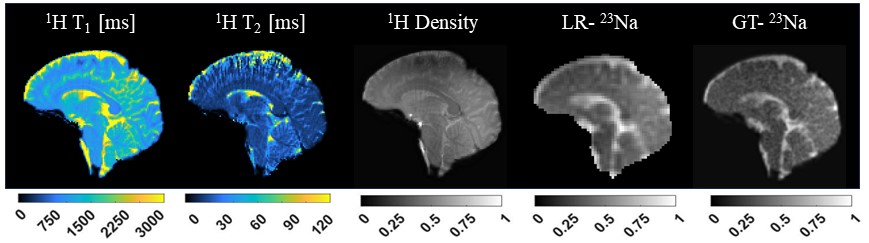
Figure 2: Initial data. The proton relaxation maps, the proton density, and the low resolution sodium image were acquired with simultaneous 1H MRF/23Na MRI. The HR sodium image (ground truth - GT) was acquired with a 3D radial GRE. The in plane resolution of the proton and HR sodium images is 1.5´1.5mm2 and 2.85´2.85mm2 for sodium LR (LR/HR ratio = 1.9), with slice thickness of 5 mm for all images.
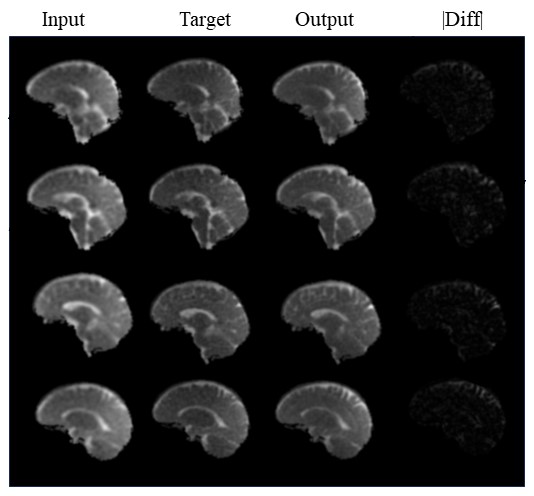
Figure 3: Y-Net Results: comparison between acquired and generated 23Na images for the 4 central slices of the test dataset (volunteer #8). On the right side are shown the absolute value of the difference between ground truth (target) and the generated HR (output) images. The images are scaled between [0,1].
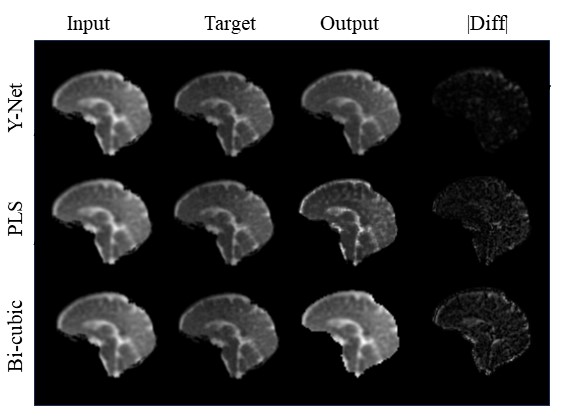
Figure 4: Comparison between the Y-Net, PLS and bi-cubic interpolation methods for the central slice of the test dataset. (volunteer #8) On the right side are shown the absolute value of the difference between ground truth (target) and the generated HR (output) images. The images are scaled between [0,1].
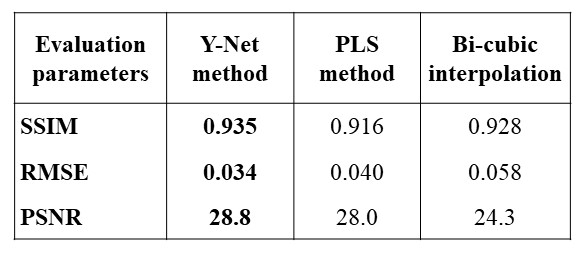
Table 1: Statistical values for the super-resolved images using the proposed Y-Net, the PLS, and the Bi-cubic interpolation. The proposed Y-Net slightly outperforms the PLS method in SSIM and has comparable RMSE and PSNR. It also improves on the bi-cubic interpolation in every metric.