1858
Simultaneous multi-transient linear-combination modeling of MRS data improves uncertainty estimation1The Russell H. Morgan Department of Radiology and Radiological Science, The Johns Hopkins University School of Medicine, Baltimore, MD, United States, 2F. M. Kirby Research Center for Functional Brain Imaging, Kennedy Krieger Institute, Baltimore, MD, United States, 3Department of Chemical and Biological Physics, Weizmann Institute of Science, Rehovot, Israel, 4Department of Biomedical Engineering, The Johns Hopkins University, Baltimore, MD, United States, 5Mathematical Institute for Data Science, The Johns Hopkins University, Baltimore, MD, United States
Synopsis
Keywords: Spectroscopy, Spectroscopy, linear-combination modeling, dynamic MRS, 2D modeling, fMRS
Motivation: Modeling and application of dynamic MRS is receiving growing interest in the community.
Goal(s): Accuracy, precision, and uncertainty of 2D modeling algorithms must be carefully characterized.
Approach: Here, we generated synthetic spectra of an idealized (single metabolite with a stable signal across transients) conventional 1D-MRS experiment. We then compared accuracy, precision, and uncertainty estimation between a 2D model of all transients without averaging and a 1D model of the averaged spectrum.
Results: Both models performed similarly in terms of accuracy and precision. 2D-LCM afforded small benefits for uncertainty estimation for uncorrelated noise and substantial benefits for correlated noise.
Impact: For conventional (non-dynamic, multi-transient) MRS data, 2D-LCM without averaging and 1D-LCM after averaging perform similarly accurate and precise. 2D-LCM affords gains in uncertainty estimation that appear to be related to the degree of noise correlation across transients.
Introduction
The interest in application and modeling of dynamic MRS has recently grown1–6. Therefore, it is imperative to systematically investigate accuracy, precision, and uncertainty estimation of 2D modeling algorithms. It has recently been shown that 2D modeling yields advantages for precision of metabolite estimation in dynamic/interrelated MRS data3. However, conventional (non-dynamic) acquisitions with multiple transients are still widely used. Here, we investigated whether simultaneous 2D modeling of all transients in conventional MRS data offers benefits compared to 1D modeling of the averaged spectrum.Methods
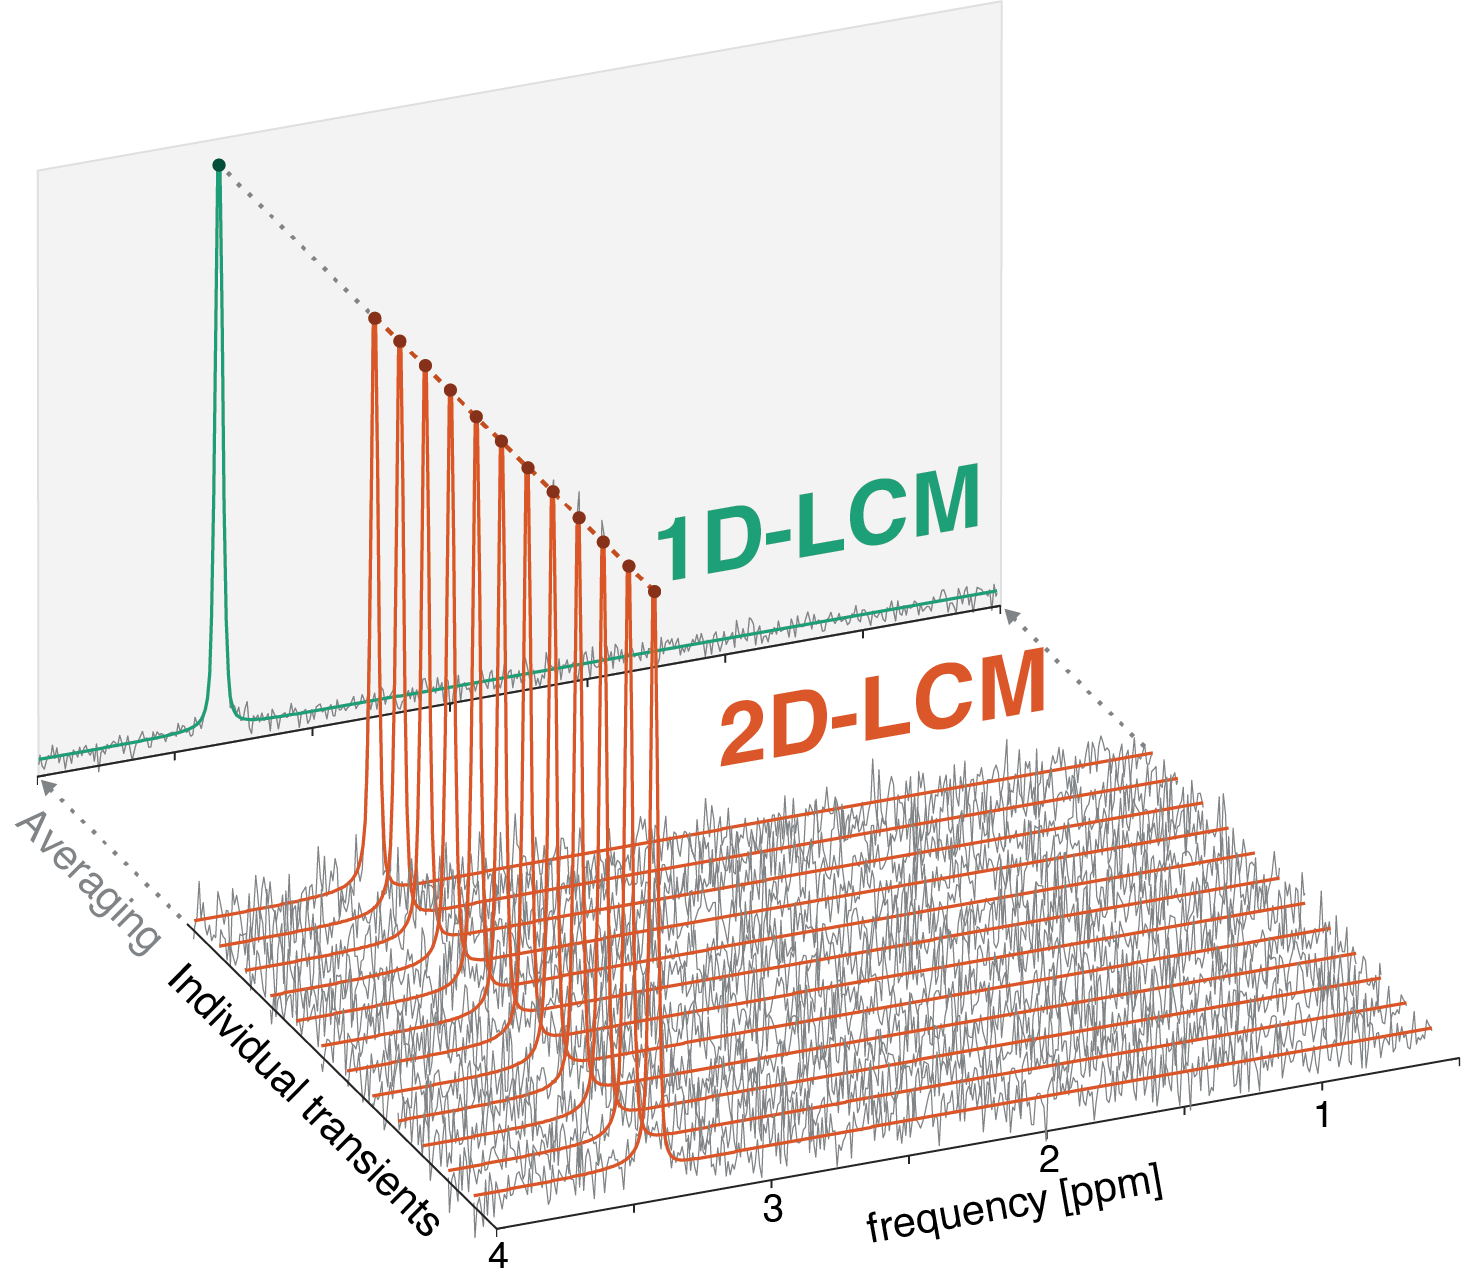
We generated idealized synthetic spectra for two six-proton spin systems (scyllo-inositol and GABA, TE=30 ms sLASER)7. Six SNR levels (196, 128, 48, 12, 6, 3) were defined based on the averaged spectrum. The required amount of uncorrelated noise was determined for the scyllo-inositol singlet peak and subsequently used for GABA. Other parameters were set based on the distribution mean values from a prior study8: amplitude (0.15), Gaussian line broadening (5.70 Hz), and Lorentzian line broadening (2.42 Hz) without a baseline. For each scenario, we generated 2,500 spectra, sufficient for CRLBs to converge towards the standard deviation9. To assess the impact of noise correlation, we generated 45,000 synthetic spectra with the same amplitude and lineshape parameter at SNR=196 with 9 different noise correlation strengths (r between 0.1 and 0.9) along the transient dimension.We modeled all data with a new 2D-capable, highly customizable MATLAB-based LCM algorithm in Osprey10. Least-squares optimization was performed on the real part in frequency domain (0.5 to 4 ppm) with the initial parameter guesses set to their respective ground truth values. No baseline model was employed. For the 1D-LCM, individual transients were averaged before modeling. For the 2D-LCM, all parameter estimates were fixed along the transient dimension, e.g., the same for all transients (Figure 1).
We defined three model outcome measures for each approach: (1) accuracy (the relative bias of the estimated amplitudes against the ground truth); (2) precision (standard deviations of the estimated amplitudes) and (3) uncertainty (estimated Cramér-Rao Lower Bounds (CRLB) of the amplitudes). True CRLB values were calculated based on the ground truth parameter.
Results
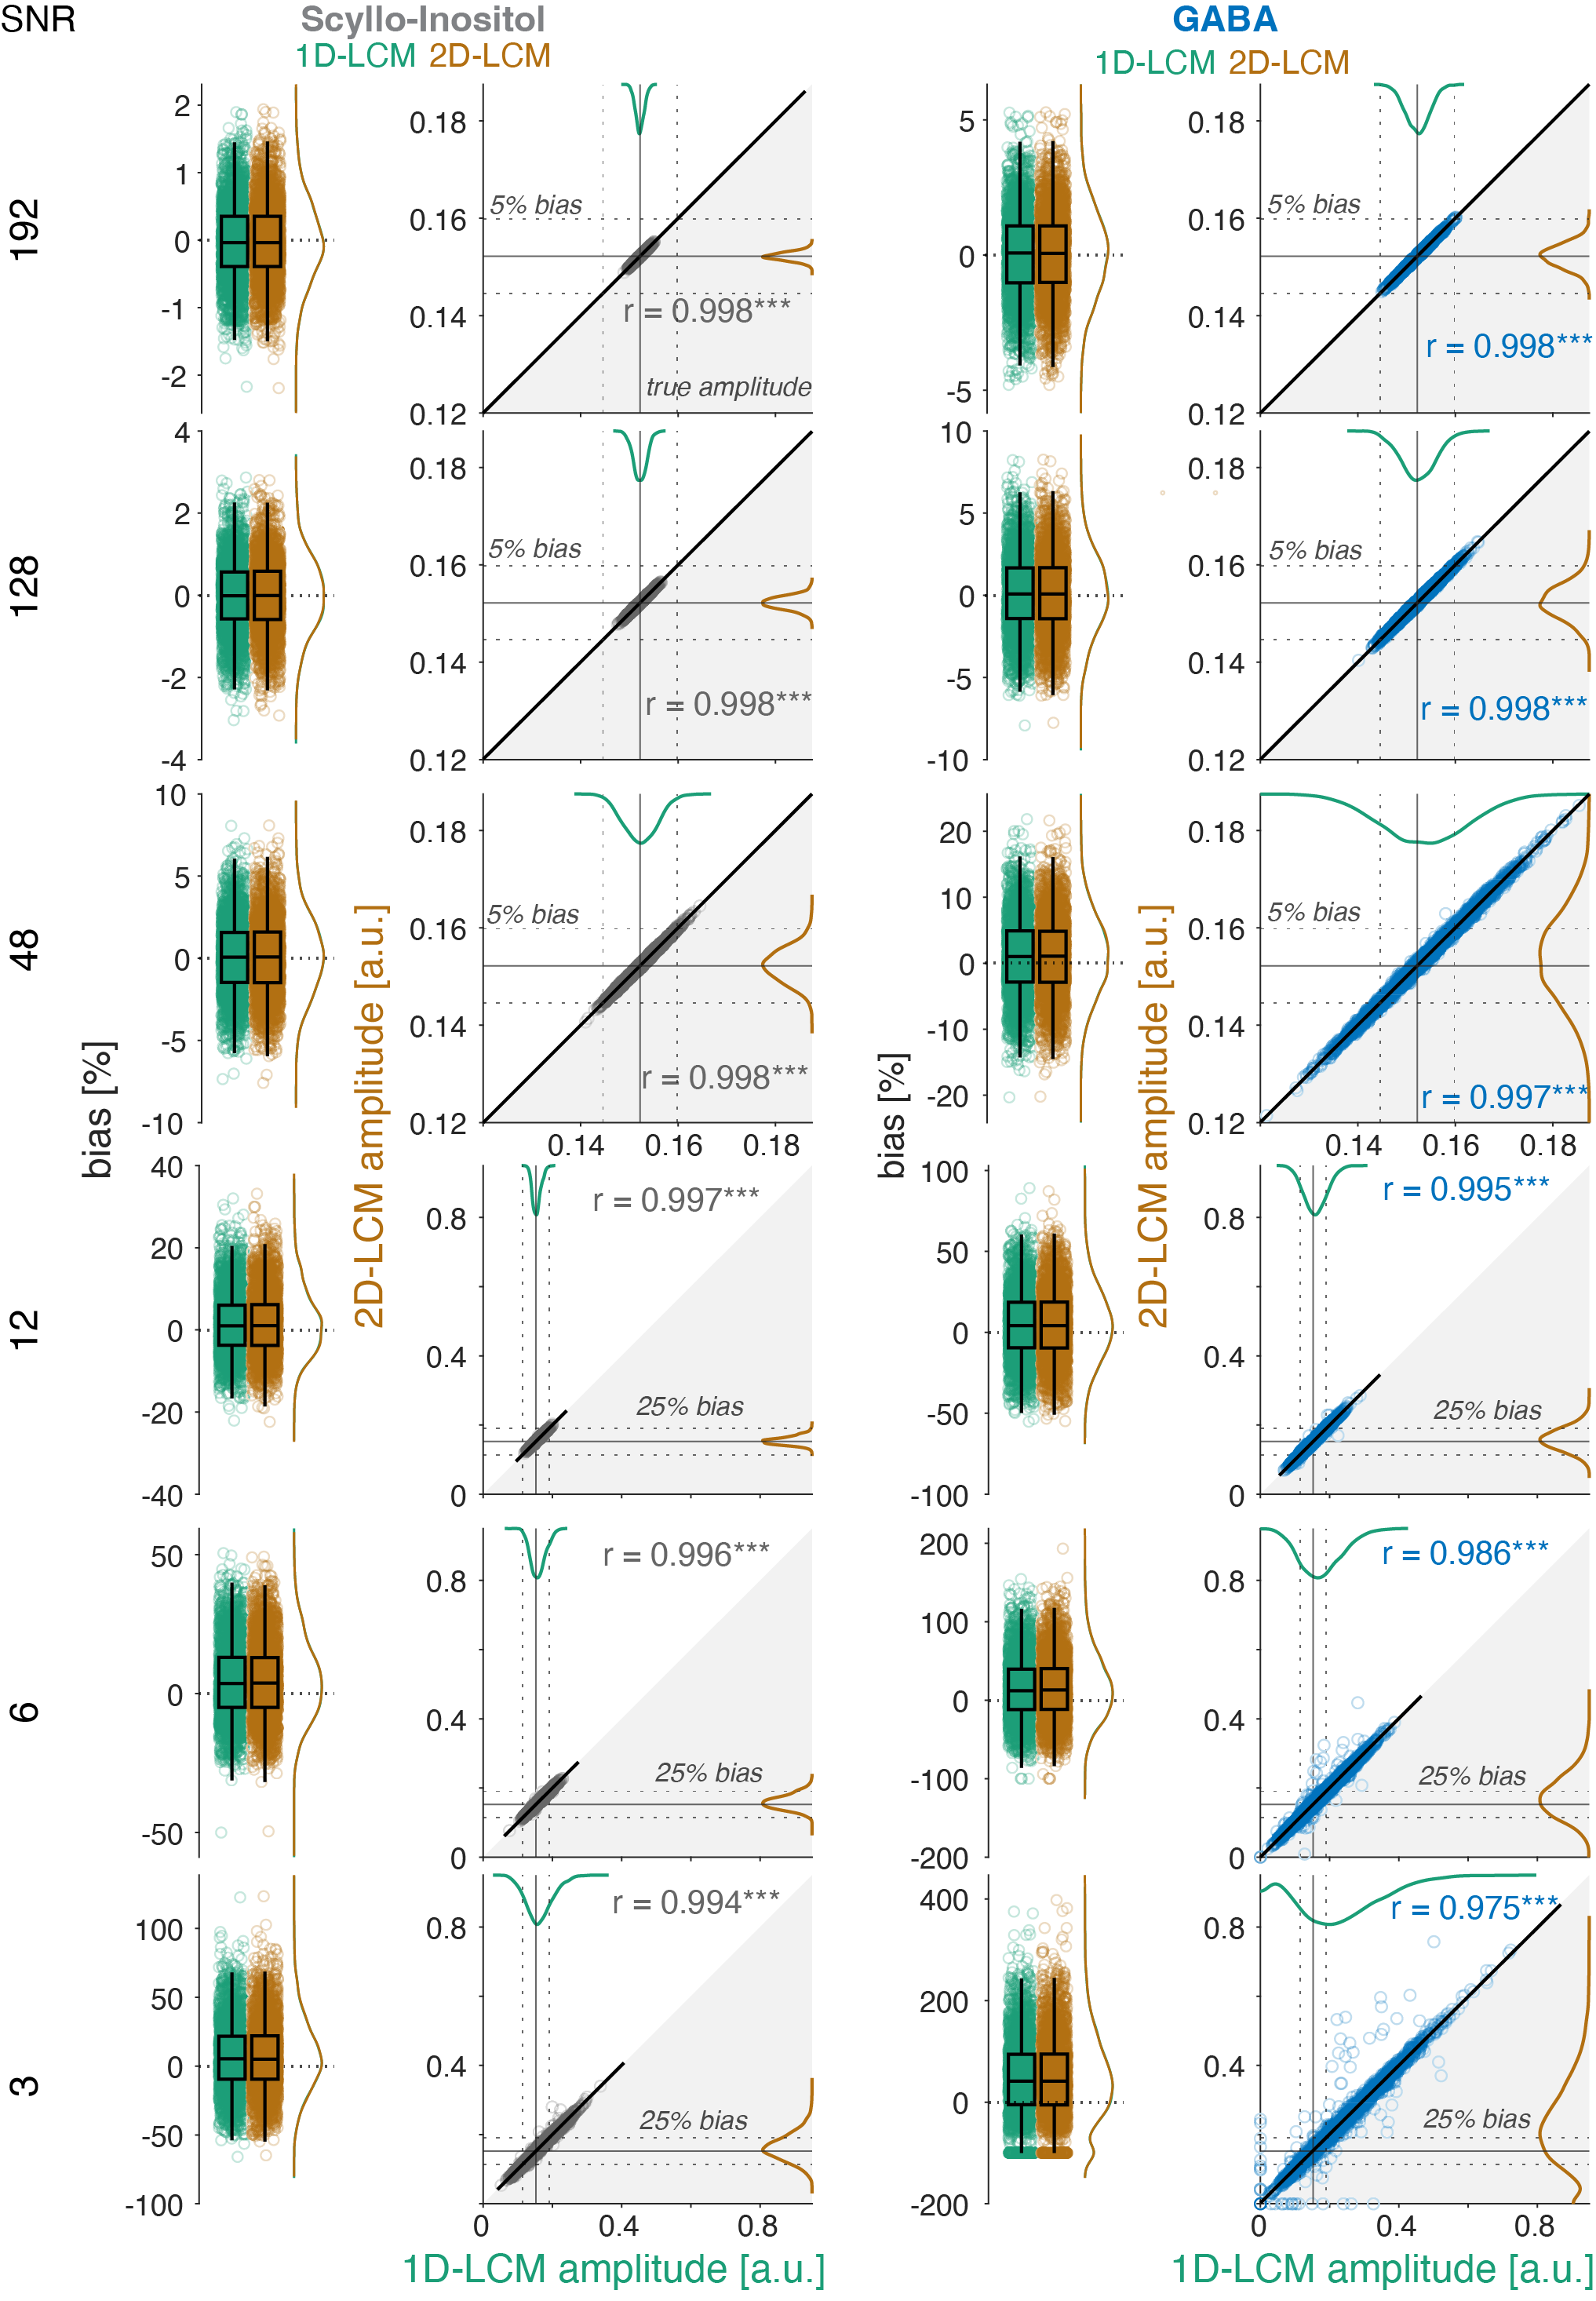
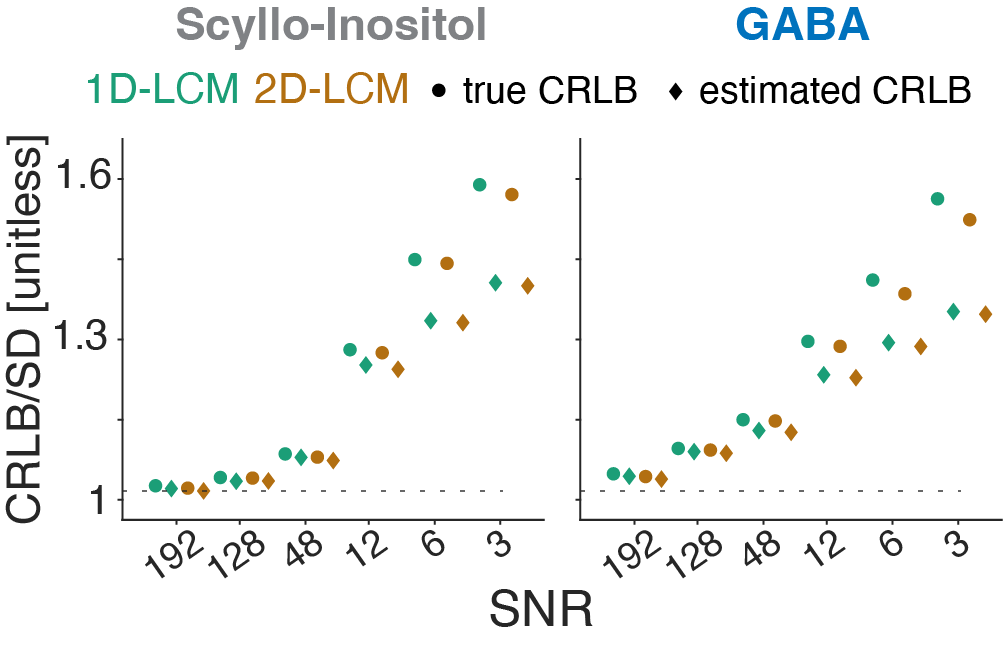
Means and standard deviations of the amplitude estimates for both model approaches and metabolites agreed well (Figure 2).Ratios of the mean estimated and the mean true CRLB to the standard deviation of the amplitude estimates were within 13% of unity for the three highest SNR levels (Figure 3). The closer this ratio is to 1, the better CRLBs perform as estimators of aleatoric amplitude uncertainty caused by random noise9.
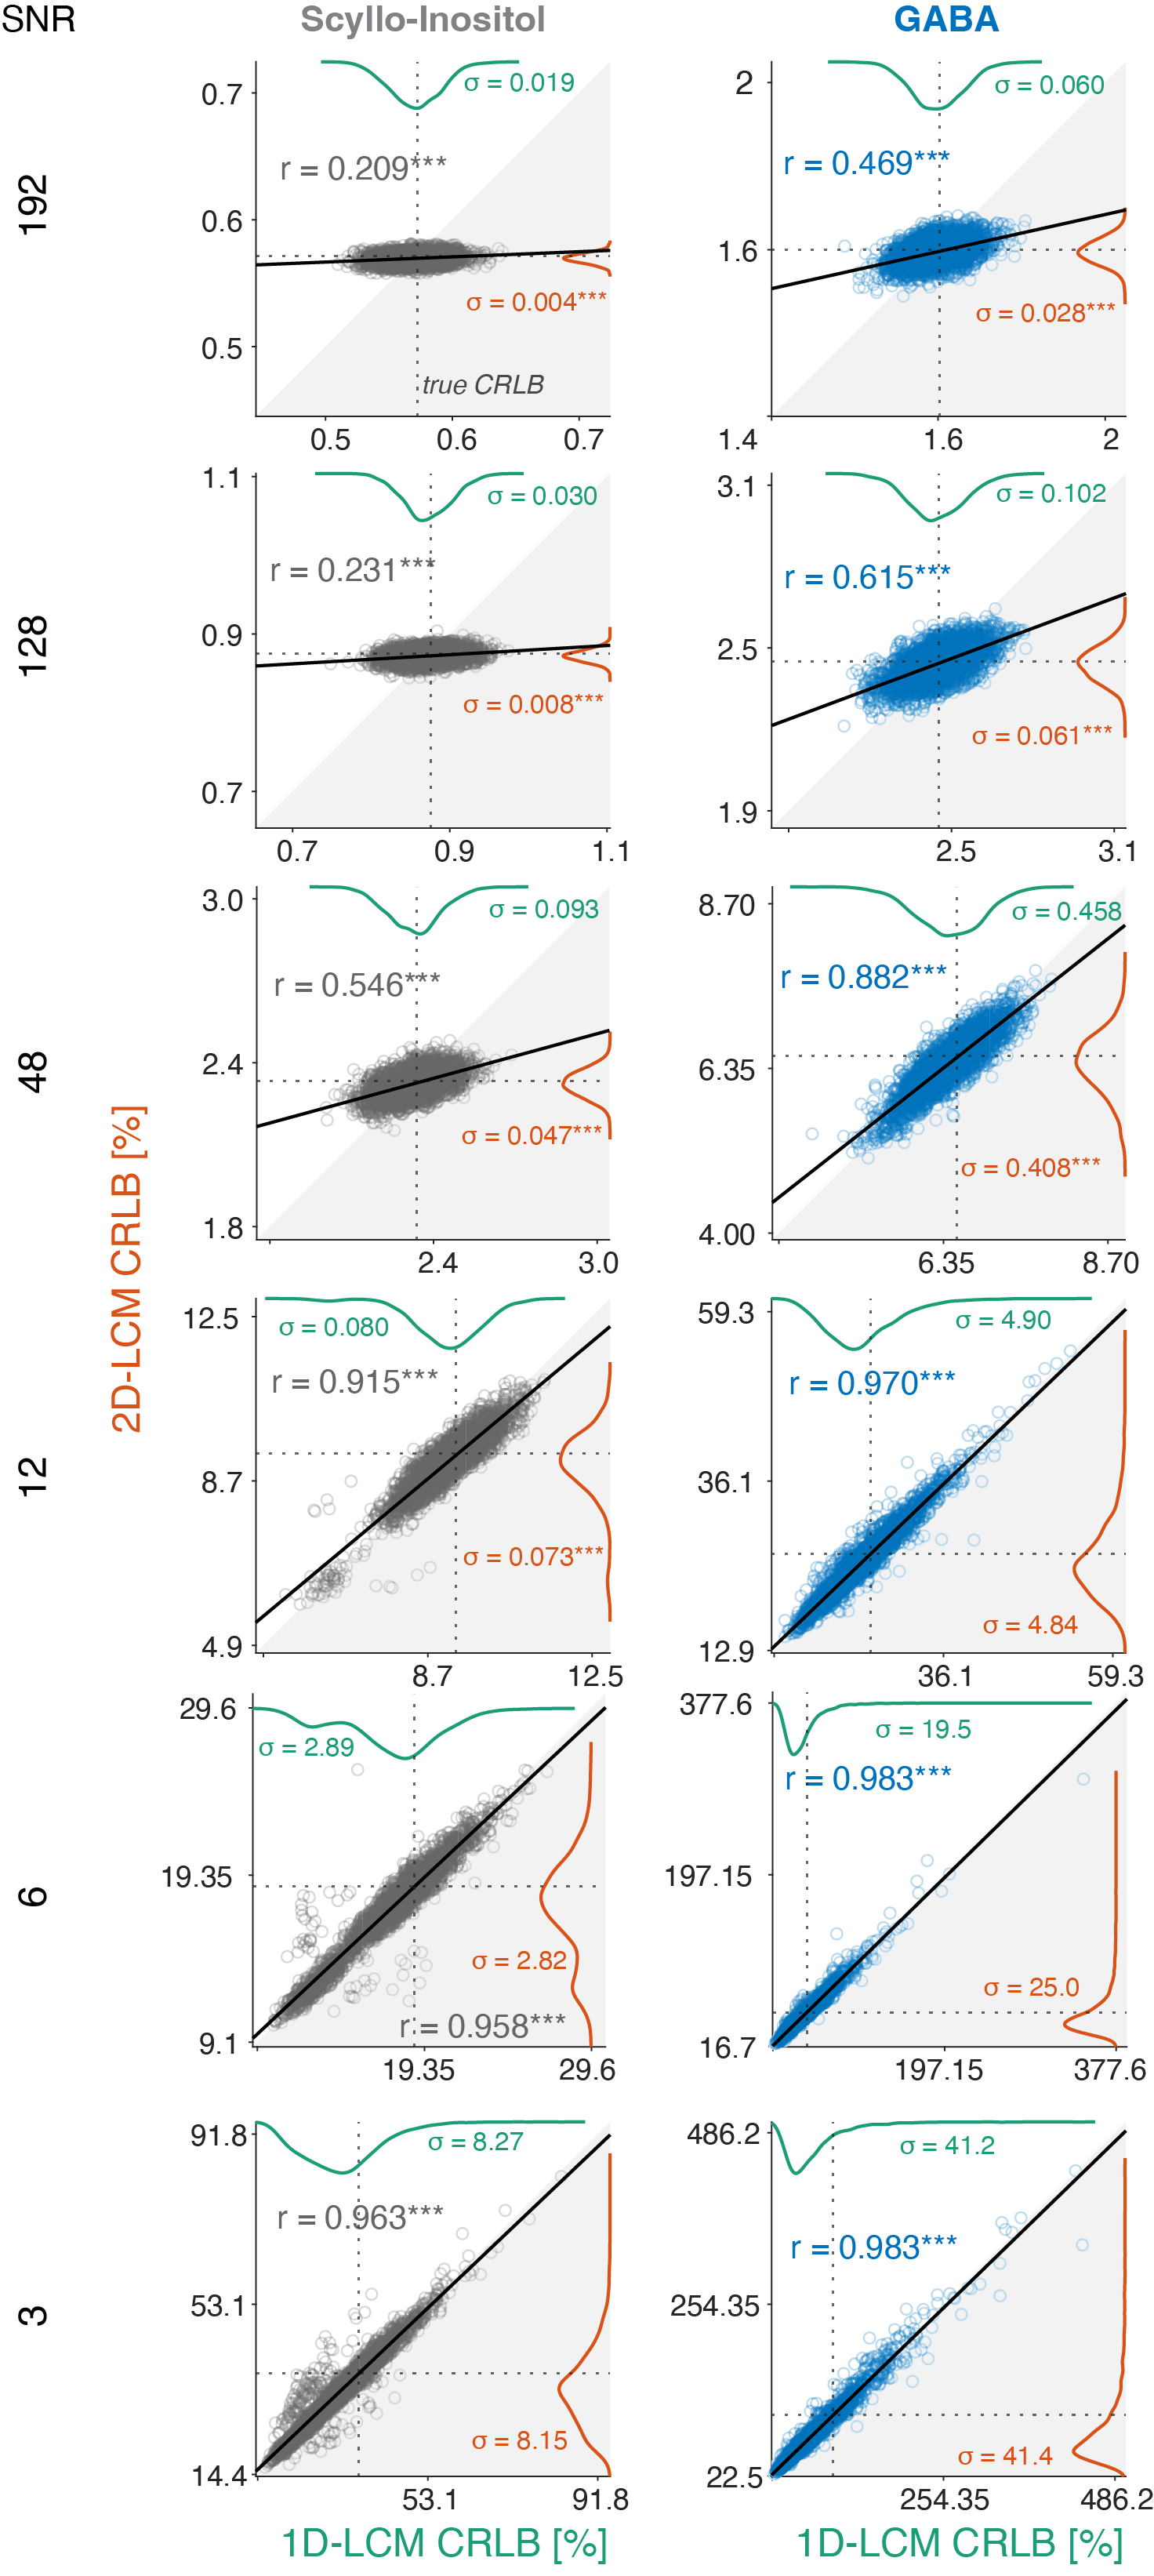
Mean CRLBs did not significantly differ between 1D and 2D modeling and agreed well with the true CRLBs. Interestingly, the standard deviation of the estimated CRLB for sI was significantly (although not substantially) smaller for the 2D-LCM for the four highest SNR levels compared to the 1D-LCM (Figure 4).
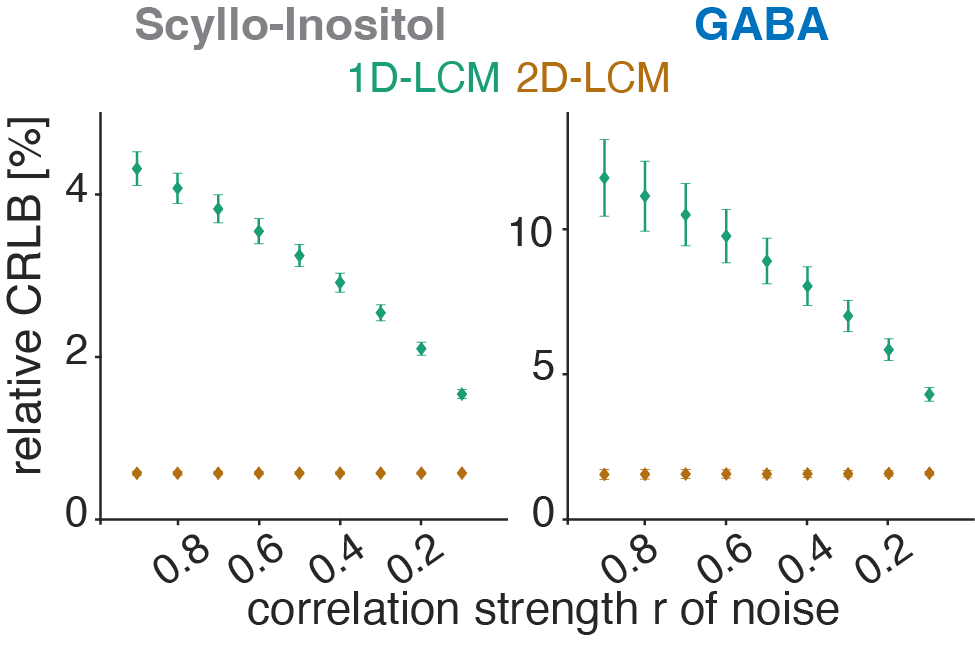
For data with correlated noise, the estimated mean relative CRLBs for the 2D LCM were independent of noise correlation strength, and their standard deviation was consistently small. In contrast, the means and standard deviations of the relative CRLB worsened with increasing noise correlation strength for 1D-LCM (Figure 5).
Discussion
This study used an idealized, simplified scenario to study theoretical improvements in model accuracy and uncertainty estimation of 2D modeling. Future studies need to evaluate the generalizability of this synthetic framework by progressively approaching in-vivo-like conditions.It is possible that improved model precision in 2D-LCM is only achieved when information is different between transients3. In contrast, we studied an idealized conventional 1D-multi-transient experiment without between-transient modulation of the signal amplitude. While we anticipated benefit from including all noise representations (instead of just the average noise), this advantage was small. The true benefits of noise estimation with 2D-LCM may only become apparent for scenarios in which noise is, in fact, correlated as previously reported benefits from simultaneously modeling signals from different, potentially noise-correlated, receiver coils11. Our results indicate that 2D-LCM effectively separates correlated and uncorrelated noise components leading to stable CRLB estimation for all tested r values.
For both models, we found CRLBs to be reliable uncertainty estimators of the standard deviation across multiple identical measurements if SNR was reasonably high (SNR>=48). This confirms previous work9 showing that CRLBs adequately quantify aleatoric model uncertainty, although this requires perfect knowledge of the signal-generating model, which is likely compromised by poorly characterized macromolecules and lipids.
Conclusion
2D multi-transient LCM of conventional 1D-MRS data is comparable to 1D-LCM of the averaged spectrum in terms of accuracy and precision, with small benefits of uncertainty estimation for uncorrelated noise and substantial benefits for correlated noise.Acknowledgements
This work has been supported by NIH grants R00 AG062230, R21 EB033516, K99 AG080084, R01 EB016089, R01 EB023963, and P41 EB031771.References
- Ligneul C, Najac C, Döring A, et al. Diffusion-weighted MR spectroscopy: consensus, recommendations and resources from acquisition to modelling. Published online May 18, 2023. doi:10.48550/arXiv.2305.10829
- Clarke WT, Ligneul C, Cottaar M, Ip IB, Jbabdi S. Universal Dynamic Fitting of Magnetic Resonance Spectroscopy. Published online June 15, 2023:2023.06.15.544935. doi:10.1101/2023.06.15.544935
- Tal A. The future is 2D: spectral-temporal fitting of dynamic MRS data provides exponential gains in precision over conventional approaches. Magn Reson Med. 2022; doi:10.1002/mrm.29456
- Koolschijn RS, Clarke WT, Ip IB, Emir UE, Barron HC. Event-related functional magnetic resonance spectroscopy. NeuroImage. 2023;276:120194. doi:10.1016/j.neuroimage.2023.120194
- Kulpanovich A, Tal A. The application of magnetic resonance fingerprinting to single voxel proton spectroscopy. NMR Biomed. 2018;31(11):e4001. doi:10.1002/nbm.4001
- An L, Li S, Shen J. Simultaneous Determination of Metabolite Concentrations, T1 and T2 Relaxation Times. Magn Reson Med. 2017;78(6):2072-2081. doi:10.1002/mrm.26612
- Deelchand DK, Berrington A, Noeske R, et al. Across-vendor standardization of semi-LASER for single-voxel MRS at 3T. NMR Biomed. 2021;34(5):e4218. doi:10.1002/nbm.4218
- Zöllner HJ, Považan M, Hui SCN, Tapper S, Edden RAE, Oeltzschner G. Comparison of different linear-combination modeling algorithms for short-TE proton spectra. NMR Biomed. 2021;34(4):e4482. doi:https://doi.org/10.1002/nbm.4482
- Landheer K, Juchem C. Are Cramér-Rao lower bounds an accurate estimate for standard deviations in in vivo magnetic resonance spectroscopy? NMR Biomed. 2021;e4521. doi:https://doi.org/10.1002/nbm.4521
- Oeltzschner G, Zöllner HJ, Hui SCN, et al. Osprey: Open-source processing, reconstruction & estimation of magnetic resonance spectroscopy data. J Neurosci Methods. 2020;343:108827. doi:10.1016/j.jneumeth.2020.108827
- Hoefemann M, Adalid V, Kreis R. Optimizing acquisition and fitting conditions for 1H MR spectroscopy investigations in global brain pathology. NMR Biomed. 2019;32(11):e4161. doi:10.1002/nbm.4161
Figures