1856
Effect of LCModel basis set B0 frequency on MRS quantification1Radiology, University of Minnesota, Minneapolis, MN, United States
Synopsis
Keywords: Spectroscopy, Spectroscopy, LCModel
Motivation: The actual B0 resonance field of 3T scanners is different between the three major MR vendors.
Goal(s): Here, we report the effect on metabolite quantification of using basis sets at different B0 fields than the B0 frequency of the measured in vivo MRS data.
Approach: Basis sets were simulated at thirteen different B0 fields. Semi-LASER MRS data measured from the posterior cingulate cortex at 3T were fitted using LCModel.
Results: Results show that biases in metabolite concentrations were within 1% when the basis set B0 frequencies were within ±0.5 MHz from the actual scanner frequency.
Impact: A single sequence-specific basis set can be used to analyze harmonized spectroscopic data collected on clinical 3T scanners from different vendors that operate at different frequencies.
Introduction
Following the international magnetic resonance spectroscopy (MRS) consensus group recommendations1-2, the proton semi-LASER sequence was successfully standardized across the three major MR vendors3 (GE, Philips, and Siemens). All localization RF pulses patterns, durations and inter-pulse delays were matched, in addition to utilizing the same VAPOR technique for water suppression with interleaved OVS pulses. This has resulted in comparable spectral pattern between vendors in several brain regions at multiple sites. This should potentially allow pooling of multi-site/multi-vendor spectroscopic data. However, the actual B0 resonance field of 3T scanners is different between the three major MR vendors and varies between 123.2 to 127.8 MHz. As such, previous multiple-vendor and multi-sites studies3-5 have used simulated basis sets specific to each scanner when quantifying brain metabolites.So far, it is unclear whether we need basis sets simulated at slightly different frequencies for each specific magnetic field strength where the standardized semi-LASER data was collected. Therefore, the aim of the current study was to determine the effect on metabolite quantification of using basis sets at different B0 fields from the measured in vivo data.
Methods
Five healthy volunteers participated in the study after giving written informed consent approved by the Institutional Review Board at the University of Minnesota. Studies were performed with a 3T whole-body Siemens scanner. The standard body RF coil was used for radiofrequency transmission and the 32-channel phased-array Siemens head coil was used for signal reception. T1-weighted MPRAGE images were used to position the VOI in the posterior cingulate cortex (2×2×2 cm3). After FAST(EST)MAP shimming, metabolite and water reference spectra were acquired using semi-LASER (TR/TE = 5000/28 ms, 64 transients). Note that the 3T MRS data used in this study were collected for a study6 focused on test-retest reproducibility of spectroscopic data.The basis spectra consist of 19 metabolites: alanine, ascorbate, aspartate, creatine (Cr), γ-aminobutyric acid, glucose, glutamate (Glu), glutamine (Gln), glutathione, glycerophosphorylcholine, myo-inositol (Ins), scyllo-inositol, lactate, N-acetylaspartate (NAA), N-acetylaspartylglutamate (NAAG), phosphocreatine (PCr), phosphorylcholine, phosphorylethanolamine, and taurine. Thirteen basis sets were simulated ranging from -1 to 10 MHz from the nominal B0 frequency of the measured MRS data which was at 123.245 MHz. A measured macromolecule (MM) spectrum was also included. The MM data was resampled at the different frequencies and used in the appropriate basis sets.
All spectra were processed with MRspa7 and resulting averaged spectra were fitted using LCModel v6.3-1R8 with the 13 different basis sets. The fitted region was from 0.5 to 4.2 ppm and no baseline correction or filtering was applied to the processed data. Differences in concentrations relative to the fitting done with the basis set generated at the actual scanner frequency (123.245 MHz) are reported for the six major metabolites, i.e. tNAA(=NAA+NAAG), tCr(=Cr+PCr), tCho, Glu, Ins and Glx(=Glu+Gln).
Results
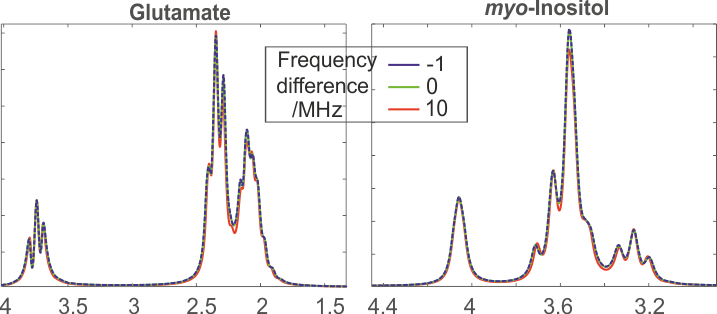
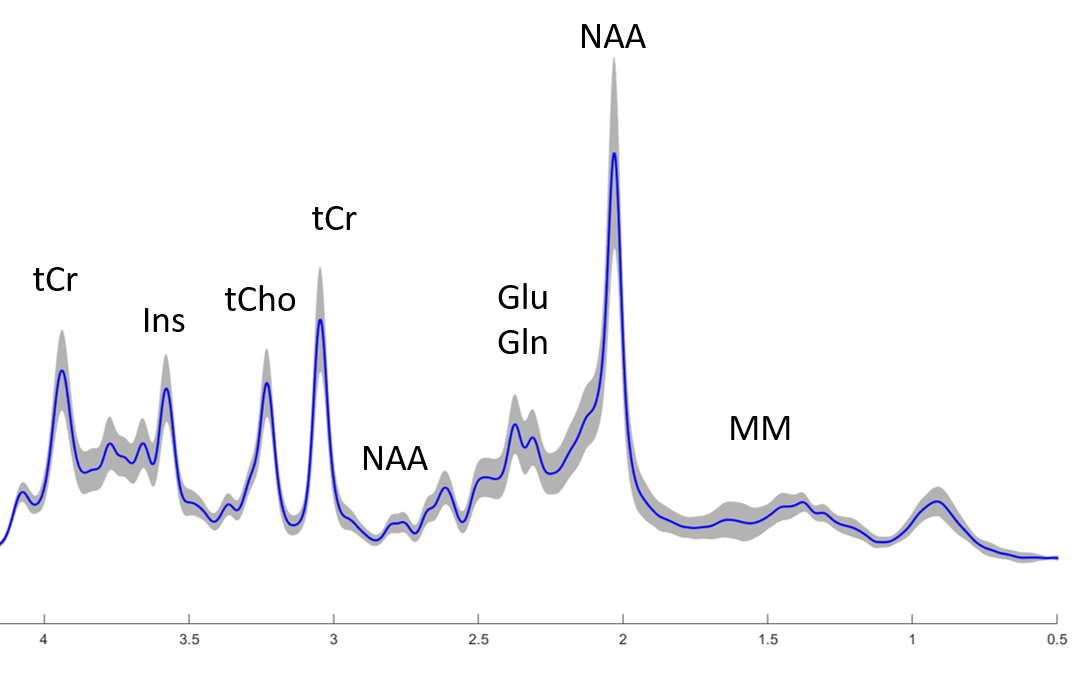
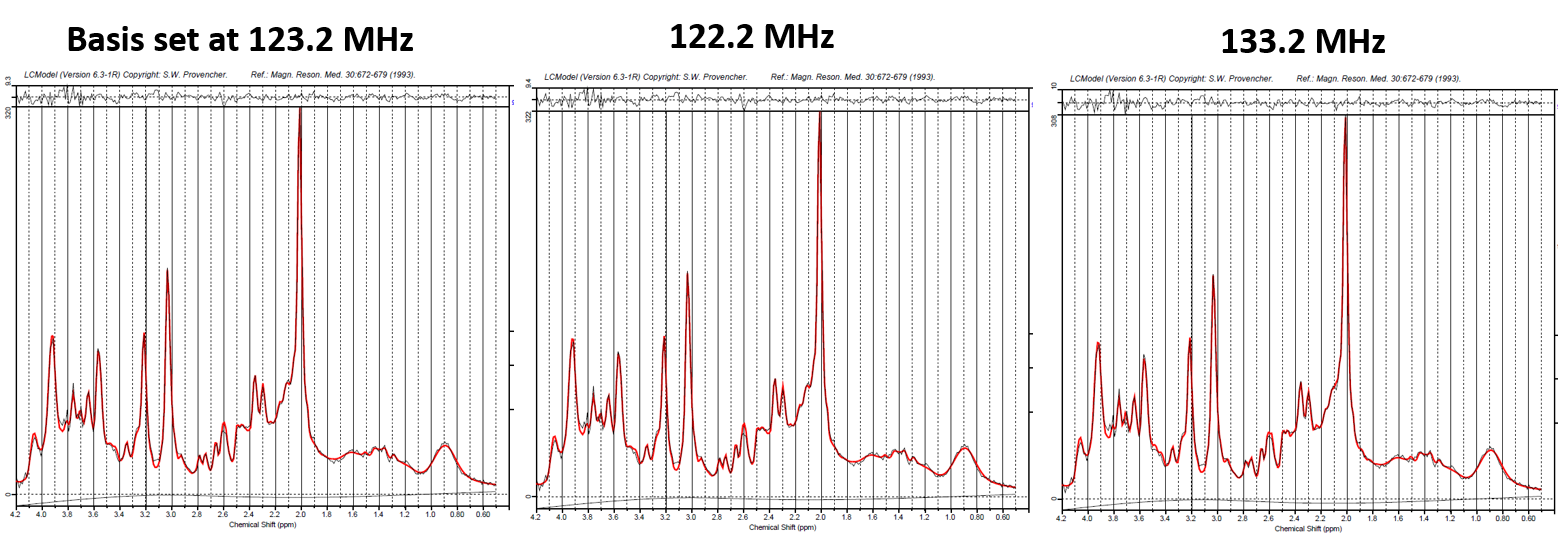
Figure 1 compares the simulated spectra of glutamate and myo-inositol at three different B0 frequencies. When the difference in B0 was within 1 MHz, the spectral difference was negligible. However, small differences in spectral pattern started to appear when the difference was 10MHz.High-quality sLASER data were measured in all subjects with no lipid or baseline issues (Figure 2). LCModel outputs from one subject using basis set at -1, 0 and 10 MHz from the actual B0 frequency of the MRS data are illustrated in Figure 3. No obvious difference in the fitted results was apparent with comparable residual and baseline in all cases even when the basis set frequency was 10 MHz off.
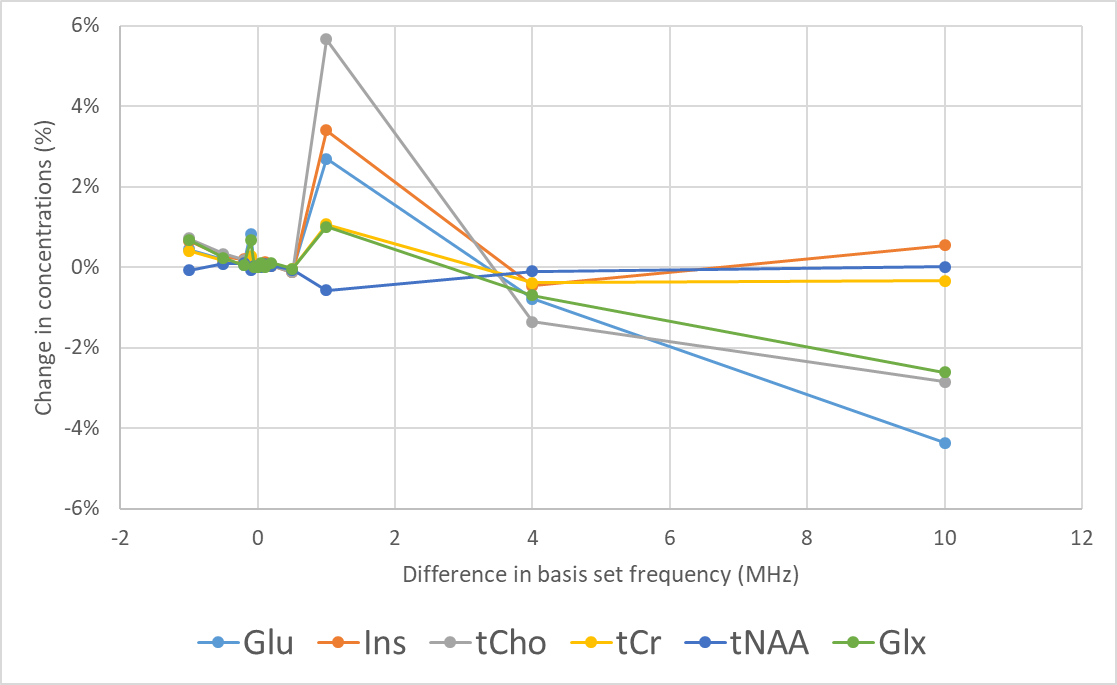
Figure 4 shows the %difference in metabolite concentrations when using basis sets with varying frequencies. When the basis set was within ±0.5MHz from the measured baseline B0 frequency, the changes were within 1% for the six metabolites. Above this frequency, the changes were >2%, except for tNAA.
Discussion and Conclusion
This study shows that the change in concentrations was less than 1% for the six metabolites (tNAA, tCr, tCho, Glu, Glx and mIns) when the B0 frequencies of the basis sets were within ±0.5 MHz of the actual B0 frequency of the measured MRS data. This observation might be explained by the fact that the line-shape regularization function in LCModel is very flexible8 such that this takes into account small changes in spectral pattern. Furthermore, the changes in concentration observed within the ±0.5 MHz are smaller than the test-retest CVs previously reported for these metabolites6.In conclusion, this study shows that it is possible to use one sequence specific basis set to fit harmonized MRS data measured at 3T scanners from different vendors since the difference in B0 frequency between scanners is within 0.5 MHz.
Acknowledgements
This work was supported by funding from the National Institutes of Health (NIH) P41 EB027061, P30 NS076408, R01 NS080816 and R01 EB030000.References
1. Öz et al. Clinical proton MR spectroscopy in central nervous system disorders Radiology. 2014 Mar;270(3):658-79.
2. Wilson et al. Methodological consensus on clinical proton MRS of the brain: Review and recommendations Magn Reson Med. 2019 Aug;82(2):527-550.
3. Deelchand et al. Across-vendor standardization of semi-LASER for single-voxel MRS at 3T NMR Biomed. 2021 May;34(5).
4. Craven et al. Comparison of seven modelling algorithms for γ-aminobutyric acid-edited proton magnetic resonance spectroscopy NMR Biomed. 2022 Jul;35(7).
5. Joers et al. Multi-site/Multi-vendor reproducibility of advanced MRS at 3T in a clinical cohort Proc. Intl. Soc. Mag. Reson. Med. 28 (2020) 2920.
6. Terpstra et al. Test-retest reproducibility of neurochemical profiles with short-echo, single-voxel MR spectroscopy at 3T and 7T Magn Reson Med. 2016 Oct;76(4):1083-91.
7. Deelchand DK. MRspa: Magnetic Resonance signal processing and analysis. https://www.cmrr.umn.edu/downloads/mrspa/
8. Provencher SW. Estimation of metabolite concentrations from localized in vivo proton NMR spectra. Magn Reson Med. 1993;30:672-679.
Figures