1854
Analysis of MRS voxel placements in brain tumors performed by MRS experts1Center for Magnetic Resonance Research, Department of Radiology, University of Minnesota, Minneapolis, MN, United States, 2Department of Radiation Oncology, University of Minnesota, Minneapolis, MN, United States, 3Paris Brain Institute, ICM, Sorbonne University, Paris, France, 4Martinos Center for Biomedical Imaging, Department of Radiology, Massachusetts General Hospital, Charlestown, MA, United States, 5Department of Neurosurgery, University of Minnesota, Minneapolis, MN, United States, 6Center for Clinical Spectroscopy, Department of Radiology, Brigham and Women’s Hospital, Harvard Medical School, Boston, MA, United States, 7ASST Spedali Civili University Hospital, Brescia, Italy, 8Department of Radiology, Radiation Oncology and Medical Physics, University of Ottawa, Ottawa, ON, Canada
Synopsis
Keywords: Spectroscopy, Spectroscopy
Motivation: There is no standardized way of prescribing MRS voxels in the lesion. This depends entirely on the MR operator’s expertise and opinion.
Goal(s): Our goal was to analyze MRS voxel placements in brain tumors for quantitatively reliable and reproducible voxel placement.
Approach: MRS experts placed voxels and visually scored their placements. Placements and scores were compared to tumor characteristics.
Results: All experts showed a tendency to place the voxels to fill approximately 30% of voxels with tumor core for different participants. The fraction of tumor core in voxels showed a correlation of 0.76 to the fraction of tumor core in the whole tumor.
Impact: Quantitative analysis of MRS voxel placement shows that MRS experts deemed a voxel properly placed when tumor core was adequately included, suggesting widely applicable and objective method of voxel placement and assessment for non-experts in clinical settings.
Introduction
Magnetic Resonance Spectroscopy (MRS) can provide critical information for prognosis of brain tumors1. Patients with isocitrate dehydrogenase (IDH) mutated glioma have 2-to-4 fold longer median survival compared with those with IDH wild-type glioma 2,3. The IDH mutation results in overproduction of D-2-hydroxyglutarate, which can be detected by MRS 4-6. Despite the potential of MRS, the clinical use of this technique is limited by its technical difficulty, including the need for expertise in single-voxel positioning7. In this study, we compared the voxel placements from five MRS experts and evaluated the positioning relative to tumor morphology.Methods
MR images from 125 glioma patients were de-identified for use in this study (University of Minnesota, n=44; University of Ottawa, n=81) Each case consisted of standard clinical T1-weighted and T2-weighted FLAIR images obtained either at 1.5 T (n=29) and 3 T (n=96). The cases were randomly divided into 5 datasets of 25 cases each. Five individuals with extensive clinical MRS experience (neuroradiologists or physicists) were recruited as MRS experts. Each expert was randomly assigned two datasets of 25 cases, so that each case was seen by two experts. Voxel placement was performed using a custom MRS localization software along with the following guidelines: (i) position the voxel in the solid portion of the tumor; (ii) avoid black holes (cysts, necrosis); (iii) rotate in one or two directions to better fit the voxel in the lesion; (iv) minimum volume 6 mL. Experts also provided a self-score for confidence in a good placement, ranging from 1 as worst to 3 as best.All images were skull stripped (HD Brain Extraction8) and an nnUNet model9 trained with the BRATS 2016 and 2017 datasets10 (n=484) was used to segment edema and tumor core from our T1-weighted and T2-weighted FLAIR images. The dice coefficient was calculated between two voxels from each expert for each case11. Pearson correlation coefficient (r) was used to assess the linear relationship between variables. Results were considered significant if the P < .05. Statistical analysis and tumor segmentation were done using Python (with SciPy and PyTorch packages) 12,13.
Results
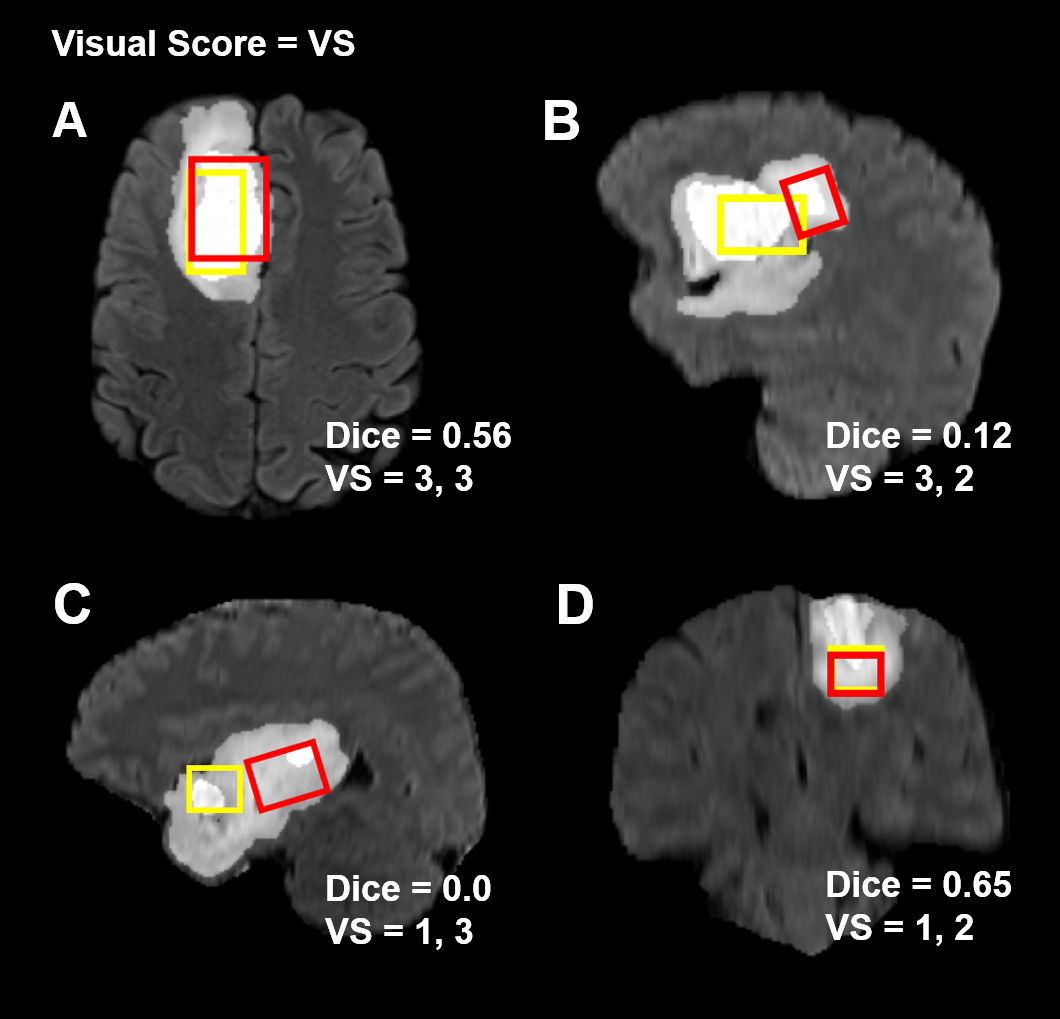
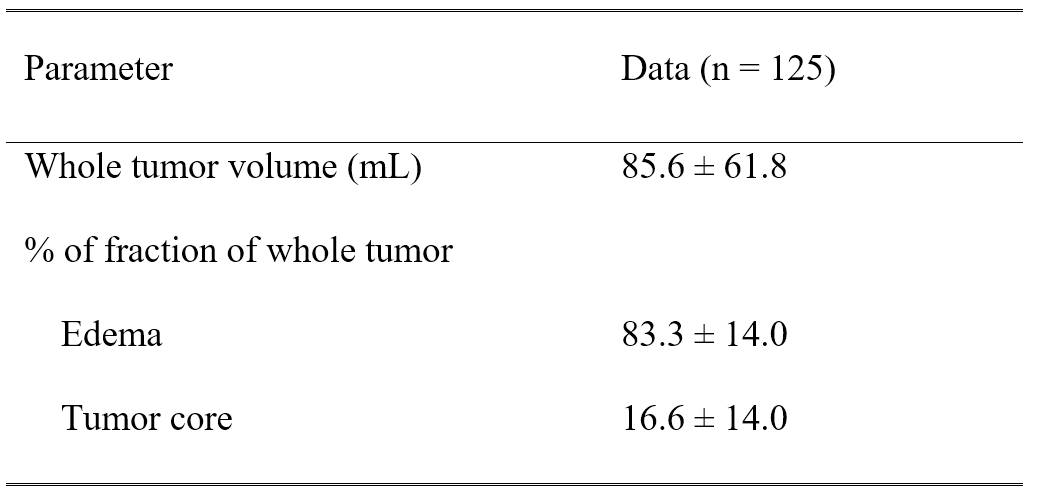
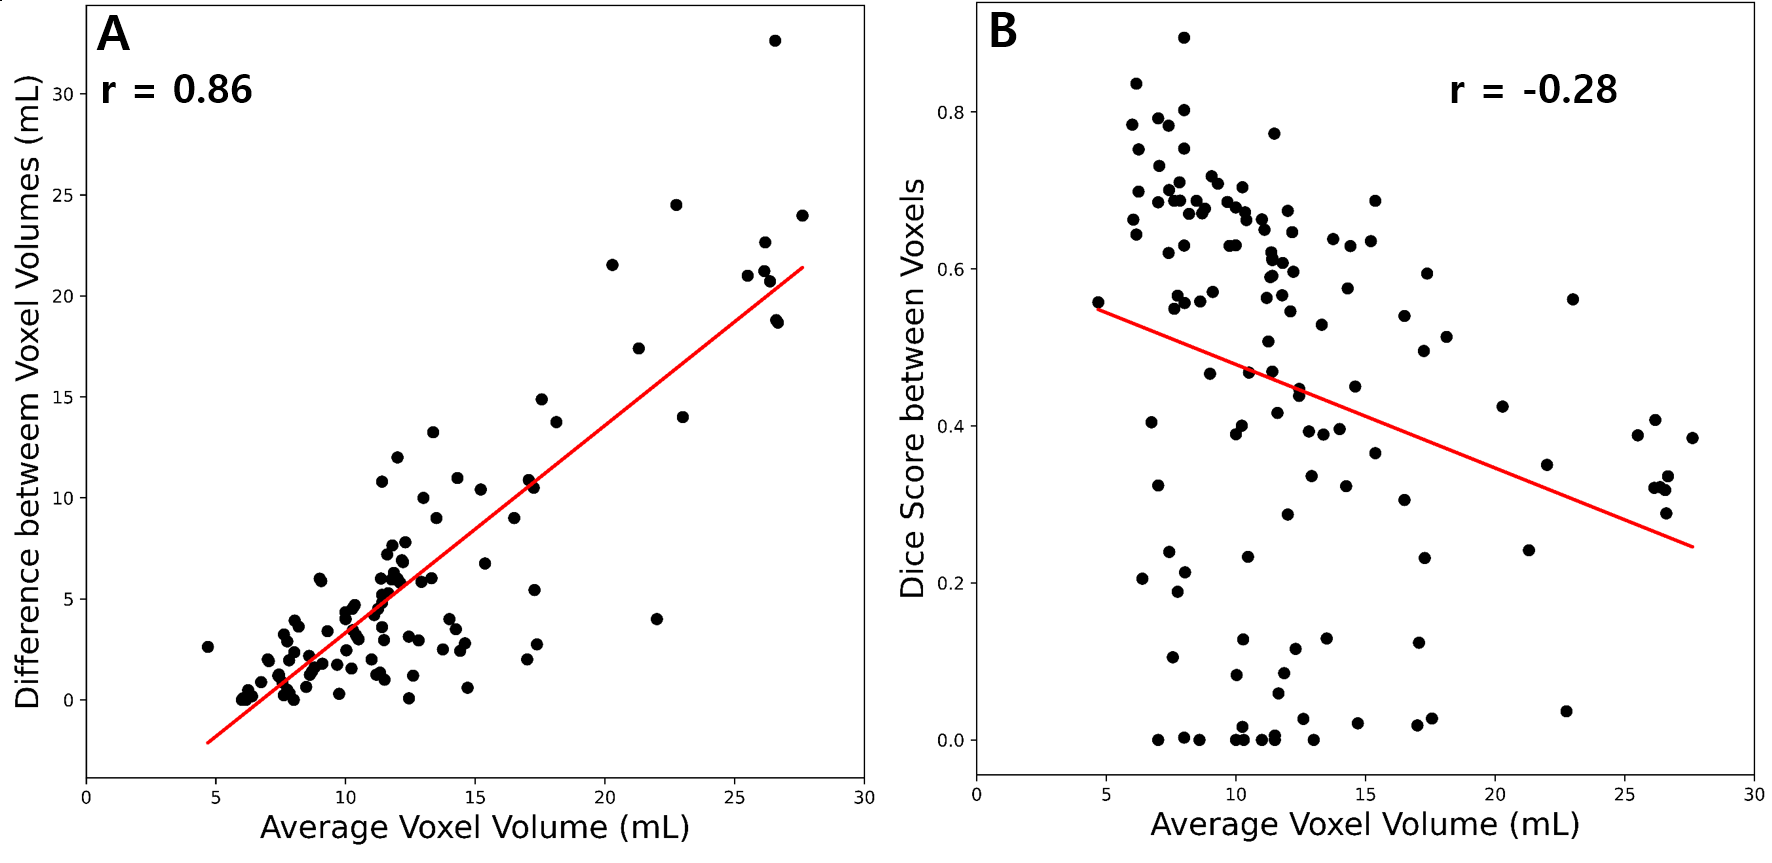
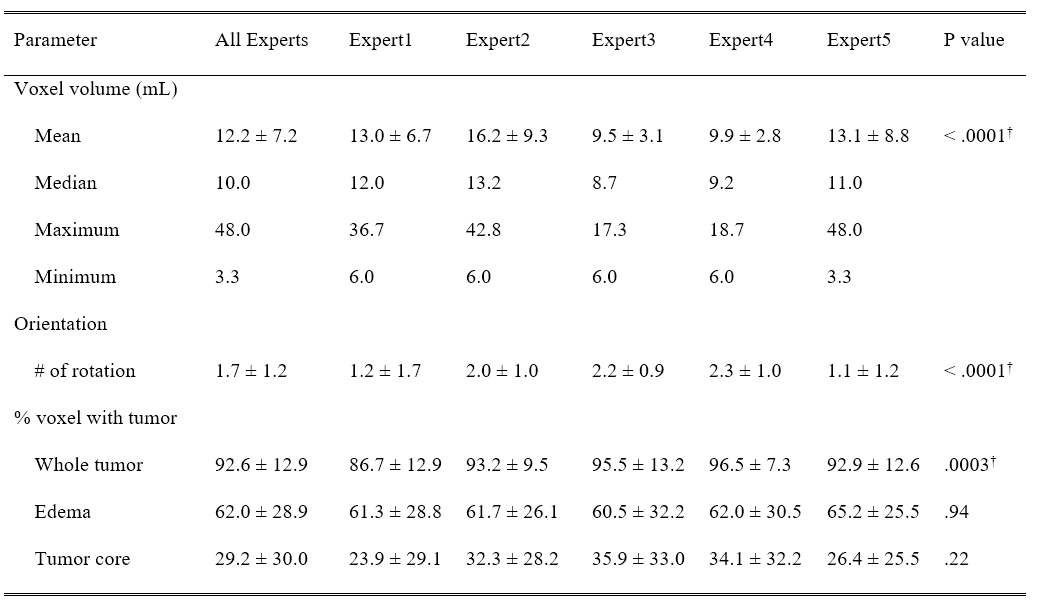
Figure 1 shows examples of voxel placements with visual scores, dice coefficients and percentage of tumor core in voxels. Segmented tumor characteristics such as whole-tumor volume and edema/tumor core fraction in whole-tumor are reported in Table 1. Dice scores were low, ranging from 0 to 0.89 with a mean 0.44 ± 0.24, while visual scores were high, with a mean score of 2.49 ± 0.47. Figure 2A-B demonstrates correlation of average voxel volumes to difference between voxel volumes (r=0.86) and dice scores (r = –0.28).Table 2 reports the characteristics of voxel placements for each expert, showing voxel volumes, the fraction (%) of the voxel that contains the whole-tumor, and numbers of rotations used by experts.
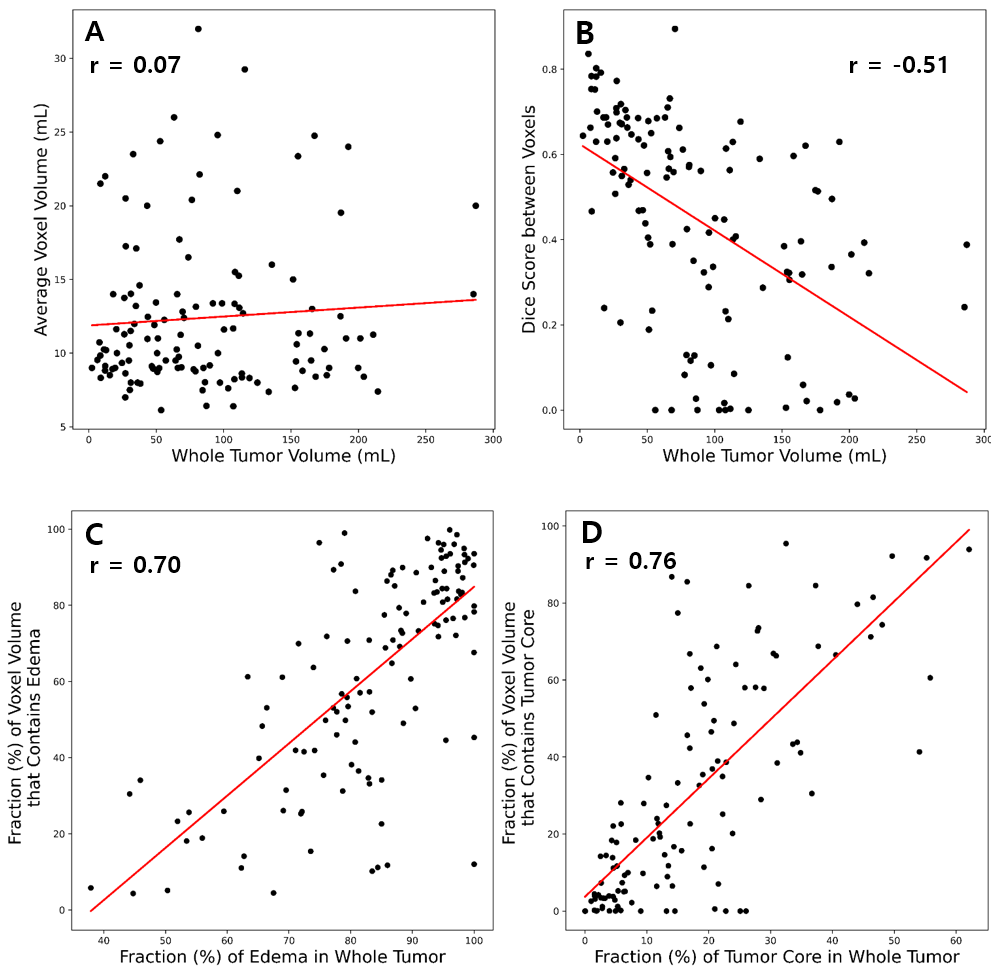
Figure 3A-B reports a poor correlation of r=0.07 between whole-tumor volume with average voxel volume and moderate correlation of r = –0.51 between whole-tumor volume and dice score. Figure 3C-D reports a strong and moderate correlation between the fraction of tumor core and edema in the whole-tumor compared to the fraction of tumor core (r=0.76) and edema (r=0.70) in the voxel, respectively. Table 2 shows there is no evidence of difference between fraction of edema (p=0.94) and tumor core (p=0.22) in voxels among the experts.
Discussion
Voxel placements from different experts had a low average dice score of 0.44 while voxels were visually considered between “Best” and “Fair” by experts. Whole-tumor volume did not affect the voxel volume and dice score decreased as whole-tumor volume increased, which indicates experts placed voxels in different locations in bigger tumors. Tumor morphologies such as edema and tumor core in the whole-tumor were consistently reflected in voxel placements. All experts showed a tendency to place the voxels to fill approximately 30% of voxels with tumor core. Given that the average tumor core volume was 16.6% of the whole-tumor, experts maximized the contribution of tumor core in their voxels while following the guidelines. Experts were also able to contain more tumor core volume in voxels as tumor core volume in whole-tumor increased (r=0.76). Their confidence also tended to increase with greater inclusion of tumor core. The examples in Figure 1 support this trend that placements with high tumor core content (e.g., Fig 1A) received better confidence scores then those with low tumor core fraction (Fig 1D).Conclusion
We found that the voxels placed by experts were approximately 30% filled with tumor core. Experts included more of tumor cores in the voxels as fraction of tumor core in the whole-tumor increased.Acknowledgements
Authors would like to thank Sarah Bedell, Noam Harel, and Henry Braun for help with the de-identification of images. This work was sponsored by the NIH grants: U01CA269110, R01EB034231, P41 EB027061, and P30 NS076408. TBN was sponsored by Bayer HealthCare/RSNA Research Seed Grant and Cancer Research Society. FB acknowledges support from Investissements d’avenir [grant number ANR-10-IAIHU-06 and ANR-11-INBS-0006] and from Agence Nationale de la Recherche [grant number ANR-20-CE17-0002-01].References
[1] Choi C, Raisanen JM, Ganji SK, et al. Prospective longitudinal analysis of 2-hydroxyglutarate magnetic resonance spectroscopy identifies broad clinical utility for the management of patients with IDH-mutant glioma. Journal of Clinical Oncology. 2016; 34(33): 4030-4039 [2] Tanaka K, Sasayama T, Mizukawa K, et al. Combined IDH1 mutation and MGMT methylation status on long-term survival of patients with cerebral low-grade glioma. Clin Neurol Neurosurg. 2015; 138: 37-44 [3] Yah H, Parsons DW, Jin G, et al. IDH1 and IDH2 Mutations in Gliomas. N Engl J Med. 2009; 19;360(8): 765-73 [4] Choi C, Ganji SK, DeBerardinis RJ, et al. 2-hydroxyglutarate detection by magnetic resonance spectroscopy in IDH-mutated glioma patients. Nat Med. 2012; 18(4): 624-9 [5] Andronesi OC, Kim GS, Gerstner E, et al. Detection of 2-hydroxyglutarate in IDH-mutated glioma patients by in vivo spectral-editing and 2D correlation magnetic resonance spectroscopy. Sci Transl Med. 2012;4(116): 116 [6] Pope WB, Prins RM, Albert TM, et al. Noninvasive detection of 2-hydroxyglutarate and other metabolites in IDH1 mutant glioma patients using magnetic resonance spectroscopy. J Neuro Oncol 2012; 107: 197–205. [7] Bolan PJ, Branzoli F, Di Stefano AL, et al. Automated Acquisition Planning for Magnetic Resonance Spectroscopy in Brain Cancer. Medical Image Computing and Computer-Assisted Intervention. 2020; 12267, 730. [8] Isensee F, Schell M, Tursunova I, et al. Automated brain extraction of multi-sequence MRI using artificial neural networks. Hum Brain Mapp. 2019; 1–13 [9] Isensee F, Jaeger, PF, Kohl, SA, et al. nnU-Net: a self-configuring method for deep learning-based biomedical image segmentation. Nature methods. 2021; 18(2), 203-211 [10] Menze BH, Jakab A, Bauer S, et al. The Multimodal Brain Tumor Image Segmentation Benchmark (BRATS). IEE Trans Med Imaging. 2015; 34(10): 1993-224 [11] Zou KH, Warfield SK, Bharatha A, et al. Statistical Validation of Image Segmentation Quality Based on a Spatial Overlap Index. Academic Radiology. 2004; 11(2): 178-189 [12] Paszke A, Gross S, Massa F, et al. PyTorch: An Imperative Style, High-Performance Deep Learning Library. NeurIPS. 2019 [13] Virtanen P, Gommers R, Oliphant TE, et al. SciPy 1.0: fundamental algorithms for scientific computing in Python. Nat. Methods. 2020; 17:261–272Figures