1853
The Goldilocks zone for 3T MRS studies using semi-LASER: Determining the optimal balance between repetition time and scan time using FSL-MRS1Physics and Astronomy, University of British Columbia, Vancouver, BC, Canada, 2International Collaboration on Repair Discoveries (ICORD), University of British Columbia, Vancouver, BC, Canada, 3Radiology, University of British Columbia, Vancouver, BC, Canada, 4UBC MRI Research Centre, University of British Columbia, Vancouver, BC, Canada, 5Philips Canada, Mississauga, ON, Canada, 6Pathology and Laboratory Medicine, University of British Columbia, Vancouver, BC, Canada
Synopsis
Keywords: Spectroscopy, Spectroscopy, MRS, T1 weighting, FSL-MRS, repetition time, TR, semi-LASER, 3T, metabolite concentration, brain, grey matter
Motivation: A short TR is often used in clinical MRS brain studies, leading to T1-weighting of metabolites and inaccurate T1 correction.
Goal(s): To determine the optimal balance between scan time and TR that minimizes T1-weighting effects when using semi-LASER MRS.
Approach: SNR and metabolite concentrations were compared for TRs of 2, 5 and 8s using FSL-MRS.
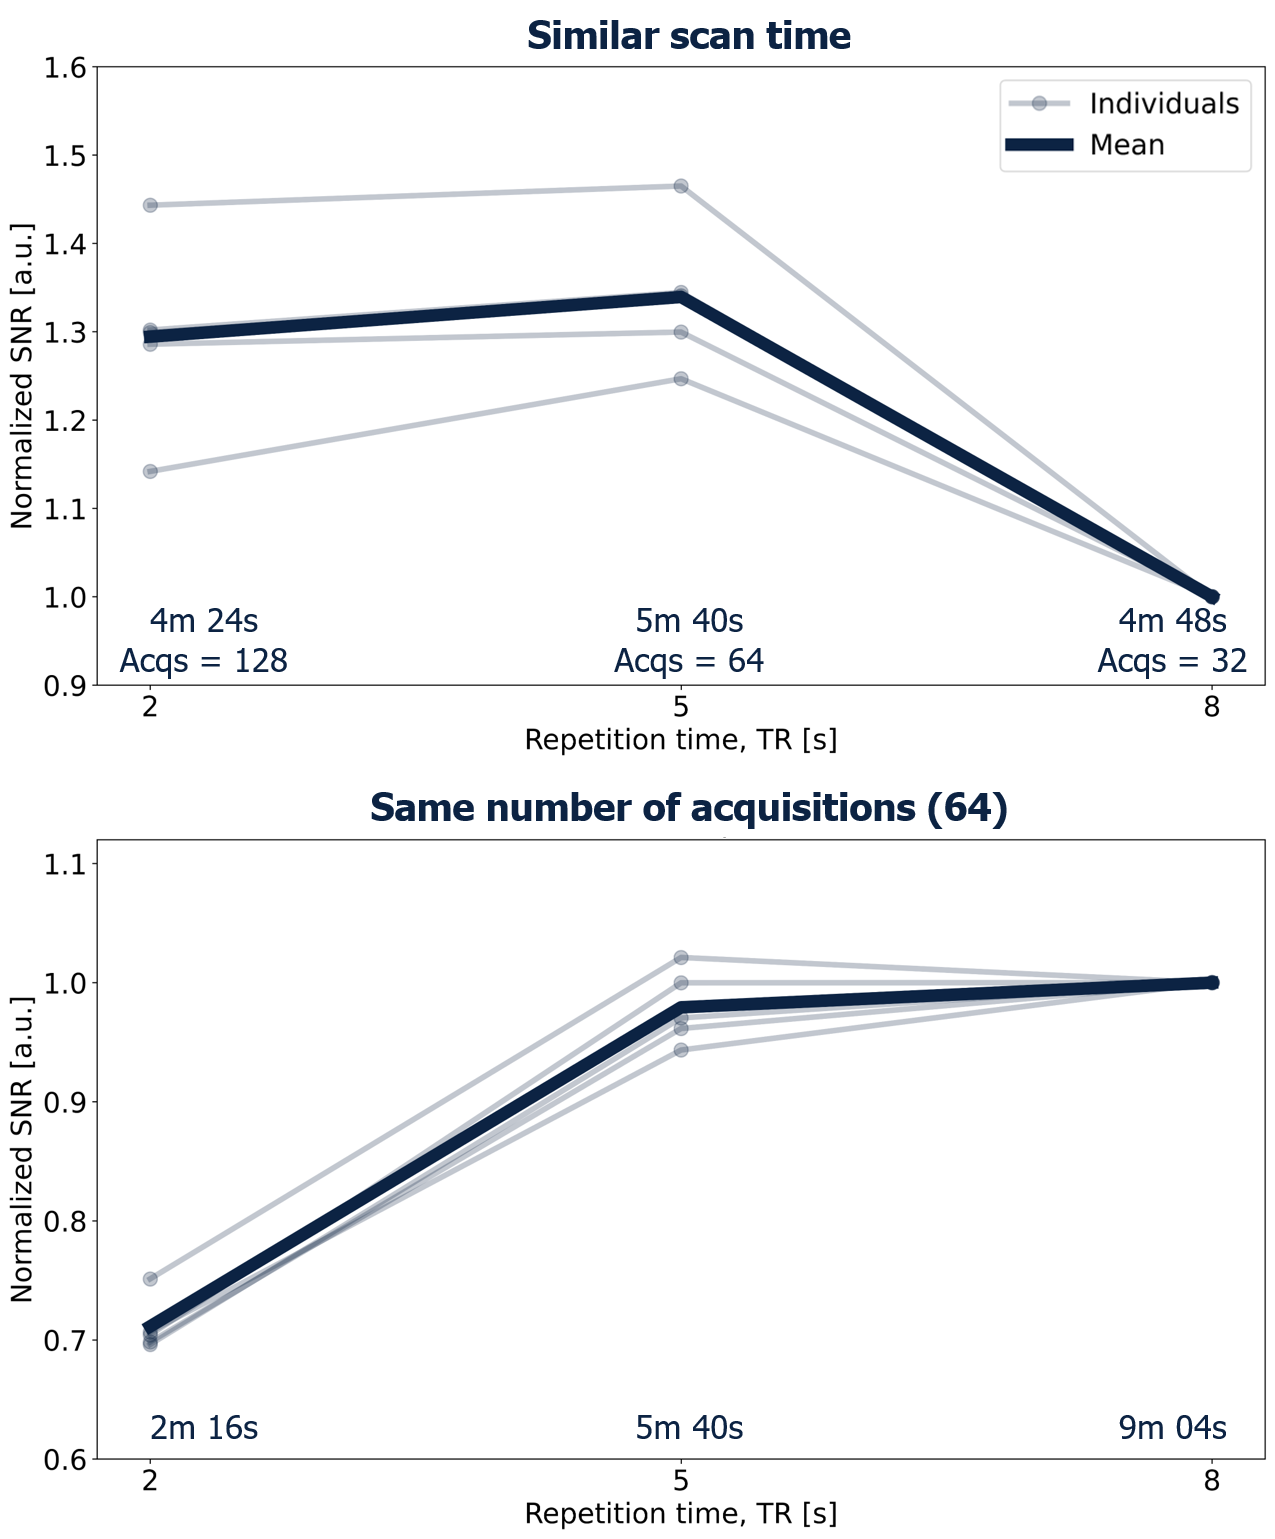
Results: A TR of 5s provides a good balance of scan time, SNR and signal recovery. For a similar scan time, TR of 2s leads to incomplete signal recovery and thus heavy T1 weighting, while a TR of 8s results in complete signal recovery but reduced SNR.
Impact: For MRS studies using semi-LASER, our work informs scientists and clinicians on the issues of using a short TR, and recommends the optimal scan parameters to use while implementing the newly available FSL-MRS analysis package.
Introduction
To reduce scan time, 1H-MRS studies often use a short repetition time (TR)1-4 to increase the signal to noise ratio (SNR) with more acquisitions. However, this leads to significant T1-weighting effects on metabolite concentrations at 3T, where T1 relaxation times are longer than at 1.5T5,6. Some methods have been proposed on how to correct for these T1 effects, but they rely on literature-reported metabolite T1s which typically have large uncertainty6-8. Additionally, T1 times are only reported for metabolites with high SNR, are largely unavailable for metabolites with low SNR, and do not span all brain regions9, ages, pathologies and MR field strengths. Therefore, accurate T1-weighting correction of all metabolites is nearly impossible.Our goal was to determine the optimal balance between scan time and TR that minimizes T1-weighting effects when using semi-LASER10 MRS and the newly developed MRS analysis software by FSL (FSL-MRS11).
Methods
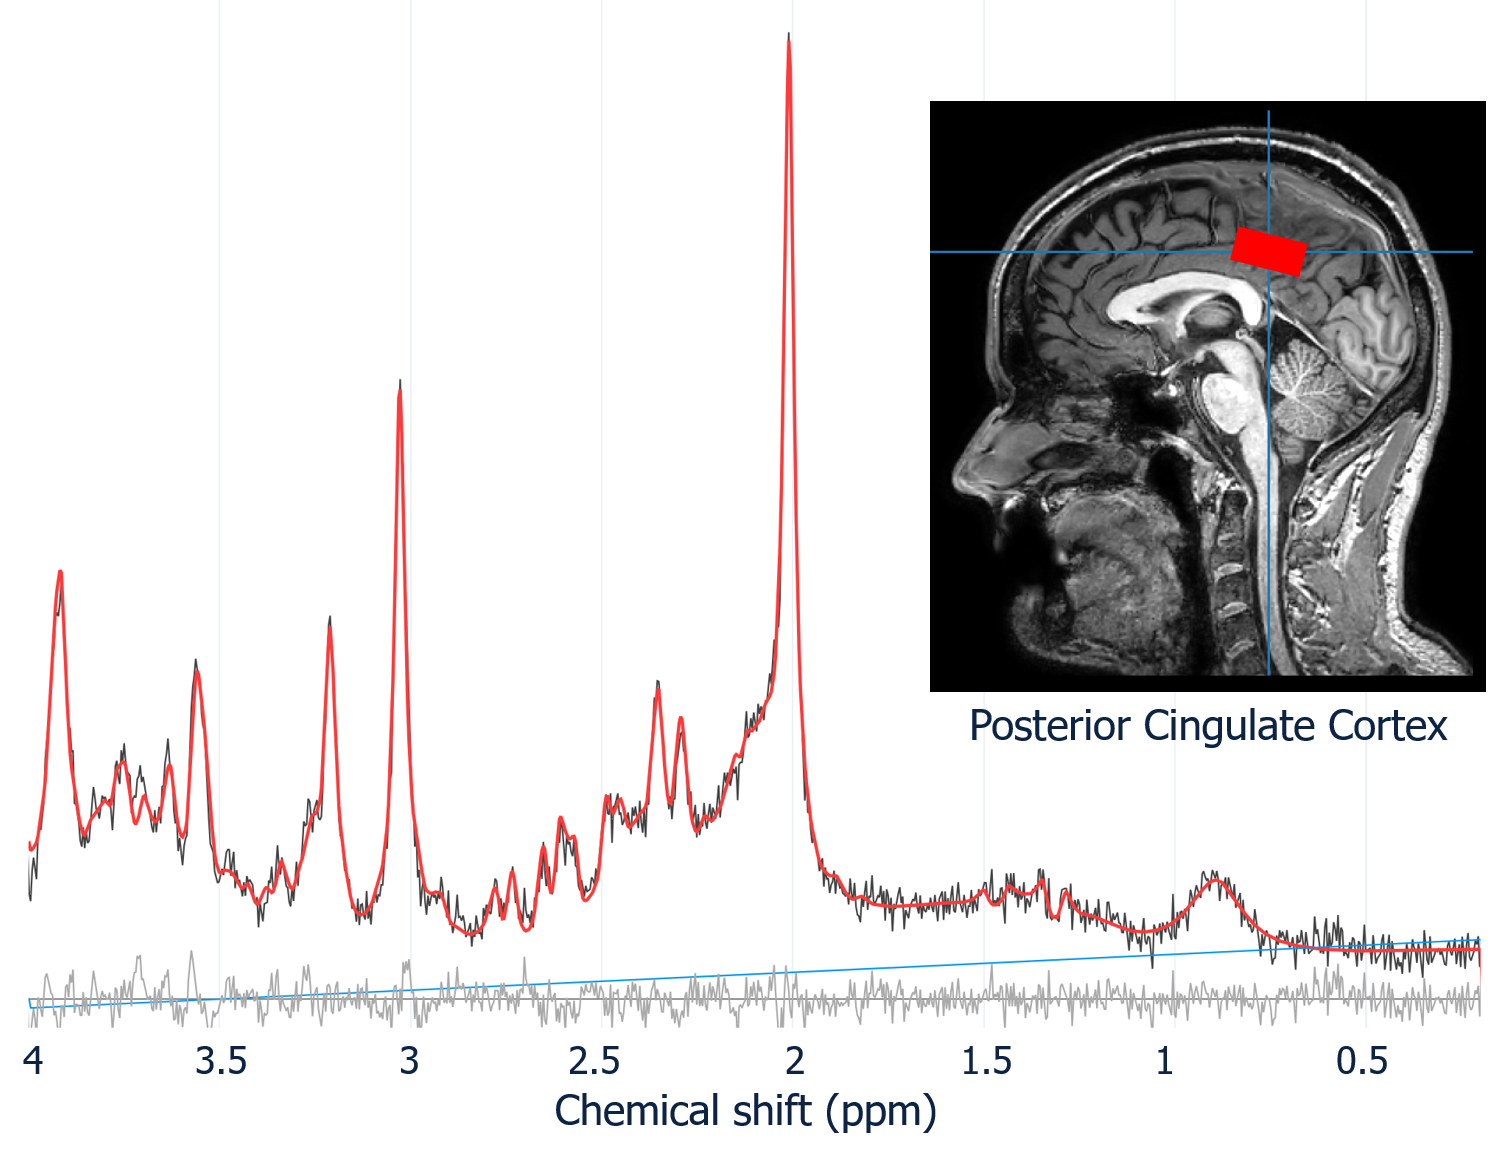
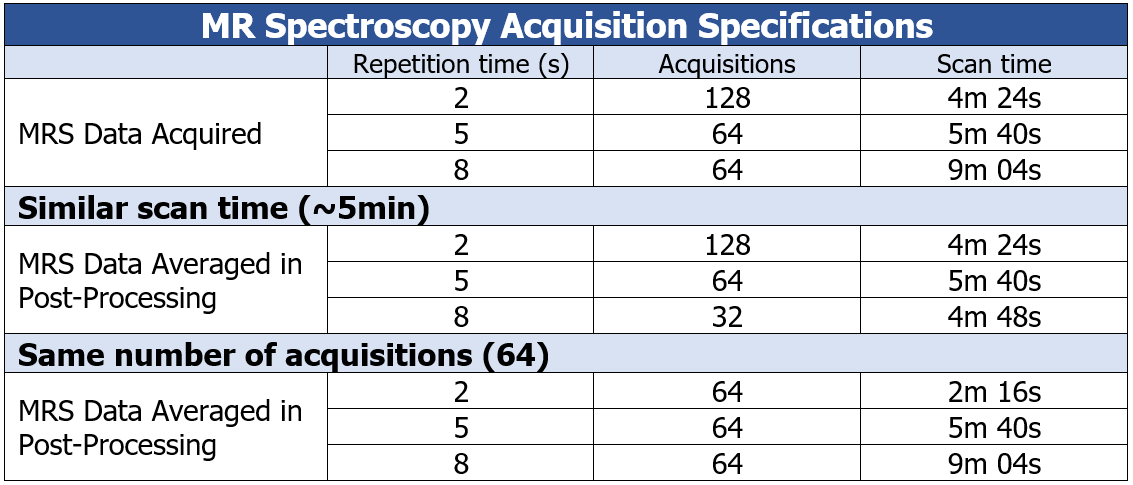
Data collection: Data was collected in 5 healthy volunteers (2M/3F, mean age: 25±2 years) at 3T (Philips Ingenia Elition X, 32-channel head coil). The MRI protocol included a 3D-T1w scan and 1H-MRS (semi-LASER, 7.8cm3 voxel, posterior cingulate cortex, Fig.1). The TR and number of acquisitions were varied (Fig.2). Individual transients were exported to enable post-processing comparisons of similar scan times (in multiples of 32 phase cycle steps12), and same number of acquisitions.Data analysis: 3DT1’s were segmented using FSL FAST13. The semi-LASER basis set was simulated using FID-A14. Processing, fitting and quantification of data was completed using FSL-MRS (v2.1.12)11, involving frequency alignment, eddy current correction, phase correction and water removal via HLSVD. Metabolite T1 and T2 parameters were changed to 0.001 and 100.0, respectively, to remove any relaxation corrections. Fig.1 shows an example spectrum with fit. SNR and metabolite concentrations from FSL-MRS were compared for the cases of similar scan times and same number of acquisitions.
Results
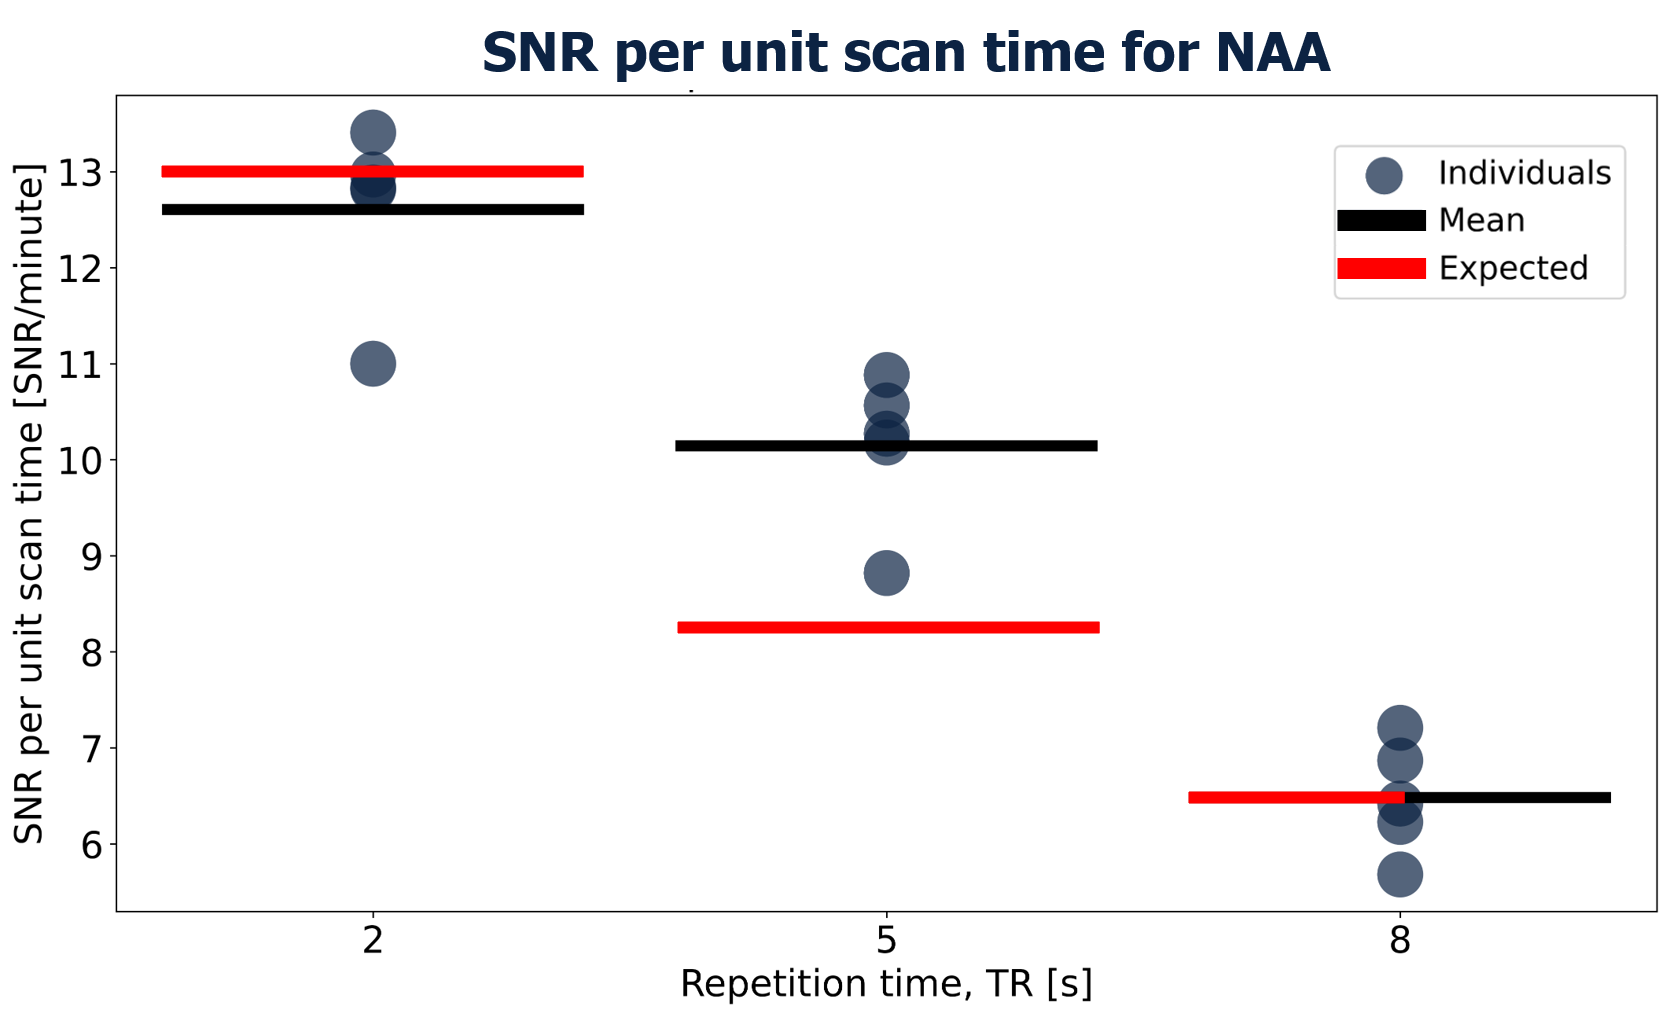
Fig.3 demonstrates the effect of TR on SNR for the brain metabolite n-acetyl-aspartate (NAA), where all SNR values were normalized to TR=8s (~99% relaxed). Average SNR is reported along with each individuals’ SNR. For similar scan times, SNR at TR=2s was 29% larger than SNR at TR=8s, similar to SNR at TR=5s which was 34% larger than at TR=8s. For constant number of acquisitions, SNR at TR=2s was 29% less than SNR at TR=8s, while SNR at TR=5s was only 2% lower than at TR=8s.Fig.4 evaluates the SNR per unit scan time (shown in grey). Using TR=8s as a reference, the expected SNR per scan time was calculated for TR=2s and 5s, shown in red. At TR=5s, the measured SNR/minute was larger than expected.
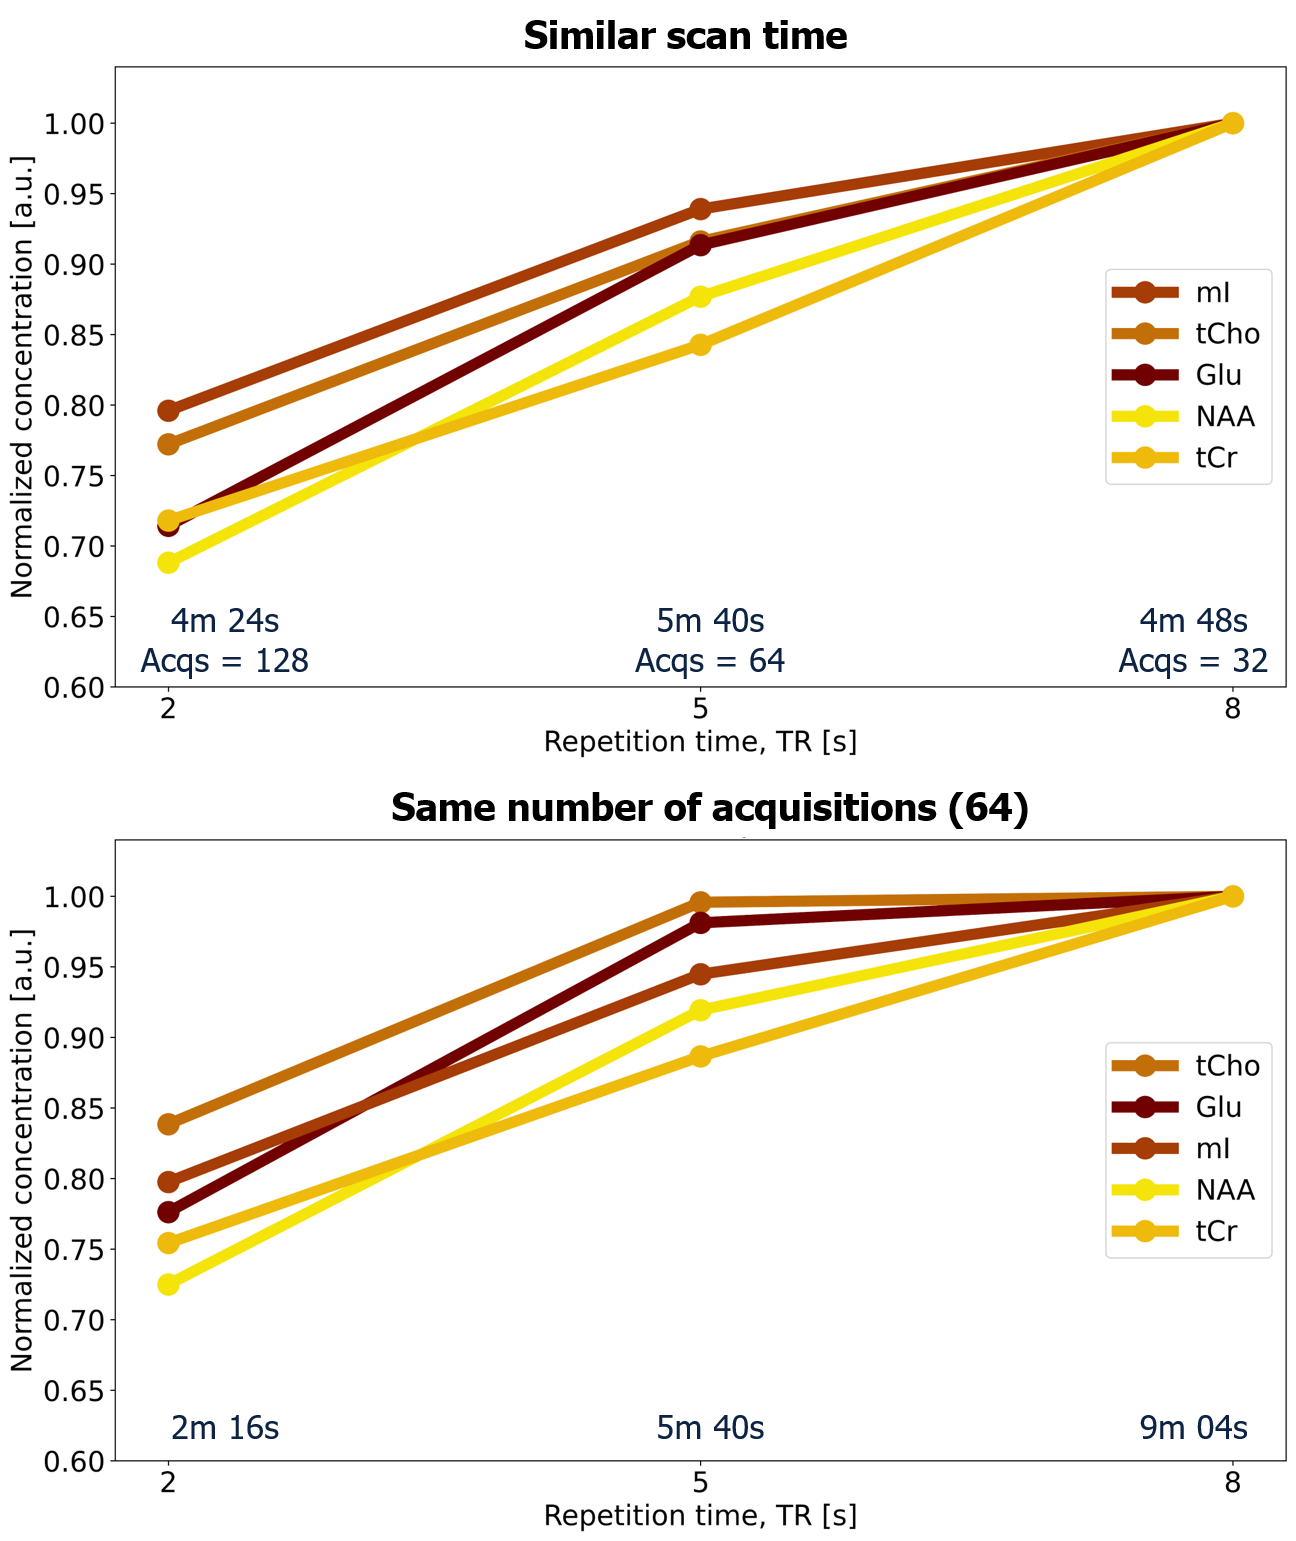
Fig.5 demonstrates the trends of average metabolite concentrations for five metabolites (NAA, total creatine (tCr), total choline (tCho), myoinositol (mI) and glutamate (Glu)) normalized to TR=8s. Metabolite concentrations were 15-30% lower at TR=2s than at TR=8s, while they were only 10-15% lower at TR=5s.
Discussion
1H-MRS measured with a clinically feasible scan time and a TR=5s demonstrated a similar SNR as spectra measured with TR=2s, and achieved the optimal SNR per unit time as compared to TR=2s or 8s. While there is more SNR/minute for TR=2s, it underperforms compared to TR=5s due to T1-weighting effects. In addition, spectra measured with TR=2s need to be corrected for T1 relaxation, however the metabolite T1 times are not known for every metabolite, brain region, age and condition. Based on our results, TR=5s appears to improve the balance between T1 relaxation and scan time compared to TR=2s at 3T.
We used TR=8s as a reference for full relaxation. However, TR=8s underperforms in SNR because of too few acquisitions in 5min, and also a reduced gain in SNR/time as magnetization recovery approaches thermal equilibrium. Participant motion during long scan times can also reduce SNR. Comparing the SNR for the same number of acquisitions demonstrates that most of the signal has recovered after TR=5s (95%) compared to TR=8s (theoretically 99% recovery for a T1=1.5s).
The change in metabolite concentrations across TRs demonstrate the effects of T1 weighting on metabolites when using short TRs, resulting in an underestimation of the true concentration. The amount of T1-weighting varies greatly depending on the T1 time of each metabolite. Using a longer TR avoids these issues and leads to greater reproducibility between 1H-MRS studies.
Conclusion
Using semi-LASER MRS brain acquisition at 3T and FSL-MRS analysis, a TR=2s does not provide the optimal balance between metabolite relaxation and scan time, despite popular belief. Instead, with a longer TR=5s, one can achieve a more quantitative measurement of metabolite concentration without T1-weighting or the need for corrections based on generic assumptions.Acknowledgements
AE extends appreciation to MS Canada for a Doctoral Studentship Award. CL and PK gratefully acknowledge funding from the NSERC Discovery grants program. ELM received salary support from Philips Canada. This work was conducted on the traditional, ancestral, and unceded territories of Coast Salish Peoples, including the territories of the xwməθkwəy̓əm (Musqueam), Skwxwú7mesh (Squamish), Stó:lō and Səl̓ílwətaʔ/Selilwitulh (Tsleil- Waututh) Nations.
References
1. Landheer K, Gajdošík M, Juchem C. A semi-LASER, single-voxel spectroscopic sequence with a minimal echo time of 20.1 ms in the human brain at 3 T. NMR Biomed. 2020;33(9):1-12. doi:10.1002/nbm.4324
2. Camicioli RM, Korzan JR, Foster SL, et al. Posterior cingulate metabolic changes occur in Parkinson’s disease patients without dementia. Neurosci Lett. 2004;354(3):177-180. doi:10.1016/j.neulet.2003.09.076
3. Kirov II, Liu S, Tal A, et al. Proton MR spectroscopy of lesion evolution in multiple sclerosis: Steady-state metabolism and its relationship to conventional imaging. Hum Brain Mapp. 2017;38(8):4047-4063. doi:10.1002/hbm.23647
4. G. Hale Hatay, E. Ozturk-Isik, Optimized Multi-Voxel TE-Averaged PRESS for Glutamate Detection in the Human Brain at 3T, Journal of Magnetic Resonance (2023), doi: https://doi.org/10.1016/j.jmr.2023.107574
5. Li Y. T1 and T2 Metabolite Relaxation Times in Normal Brain at 3T and 7T. J Mol Imaging Dyn. 2013;02(02):1-5. doi:10.4172/2155-9937.s1-002
6. Ethofer T, Mader I, Seeger U, et al. Comparison of Longitudinal Metabolite Relaxation Times in Different Regions of the Human Brain at 1.5 and 3 Tesla. Magn Reson Med. 2003;50(6):1296-1301. doi:10.1002/mrm.10640
7. Träber F, Block W, Lamerichs R, Gieseke J, Schild HH. 1H Metabolite Relaxation Times at 3.0 Tesla: Measurements of T1 and T2 Values in Normal Brain and Determination of Regional Differences in Transverse Relaxation. J Magn Reson Imaging. 2004;19(5):537-545. doi:10.1002/jmri.20053
8. Knight-Scott J, Brennan P, Palasis S, Zhong X. Effect of repetition time on metabolite quantification in the human brain in 1H MR spectroscopy at 3 tesla. J Magn Reson Imaging. 2017;45(3):710-721. doi:10.1002/jmri.25403
9. Sporn L, MacMillan EL, Ge R, Greenway K, Vila-Rodriguez F, Laule C. Longer Repetition Time Proton MR Spectroscopy Shows Increasing Hippocampal and Parahippocampal Metabolite Concentrations with Aging. J Neuroimaging. 2019;29(5):592-597. doi:10.1111/jon.12648
10. Öz G, Deelchand DK, Wijnen JP, et al. Advanced single voxel 1H magnetic resonance spectroscopy techniques in humans: Experts’ consensus recommendations. NMR Biomed. 2021;34(5):1-18. doi:10.1002/nbm.4236
11. Clarke WT, Stagg CJ, Jbabdi S. FSL-MRS: An end-to-end spectroscopy analysis package. Magnetic Resonance in Medicine 2021;85:2950–2964 doi: 10.1002/mrm.28630.
12. Deelchand DK, Berrington A, Noeske R, et al. Across-vendor standardization of semi-LASER for single-voxel MRS at 3T. NMR Biomed. 2021;34(5):1-11. doi:10.1002/nbm.4218
13. Zhang, Y; Brady, M; Smith S. Segmentation of brain MR images through a hidden Markov random field model and the Expectation-Maximization Algorithm. IEEE Trans Med Imaging. 2001;20(1):45-57.
14. Simpson R, Devenyi GA, Jezzard P, Hennessy TJ, Near J. Advanced processing and simulation of MRS data using the FID appliance (FID-A)—An open source, MATLAB-based toolkit. Magn Reson Med. 2017;77(1):23-33. doi:10.1002/mrm.26091
Figures