1852
Longitudinal reproducibility of 3D-FID-CRT-MRSI in the human brain at 3T and 7T1Centre for Advanced Imaging, The University of Queensland, Brisbane, Australia, 2ARC Training Centre for Innovation in Biomedical Imaging Technology (CIBIT), The University of Queensland, Brisbane, Australia, 3School of Electrical Engineering and Computer Science, The University of Queensland, Brisbane, Australia, 4High-field MR Centre, Department of Biomedical Imaging and Image-guided Therapy, Medical University of Vienna, Vienna, Austria
Synopsis
Keywords: Spectroscopy, Spectroscopy, 3D-FID-CRT-MRSI, 3T and 7T, Longitudinal Reproducibility, High-Field MRI, Ultrahigh-Field MRI, Magnetic Resonance Spectroscopy Imaging
Motivation: A direct comparison of the longitudinal reproducibility of 3D FID-CRT-MRSI across 3T and 7T has not been performed.
Goal(s): The aim was to determine the consistency of MRSI across these two field strengths in different brain regions.
Approach: The same subjects were scanned twice within a week at both fields and intra-subject and inter-subject Coefficients of Variation (CV%) for three metabolite ratios in different brain regions were calculated.
Results: The study found high reproducibility (CVs for most ROIs <10%) for both fields. 3T can provide sufficiently reproducible results by using larger voxel sizes and shorter measurement times.
Impact: The results will impact researchers and clinicians using MRSI, providing them with a reproducible technique at a clinical field strength of 3Tand7T and can be a method for those focusing on larger brain regions or longitudinal monitoring of metabolite changes.
Introduction
Concentric ring trajectory-based free induction decay magnetic resonance spectroscopic imaging (FID-CRT-MRSI) is a non-invasive imaging technique capable of generating high-resolution maps of various metabolites across the whole brain within reasonable timeframes on both 3T and 7T MRI[1]. Previous studies have explored the reproducibility of this technique [2, 3], but direct test-retest of MRSI across 3T and 7T has not been performed, which is vital for validation of the technique. We also investigated if the reproducibility at 3T - a clinical scanner - is comparable to 7T, considering the improved SNR and spectral resolution at 7T[4].Method
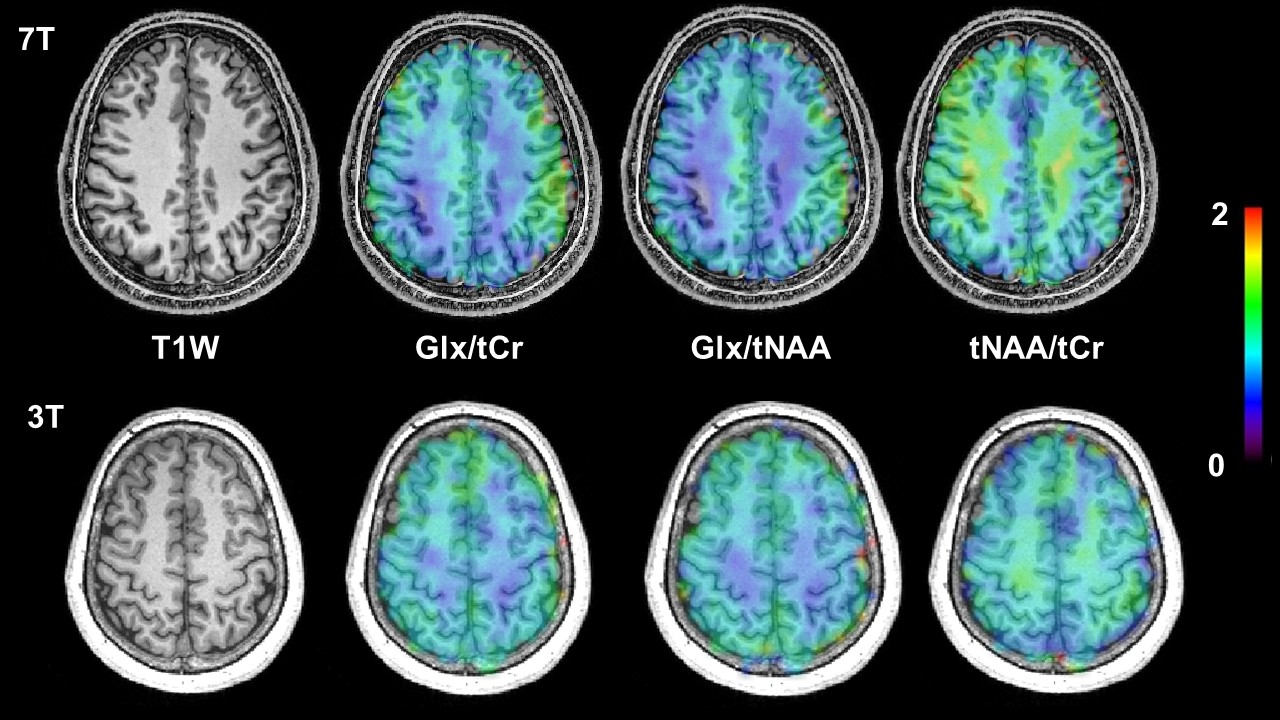
We conducted two scan sessions, 5-9 days apart, on five healthy participants (three female, age: 25-33). The scans were performed using a 7T research scanner (Siemens MAGNETOM) with a 1Tx/32 Rx head coil (Nova Medical) and a 3T scanner (Siemens Prisma) with a 64-channel coil. A 3D T1-weighted MP2RAGE was used for positioning the MRSI volume. The protocol included B1+ maps for flip-angle optimization at 7T, an automated localizer and the interleaved volumetric navigator sequence for real-time motion and shim correction at 3T[5], and 1st and 2nd order B0-shimming over the MRSI slab with 60 mm thickness. 3D-FID-MRSI parameters 3T: FOV=220x220x110 mm3, matrix size=32x32x21 voxels, isotropic voxels of 6.3 mm, TR=950 ms, acquisition delay=0.8 ms, scan time=4:14 min; 7T: same FOV, matrix size=64x64x31 voxels, isotropic voxels of 3.4 mm, TR=460 ms, acquisition delay=1.3 ms, total scan time of 11:30 min. MRSI post-processing was done with spectroscopic quantification performed in LCModel (basis set of 15 metabolites [Figure 1])[6] . Ratio maps were overlayed with segmentations of the T1w images using Fastsurfer[7]. Segmentations resulted in 12 grey matter (GM) regions and one white matter (WM) ROI. We report on three important metabolite ratios relevant for neurodegenerative diseases: NAA/tCr, Glx/tCr, and Glx/tNAA. Mean concentration values ±SD were calculated for each ROI at both field-strengths. For each subject, the intra-subject Coefficient of Variation (CV%) was determined by dividing the SD by the mean between sessions. An inter-subject CV% was obtained by averaging the intra-subject CVs% for each ratio map. The mean±SD SNR of Total Creatine (tCr) was also calculated for the WM and over all GM ROIs for both field strengths.Results
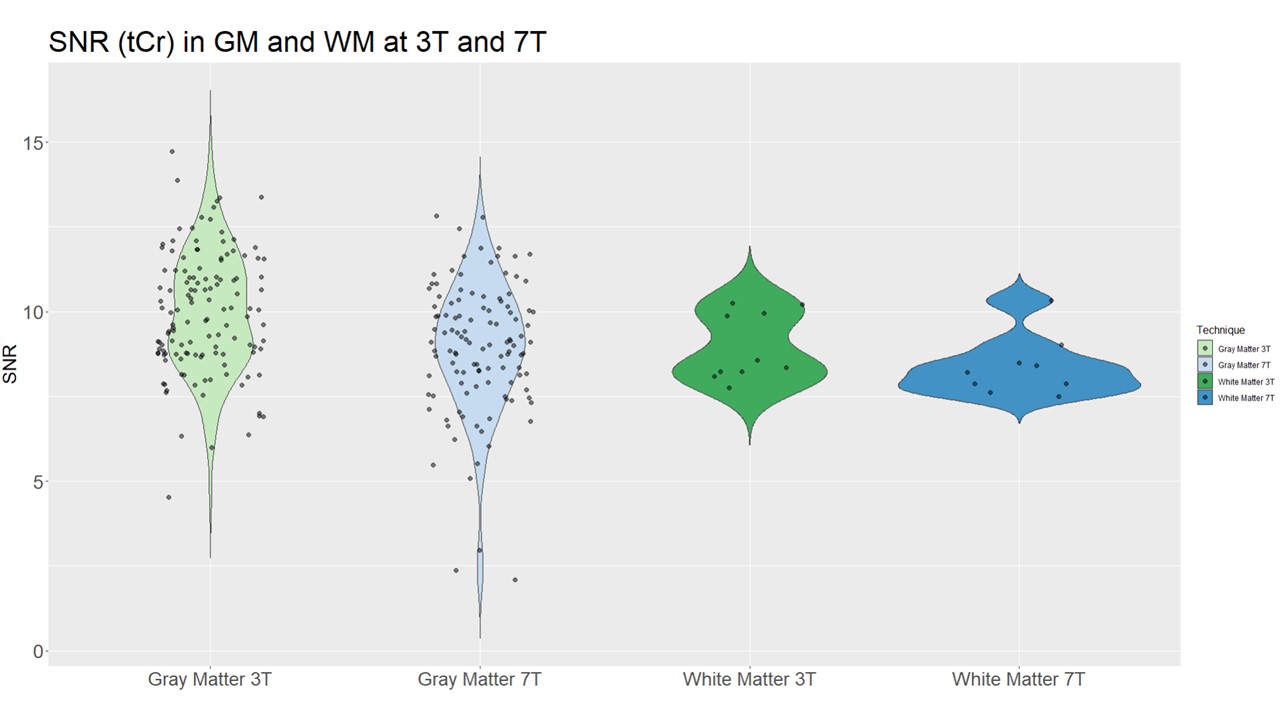
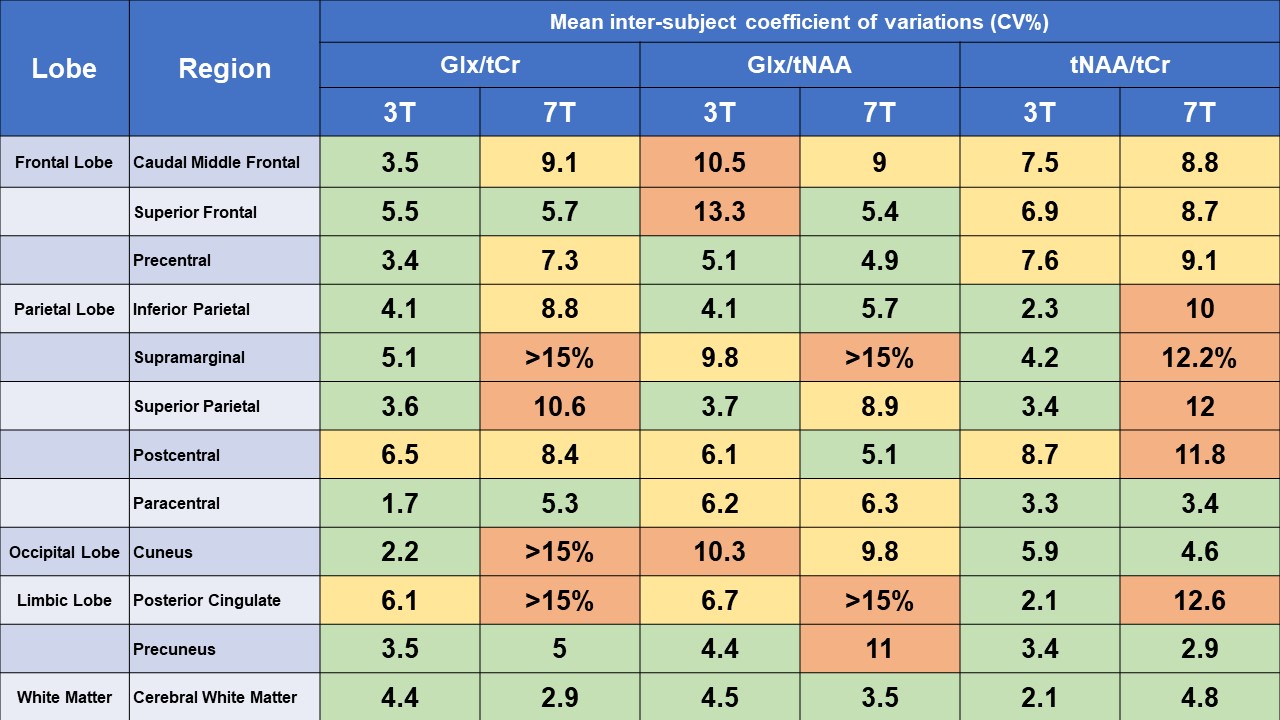
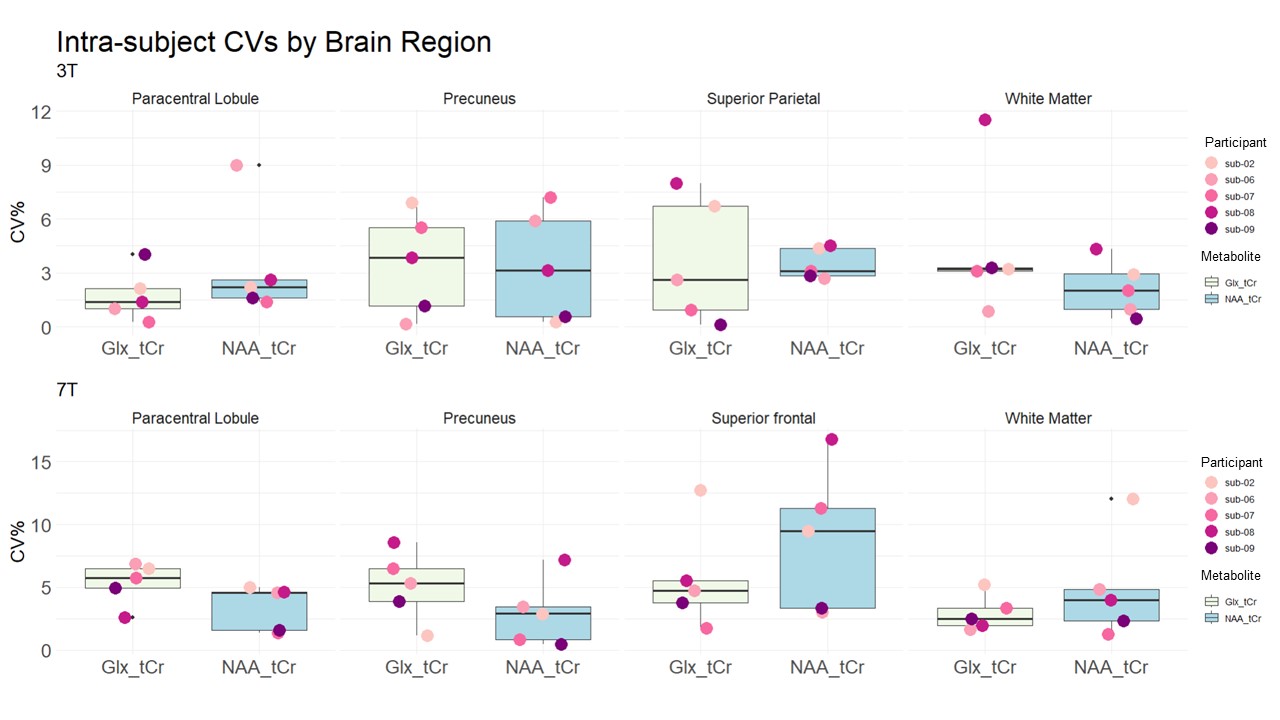
We have determined concentrations, CVs and SNR for three metabolite ratios across 13 brain regions by conducting test-retest experiments at 3T and 7T. Across all ROIs, the metabolite concentration ratio estimates were stable between subjects and within subject at both fields (Table 1). Mean±SD concentrations recorded were 1.58±0.2 for Glx/tCr, 0.89±0.15 for Glx/tNAA, and 1.61±0.2 for tNAA/tCr at 3T and 1.25±0.2 for Glx/tCr, 0.87±0.15 for Glx/tNAA, and 1.36±0.2 for tNAA/tCr at 7T in line with literature [2, 3]. The CVs for metabolite ratios across most ROIs did not exceed 12% (mean value, 6%; 3T, 7T), which indicated high reproducibility for both fields (Table 1). Total Creatine (tCr) SNR for GM and WM was similar across field strengths (Figure 2). The FWHM of tCr at 3T and 7T across ROIs were 0.07 ± 0.02 ppm and 0.05 ± 0.01 ppm, respectively.Discussion
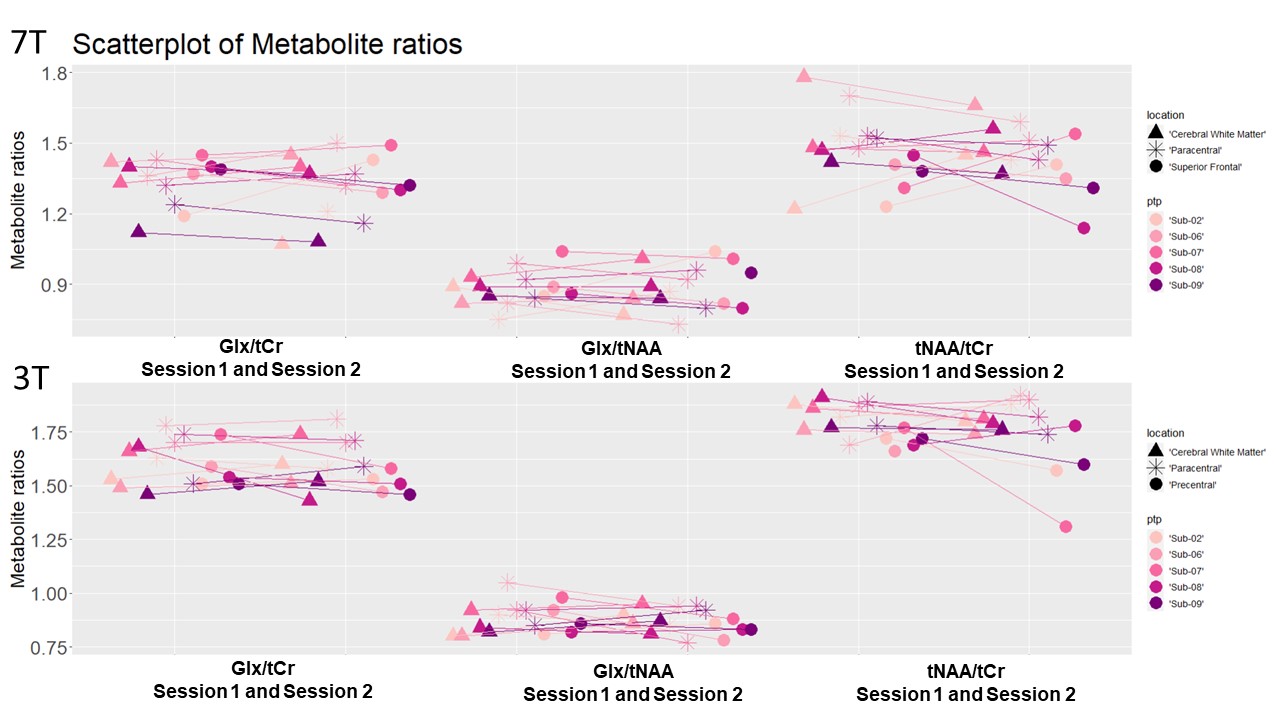
Results indicate a high degree of reproducibility for Glx/tCr, Glx/tNAA, and tNAA/tCr at both fields, with most ROIs demonstrating lower CVs (higher reproducibility) at 3T compared to 7T, likely due to the shorter scan time and reduced likelihood of subject movement during scanning. However, the variability across ROIs was substantial (2.1 CV% to 12 CV%) for NAA/tCr (Figure 3 and 4), which is likely related to lipid contamination in some regions/subjects. We observed variability related to voxel location with certain locations (e.g., rostral middle frontal ROI in frontal lobe) exhibiting far higher CV% than others (e.g., Paracentral Lobule in parietal lobe)(Table1, Figure 4). Field-strength did not significantly affect the SNR for WM and GM due to differences in voxel sizes (6.4 times larger at 3T) and measurement time (3 times shorter at 3T)(Figure 2).Conclusion
Our results suggest that the ratio of metabolite concentrations to creatine can be measured with 3D-FID-MRSI with a good reproducibility at 3T and 7T for most brain regions assessed.Acknowledgements
This research was Conducted by the Australian Research Council Training Centre for Innovation in Biomedical Imaging Technology (project number IC170100035) and funded by the AustralianGovernment. The authors acknowledge the facilities of the National Imaging Facility at the Centre for Advanced Imaging. We thank our research radiographers, Nicole Atcheson and Aiman Al-Najjar for assisting in the data collection. We are grateful to our participants for volunteering for this study.References
[1] W. Bogner, R. Otazo, and A. Henning, "Accelerated MR spectroscopic imaging-a review of current and emerging techniques," NMR Biomed, vol. 34, no. 5, p. e4314, May 2021, doi: 10.1002/nbm.4314.
[2] P. Moser et al., "Intra‐session and inter‐subject variability of 3D‐FID‐MRSI using single‐echo volumetric EPI navigators at 3T," Magnetic resonance in medicine, vol. 83, no. 6, pp. 1920-1929, 2020.
[3] G. Hangel et al., "Inter‐subject stability and regional concentration estimates of 3D‐FID‐MRSI in the human brain at 7 T," NMR in Biomedicine, vol. 34, no. 12, p. e4596, 2021.
[4] R. Mekle, V. Mlynárik, G. Gambarota, M. Hergt, G. Krueger, and R. Gruetter, "MR spectroscopy of the human brain with enhanced signal intensity at ultrashort echo times on a clinical platform at 3T and 7T," Magnetic Resonance in Medicine: An Official Journal of the International Society for Magnetic Resonance in Medicine, vol. 61, no. 6, pp. 1279-1285, 2009.
[5] W. Bogner et al., "Real-time motion-and B0-correction for LASER-localized spiral-accelerated 3D-MRSI of the brain at 3 T," Neuroimage, vol. 88, pp. 22-31, 2014.
[6] L. Hingerl et al., "Density‐weighted concentric circle trajectories for high resolution brain magnetic resonance spectroscopic imaging at 7T," Magnetic resonance in medicine, vol. 79, no. 6, pp. 2874-2885, 2018.
[7] L. Henschel, S. Conjeti, S. Estrada, K. Diers, B. Fischl, and M. Reuter, "Fastsurfer-a fast and accurate deep learning based neuroimaging pipeline," NeuroImage, vol. 219, p. 117012, 2020.
Figures