1851
Chemical shift displacement and within-voxel saturation of water signals on MRS data: prospective & retrospective corrections1Neuroimaging, King's College London, London, United Kingdom
Synopsis
Keywords: Spectroscopy, Brain, chemical shift displacement error
Motivation: Chemical shift displacement error (CSDE) and within-voxel saturation (WVS) lead to significant spatial displacement of the MRS voxel from the prescribed region and to overestimation of metabolite concentrations.
Goal(s): To compare prospective and retrospective corrections for severe CSDE+WVS observed in standard 3T GE PRESS data.
Approach: Prospective corrections utilize (a) removal of OVS saturation bands and (b) over-prescription of the shifted water voxel at data acquisition. Retrospective correction relies on Gasparovic’s equation and re-scaling of metabolite concentrations by the water vs. metabolite volume ratio.
Results: Corrected concentrations agree with literature. Both corrections are applicable in multi-centre studies and laboratories with limited technical support.
Impact: Chemical shift displacement error (CSDE) and within-voxel saturation (WVS) observed in standard 3T GE PRESS data can be corrected prospectively and retrospectively relative to data acquisition. These solutions are relevant to multi-centre studies and laboratories with limited pulse-sequence technical support.
Introduction
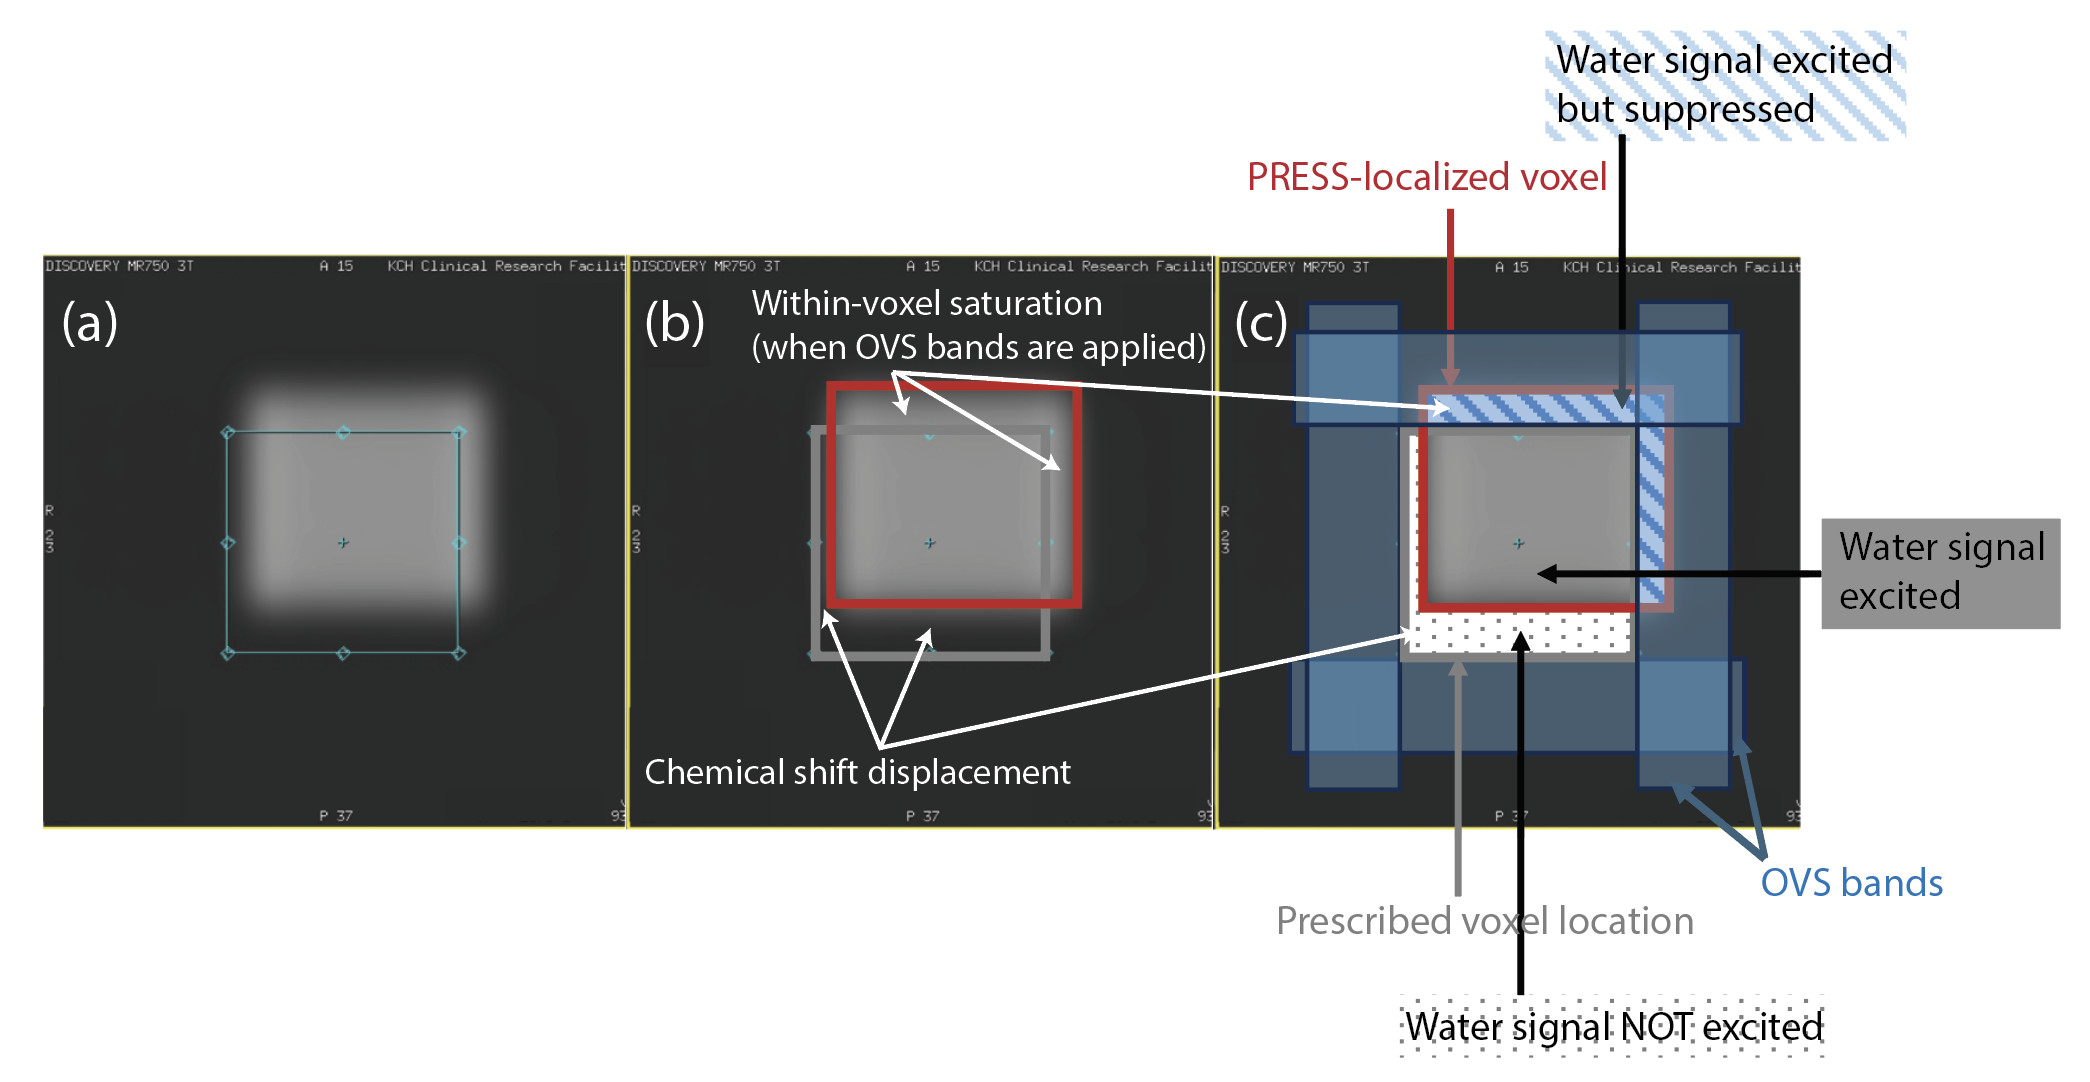
Context. Chemical shift displacement error (CSDE) results from the interaction between chemical shift and slice-selective radio-frequency (RF) pulses that achieve spatial selectivity. CSDE can reach ~35% spatial displacement, above the acceptable threshold of 10%1. Consensus papers1,2,3 recommend minimizing CSDE by replacing PRESS localization4 with semi-LASER5. Nevertheless, PRESS prevails in multi-centre studies and research laboratories with limited technical support6,7.Problem. CSDE on 3T General Electric (GE) PRESS data is particularly problematic due to within-voxel saturation (WVS) of the water signal. There is an imbalance between the volumes from where the water and metabolite signals arise, leading to water signal underestimation, and overestimation of water-scaled metabolite concentrations8,9. Figure 1 shows CSDE+WVS effects in data acquired with 2.7ppm centre frequency (CF) instead of 4.7ppm for the non-suppressed water scan, low-bandwidth (<3kHz) PRESS-localization pulses, with outer volume suppression (OVS-VSS)10 pulses with 4.7ppm CF.
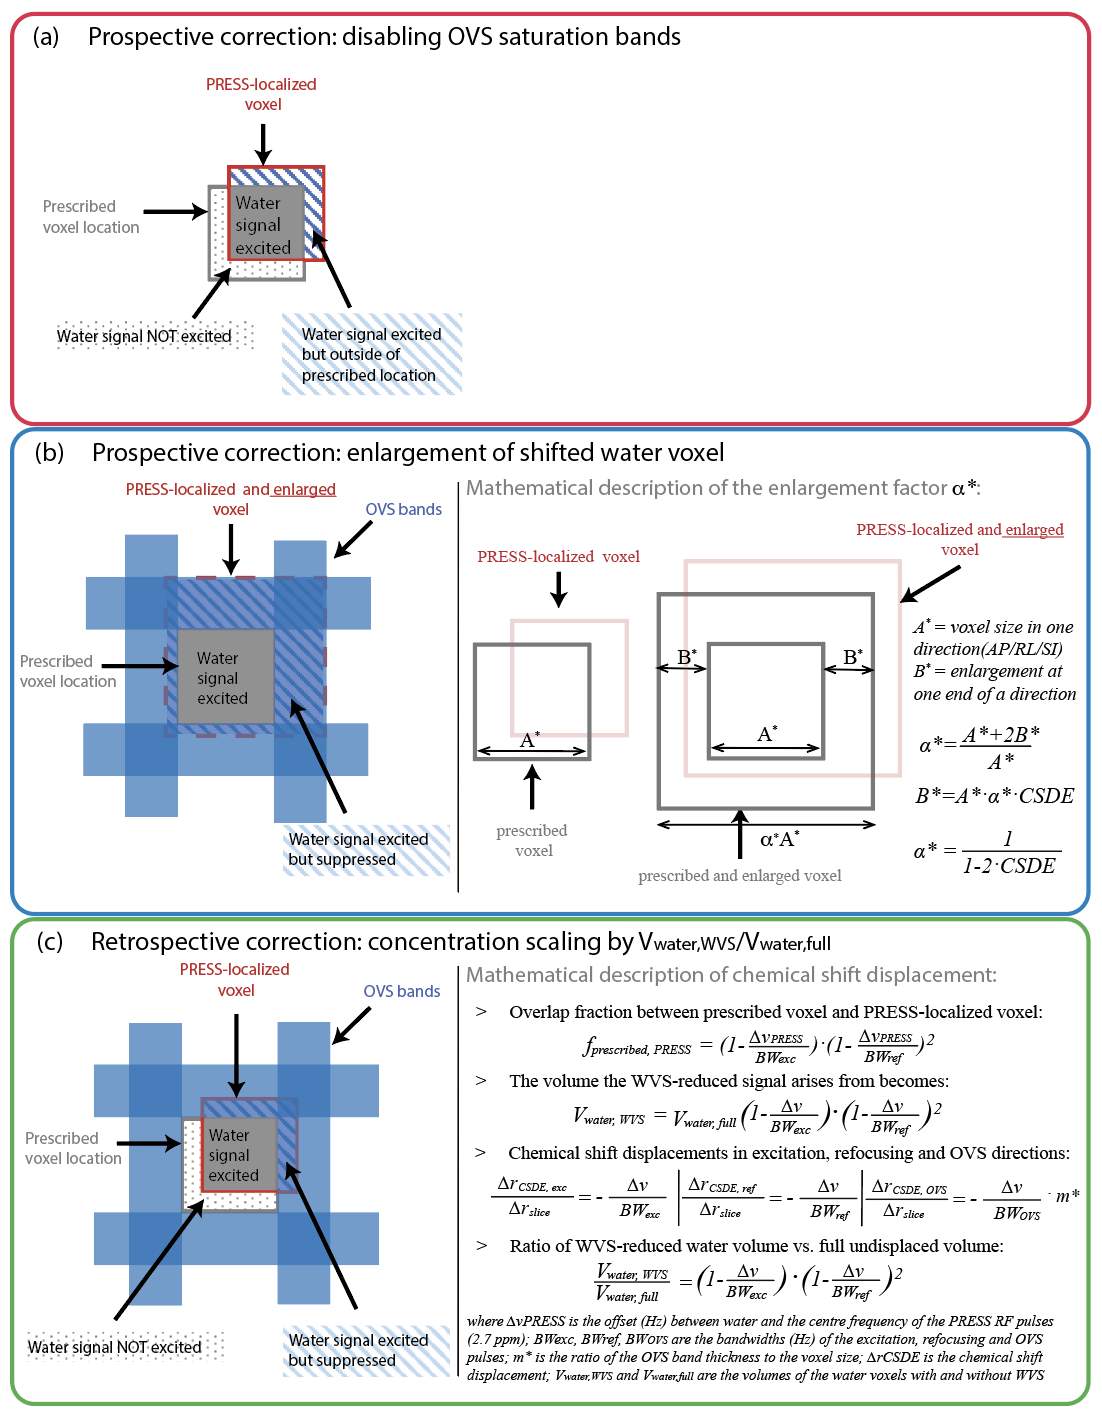
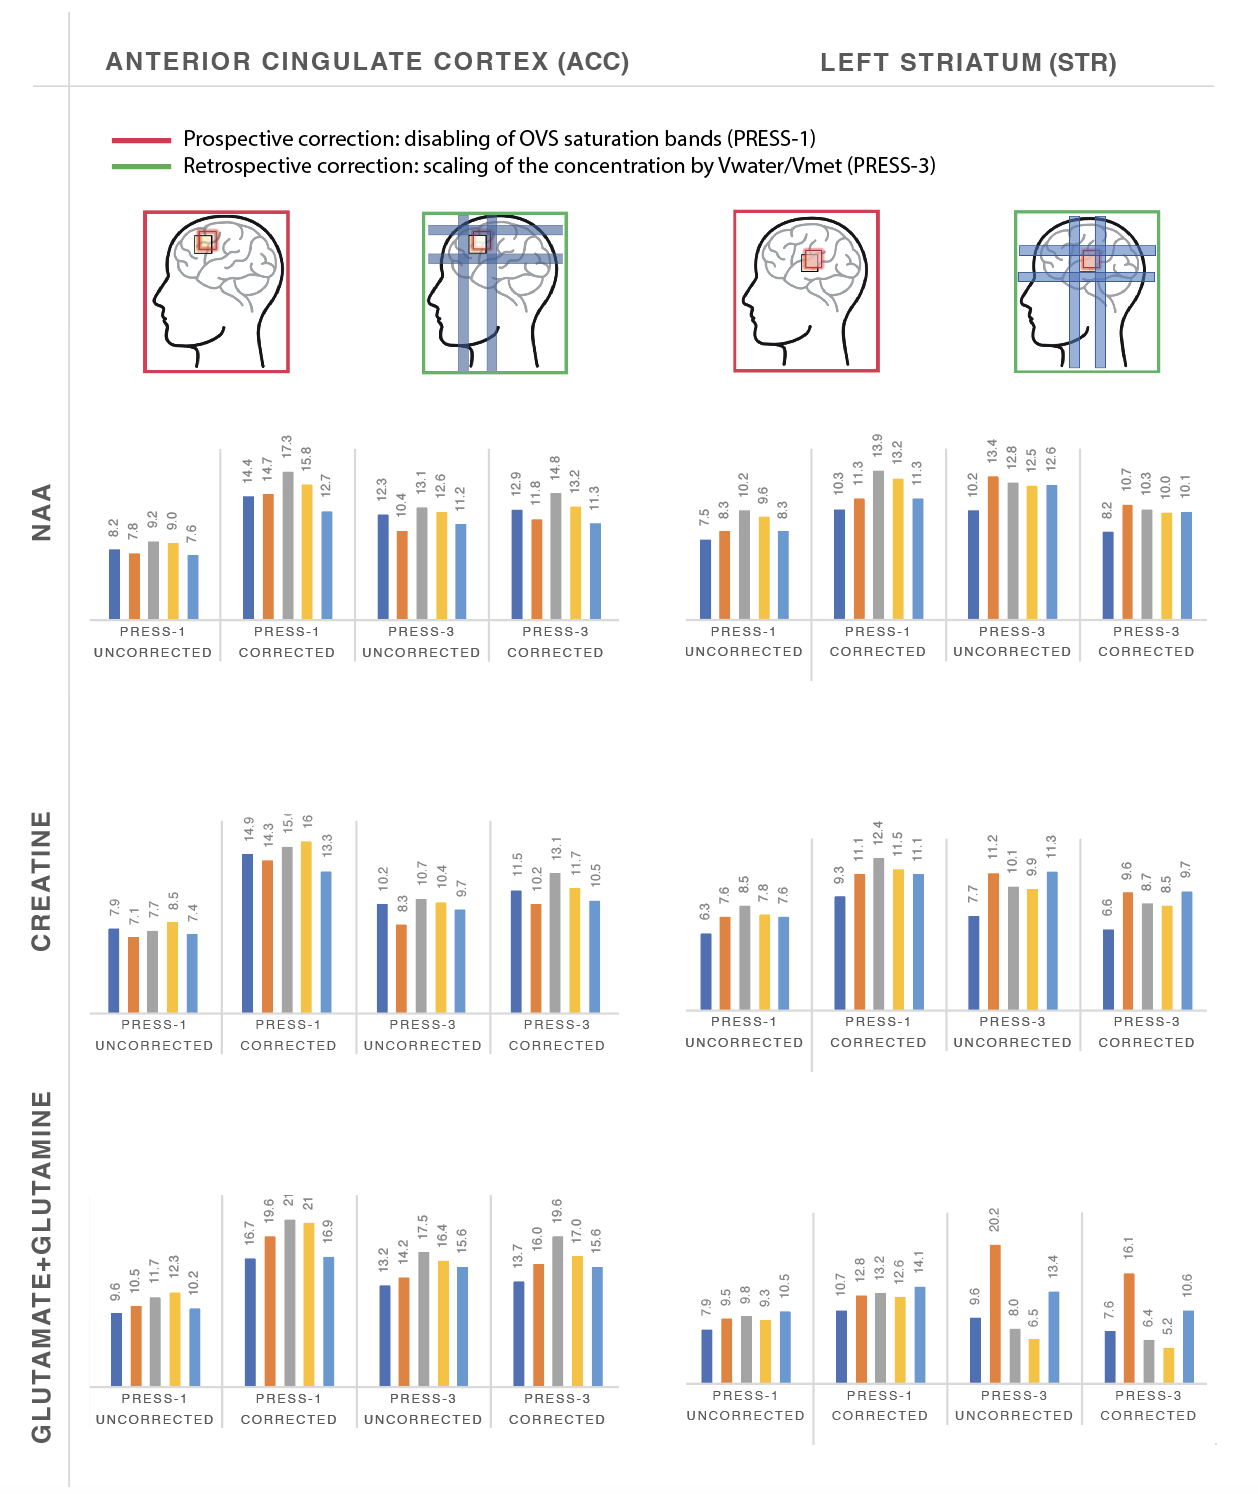
Solution. Prospective correction: Underestimation of the water signal can be reduced by disabling OVS pulses or by enlarging the shifted water voxel (as shown previously11-14). Retrospective correction: The size of the OVS-impinged water voxel can be calculated and used to correct water-scaled metabolite concentrations. Figure 2 illustrates both solutions and their mathematical descriptions. Uncorrected and corrected concentrations using both approaches were compared.
Methods
MRS data were acquired on a 3T-GE Discovery MR750 scanner (General Electric,USA) using a body coil and a Nova 32-channel head coil (Nova Medical Inc,USA) for transmit and receive. Five volunteers (3F, 24y±6y) were recruited; informed consent and ethical approval were obtained before scanning. Data were acquired (voxel size 2×2×2cm3) in the anterior cingulate cortex (ACC) and left-striatum (STR). Axial A/P orientation and the PRESS product-sequence were used (TR/TE=3000ms/30ms; 96/16 water-suppressed/water-unsuppressed acquisitions; 5kHz receiver bandwidth; 4096 data points, 8-step phase cycle, CHESS water suppression, automated shimming).Prospective CSDE+WVS correction. A PRESS dataset was acquired using OVS pulses off (PRESS-1). A second PRESS dataset was acquired with an enlarged shifted water voxel. The enlargement was achieved using OVS pulses on and a voxel over-prescription factor (OVERPRESS) of 1.7 (PRESS-2), described elsewhere14 and optimised in phantom & human scans.
Retrospective CSDE+WVS correction. Another PRESS dataset was acquired with OVS pulses on and no enlargement of the nominal voxel, OVERPRESS=1 (PRESS-3). Concentrations were corrected using the (water,WVS) vs. (water,full) volume ratio - determined as the overlapping fraction between the calculated size of the shifted and trimmed water voxel and the prescribed voxel size. This fraction $$$\frac{ V_{water,WVS}}{V_{water,full}}$$$ was included in Gasparovic’s equation15-16 for metabolite concentration correction:
$$Conc_{metabolite}=\frac{Ampl_{metabolite}(VolFraction_{GM,signal}RelaxAtten_{water,GM}+VolFraction_{WM,signal}RelaxAtten_{water,WM}+VolFraction_{CSF,signal}RelaxAtten_{water,CSF})}{(Ampl_{water}(1-VolFraction_{CSF,signal})RelaxAtten_{metabolite}}\cdot{Conc_{water}}\cdot{\frac{ V_{water,WVS}}{V_{water,full}}} $$
Spectra were pre-processed using FID-A scripts and analysed with LCModel (version 6.3-1L) and a basis set (3T, GE, TE=30ms) provided with LCModel. Metabolite concentrations were corrected for water T1 and T2 relaxations and tissue fractions. Uncorrected and corrected water-referenced concentrations were reported in institutional units (i.u.) and millimolar (mM). Voxel positions were obtained using Gannet functions and calculated water voxel masks overlayed on structural scans in FSLeyes.
Comparison of correction solutions. (a) PRESS-1, PRESS-2, and PRESS-3 were compared in one dataset (1volunteer*2voxels) for validation of the CSDE correction using Gasparovic’s equation. (b) Subsequently, PRESS CSDE-corrected concentrations obtained with PRESS-1 and PRESS-3 were compared in a larger sample (5volunteers*2voxels).
Results
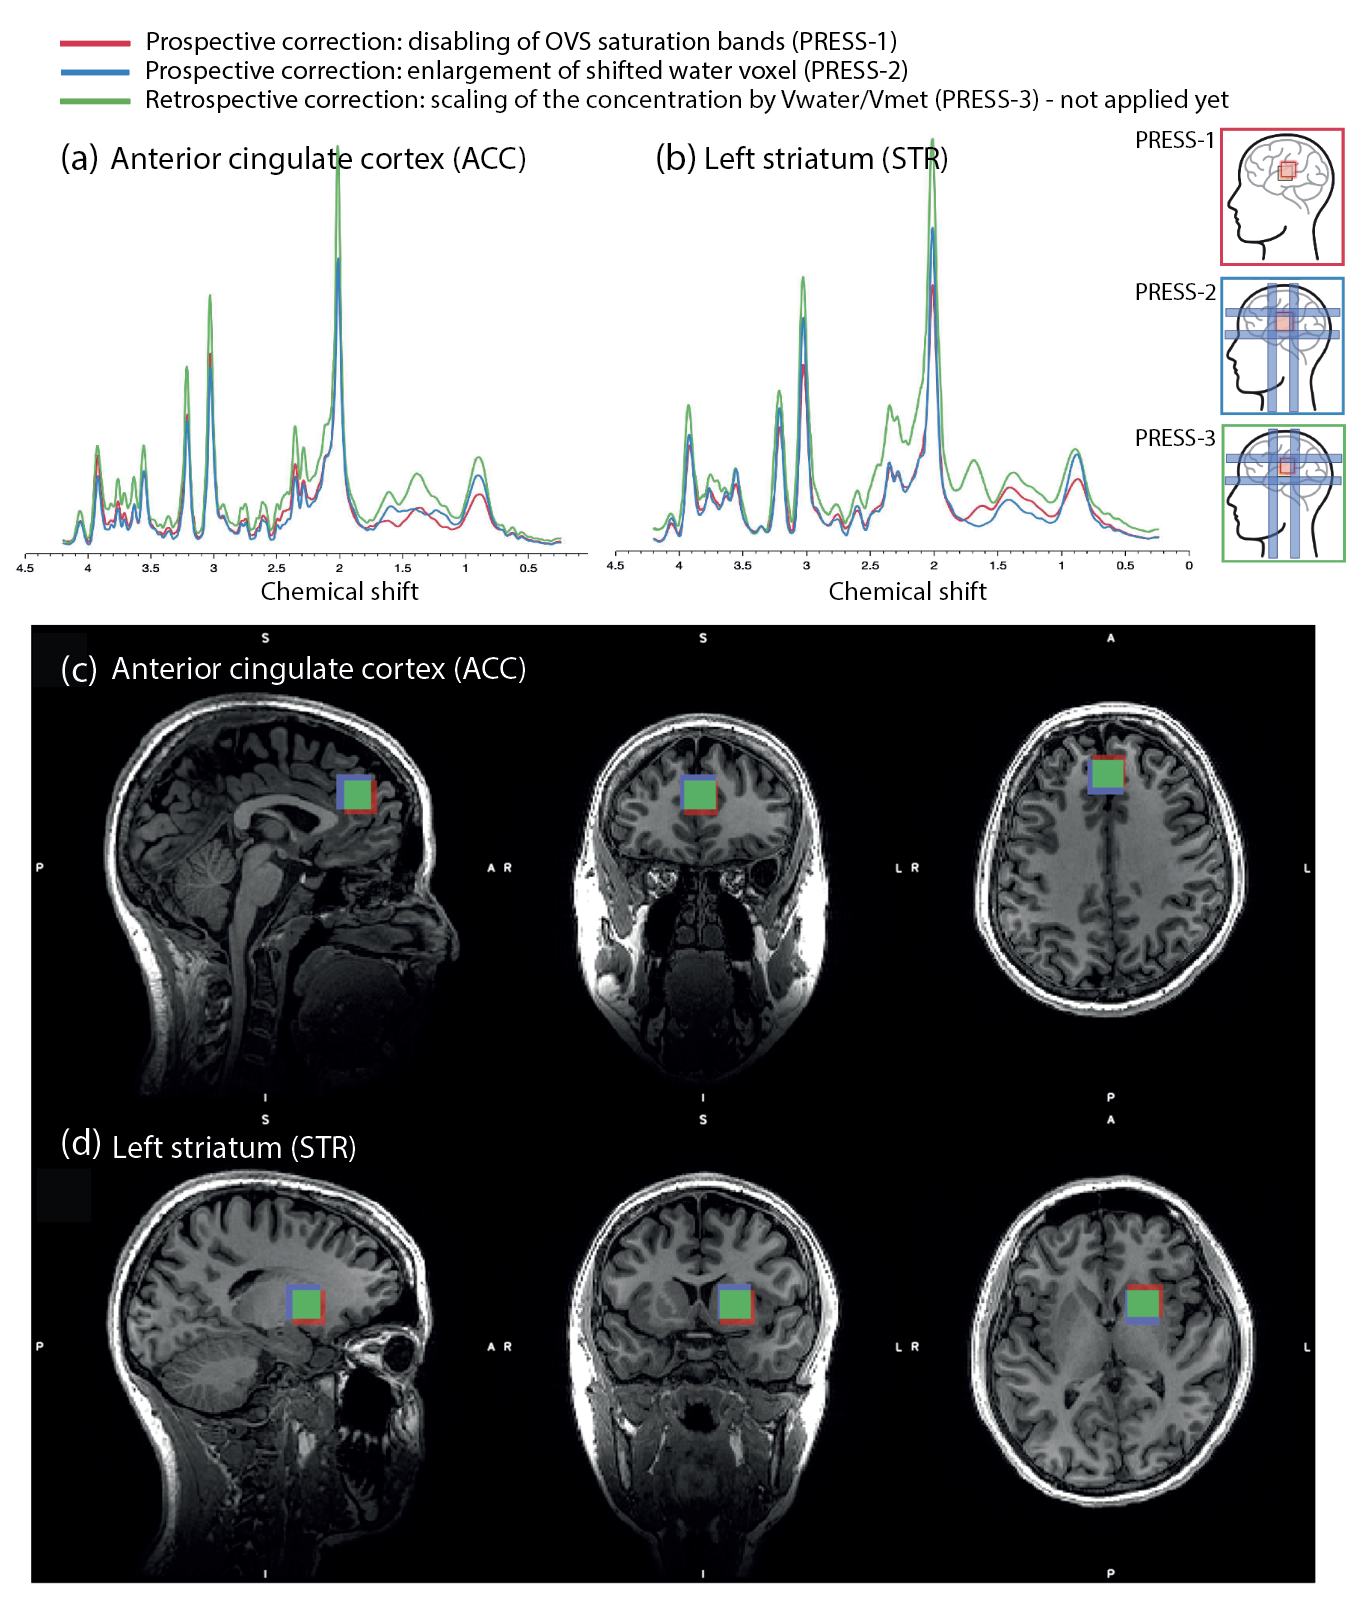
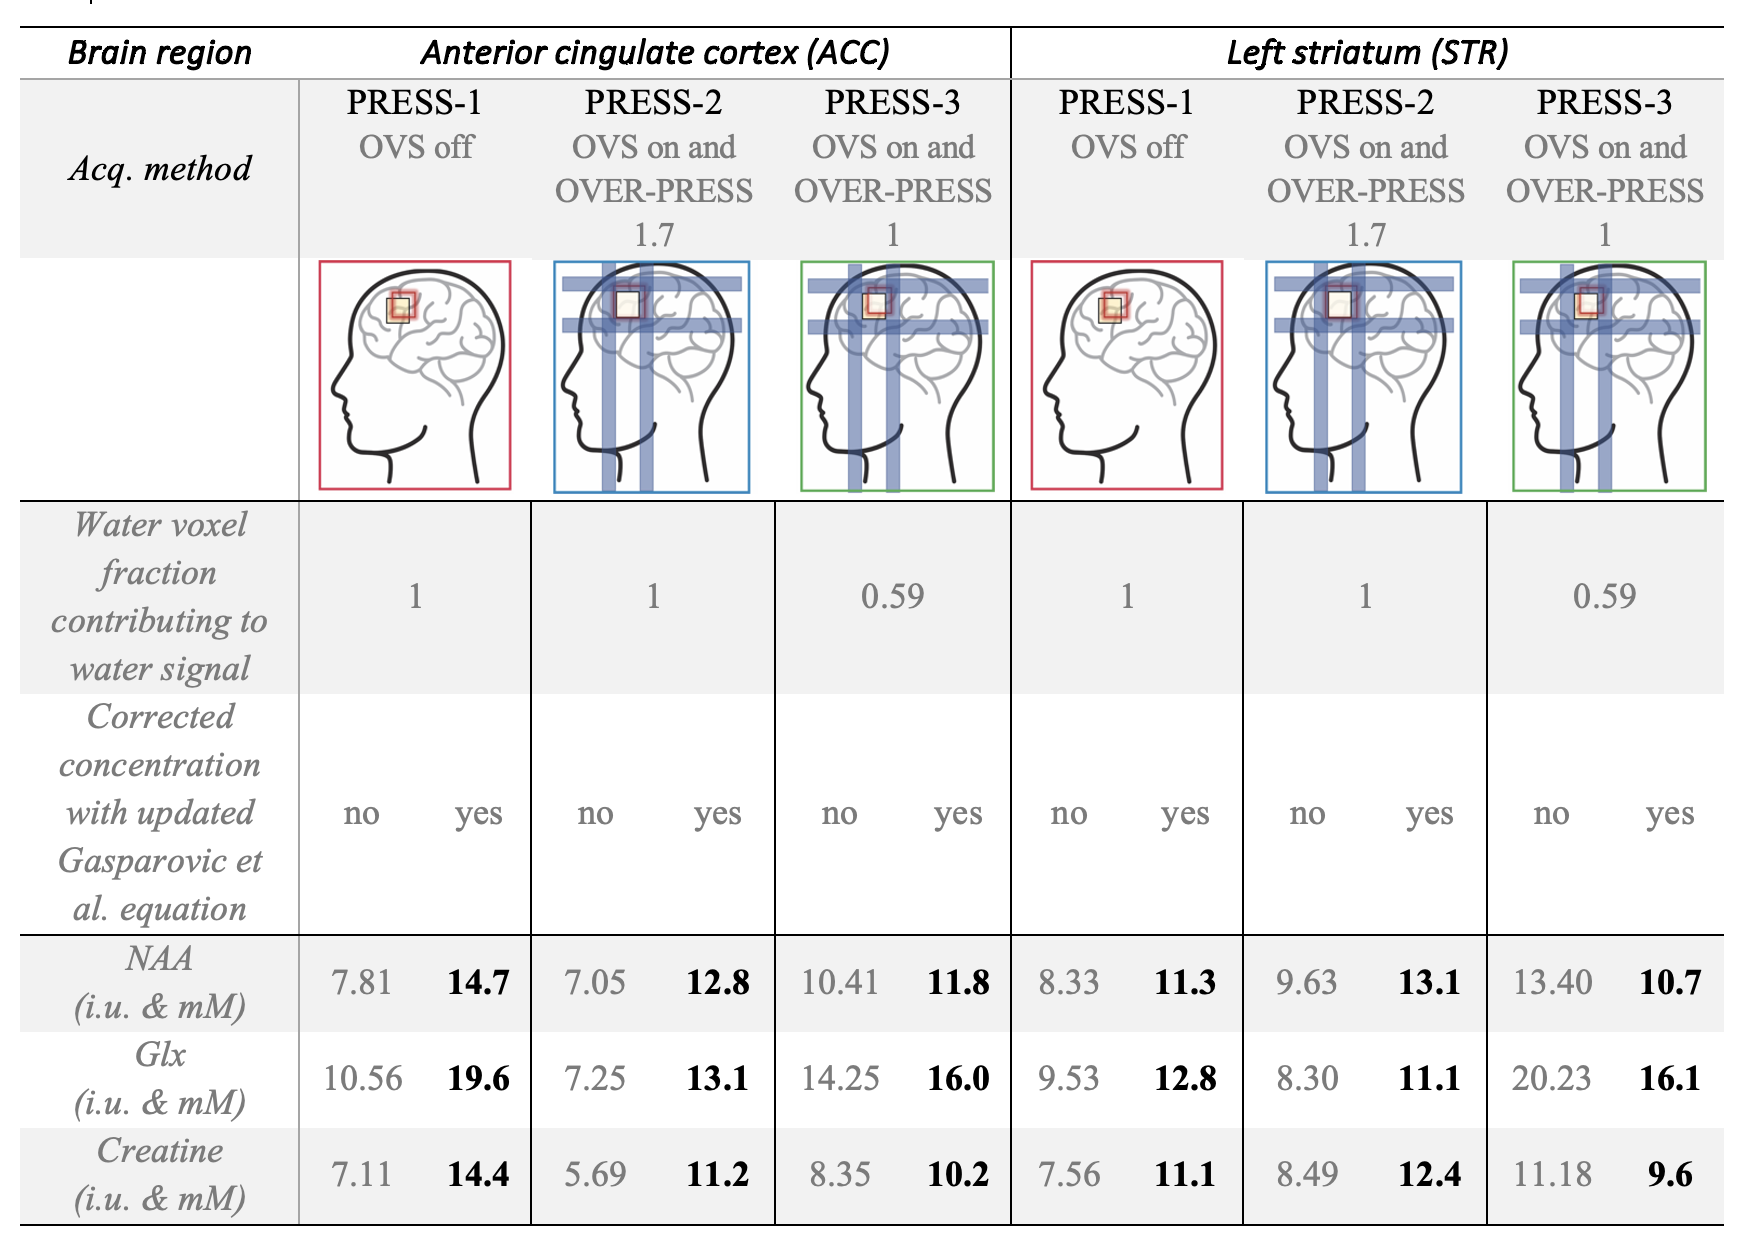
Comparison of correction solutions. (a) Figure 3 illustrates spectra and voxel locations for the PRESS datasets acquired for validation. Figure 4 shows corresponding uncorrected and corrected creatine, Glx and NAA concentration estimates. (b) Figure 5 presents uncorrected and corrected estimates obtained with PRESS-1 and PRESS-3 methods from five volunteers. Corrected concentrations agreed with literature values17. CRLBs were 2-3% for creatine and NAA, while average Glx ACC and STR CRLBs were 6% and 11%.Discussion and Conclusion
Prospective and retrospective CSDE+WVS corrections were implemented and tested for 3T-GE PRESS data.CSDE+WVS induce an ~40% reduction of the PRESS-excited water voxel volume (4.75mL instead of 8mL; water voxel fraction = ~59%) which causes on average a 67% inflation in measured concentrations estimates. The uncorrected concentrations in Figure 4 show a wider range of inflation (30%-150%) given the complexity of metabolite spectra and the SNR level (i.e. Glx; noisier striatum spectra). PRESS data corrupted by CSDE+WVS were corrected retrospectively with Gasparovic’s updated equation, yielding similar concentrations to those obtained with prospective correction (Figures 4-5).
The limitation of PRESS-1 method is the inappropriate metabolite localization. This translates to erroneous tissue fractions and wrong concentration corrections. The disadvantage of PRESS-2 method is that signal from the enlarged voxel experiences refocusing at the intersection of the OVS bands, contaminating the acquisition. It also requires some pulse sequences knowledge. The drawback of PRESS-3 method is that the correction factor must be re-calculated for other pulse bandwidths.
Acknowledgements
The authors would like to express their gratitude to Richard Edden (Johns Hopkins University School of Medicine, USA) for his substantial contribution related to the retrospective CSDE correction and its implementation.
References
References1. Öz, G., Deelchand, D. K., Wijnen, J. P., Mlynárik, V., Xin, L., Mekle, R., … Tkáč, I. (2020). NMR Biomed, 1–18.
2. Maudsley, A. A., Andronesi, O. C., Barker, P. B., Bizzi, A., Bogner, W., Henning, A., … Soher, B. J. (2020). NMR Biomed, 1–22.
3. Wilson, M., Andronesi, O., Barker, P. B., Bartha, R., Bizzi, A., Bolan, P. J., … Howe, F. A. (2019). MRM, 82(2), 527–550.
4. Bottomley, P. A. (1987). Annals of the New York Academy of Sciences.
5. Scheenen, T. W. J., Klomp, D. W. J., Wijnen, J. P., & Heerschap, A. (2008). MRM, 59(1), 1–6.
6. Považan, M., Mikkelsen, M., Berrington, A., Bhattacharyya, P. K., Brix, M. K., Buur, P. F., … Barker, P. B. (2020). Radiology, 295(1), 171–180.
7. Naaijen, J., Zwiers, M. P., Amiri, H., Williams, S. C. R., Durston, S., Oranje, B., … Lythgoe, D. J. (2017). Neuropsychopharmacology, 42(12), 2456–2465.
8. Edden, R. A. E., & Barker, P. B. (2007). MRM, 58(6), 1276–1282.
9. Edden, R. A. E., Schär, M., Hillis, A. E., & Barker, P. B. (2006). MRM, 56(4), 912–917.
10. Tran, T. K. C., Vigneron, D. B., Sailasuta, N., Tropp, J., Le Roux, P., Kurhanewicz, J., … Hurd, R. (2000). MRM, 43(1), 23–33.
11. McLean, M. A., Barrett, T., Gnanapragasam, V. J., Priest, A. N., Joubert, I., Lomas, D. J., … Sala, E. (2011). MRM, 65(4), 914–919.
12. McLean, M. A., Priest, A. N., Joubert, I., Lomas, D. J., Kataoka, M. Y., Earl, H., … Sala, E. (2009). MRM, 62(4), 855–861.
13. McLean, M. A., Sun, A., Bradstreet, T. E., Schaeffer, A. K., Liu, H., Iannone, R., … Griffiths, J. R. (2012). JMRI, 36(2), 468–475.
14. Rotaru, D. G., Tsivaka, D., & Lythgoe, D. J. (2019). ISMRM conference proceedings (pp. 3–4).
15. Gasparovic, C., Chen, H., & Mullins, P. G. (2018). NMR Biomed, 31(6), 1–9.
16. Gasparovic, C., Song, T., Devier, D., Bockholt, H. J., Caprihan, A., Mullins, P. G., … Morrison, L. A. (2006). MRM, 55(6), 1219–1226.
17. Govindaraju. NMR Biomed. 2000;13:129-153
Figures